


Prometheus is the de facto standard of cloud-native monitoring. The way it works is really simple: applications provide a /metrics HTTP API endpoint to expose metric data in text format. Prometheus collects application metrics from /metrics endpoints, stores the collected metrics on disk and allows analyzing the collected metrics via http-based querying API.
Although the Prometheus ecosystem has a rich amount of components, its core, the Prometheus Server (hereinafter referred to as Prometheus), is still shipped as a single binary that can run without additional dependencies, making its installation and deployment much simpler.
On the flip side, this also makes Prometheus difficult to scale. For example, initially, you can easily run Prometheus on a machine with 2 CPUs and 4GiB of memory to monitor 100 applications. But soon, you may need to monitor 10k or even up to 100k applications. In order to accomplish this Prometheus will require more resources than a limited single machine can provide. Moreover, these applications may be deployed in different clusters and availability zones. Using a single Prometheus to collect data from all over is inefficient.
Luckily, Prometheus also offers two important features:
An example large scale multi-application architecture utilizing the above features may look like:
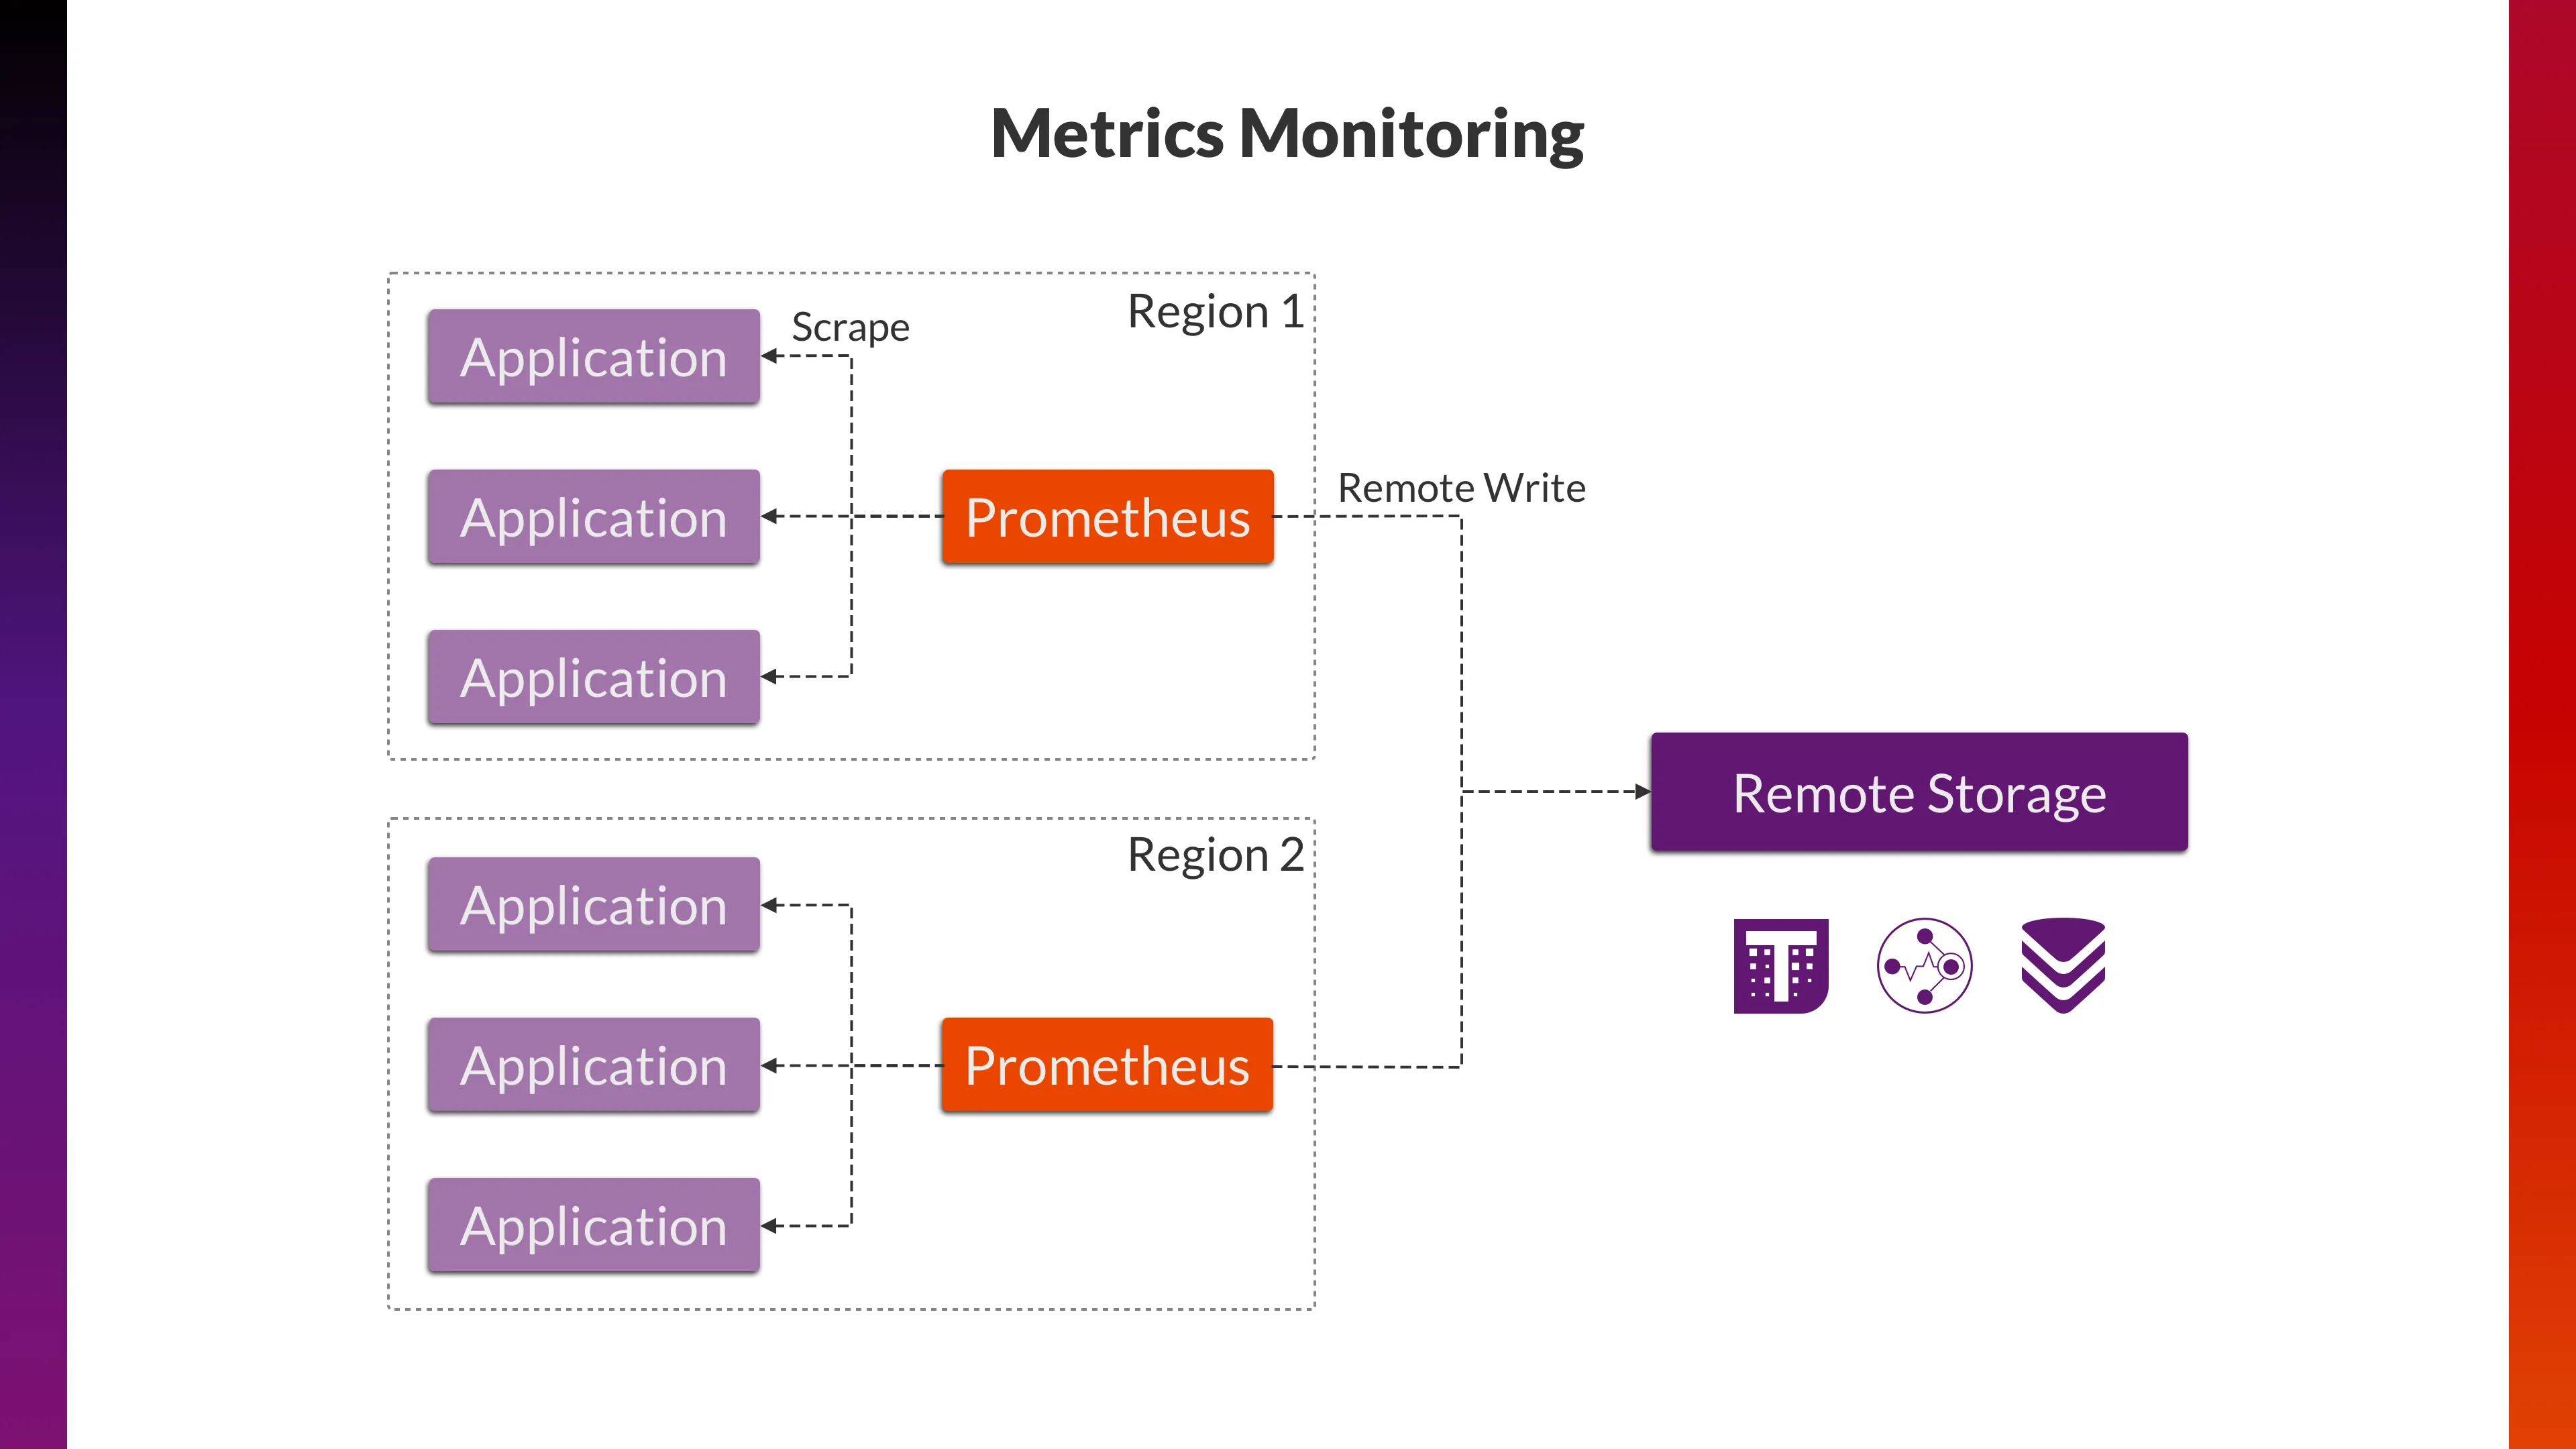 Monitoring architecture
In 2019, OpenTelemetry was born. It provides a unified and open-source observability standard and helps users avoid migration pitfalls due to vendor lock-in.
OpenTelemetry comes with many concepts, such as Signal, which means a type of Telemetry, like Tracing Signal, Metric Signal, and Log Signal. The protocol for transmitting telemetry data between different components is called the OpenTelemetry Protocol (OTLP).
When talking about metrics, it’s easy to compare OpenTelemetry with Prometheus:
| Prometheus | OpenTelemetry | |
|---|---|---|
| Data Model | Metrics | Metrics Signal |
| Protocol of Data Propagation | Remote Write | OTLP |
Have you ever wondered: Why should we consider OpenTelemetry when Prometheus data model and remote write protocol are already the widely adopted and supported de facto standard in cloud-native monitoring?
Suppose you are already running Kubernetes. Many components of the Kubernetes ecosystem expose metric data in the Prometheus text format. For example:
Since these components do not yet provide OpenTelemetry support (for pushing data in the OTLP format), we still have to scrape them and propagate the data to remote storage. In this scenario, which is more performant, Prometheus or OpenTelemetry?
Let’s run a benchmark.
We will run Prometheus (Agent Mode), OpenTelemetry Collector, and vmagent (a lightweight agent from VictoriaMetrics) to scrape data from 1200 Node exporters scattered across 3 regions respectively, and send the data to the receiver via different protocols.
To support OTLP, remote write and its variants, along with various custom testing protocols without encountering any bottlenecks, we built this No-op receiver which only perform decompression and unmarshalling on the data, and record some statistical metrics, but without data persistence operations.
Here is the breakdown of the various components involved:
| Version | Machine Type | vCPUs | Memory (GB) | Storage Type | |
|---|---|---|---|---|---|
| Prometheus | 2.53.3 | e2-highcpu-2 | 2 | 2 | Standard persistent disk(HDD) |
| Prometheus | 3.0.1 | e2-highcpu-2 | 2 | 2 | Standard persistent disk(HDD) |
| OpenTelemetry Collector | v0.115.0 | e2-highcpu-2 | 2 | 2 | Standard persistent disk(HDD) |
| vmagent | v1.108.0 | e2-highcpu-2 | 2 | 2 | Standard persistent disk(HDD) |
| Node exporter | 1.8.2 | e2-micro | 2(0.25) | 1 | Standard persistent disk(HDD) |
| No-op Receiver | N/A | n2d-highcpu-4 | 4 | 4 | Balanced persistent disk(SSD) |
The overall benchmark architecture is as follows:
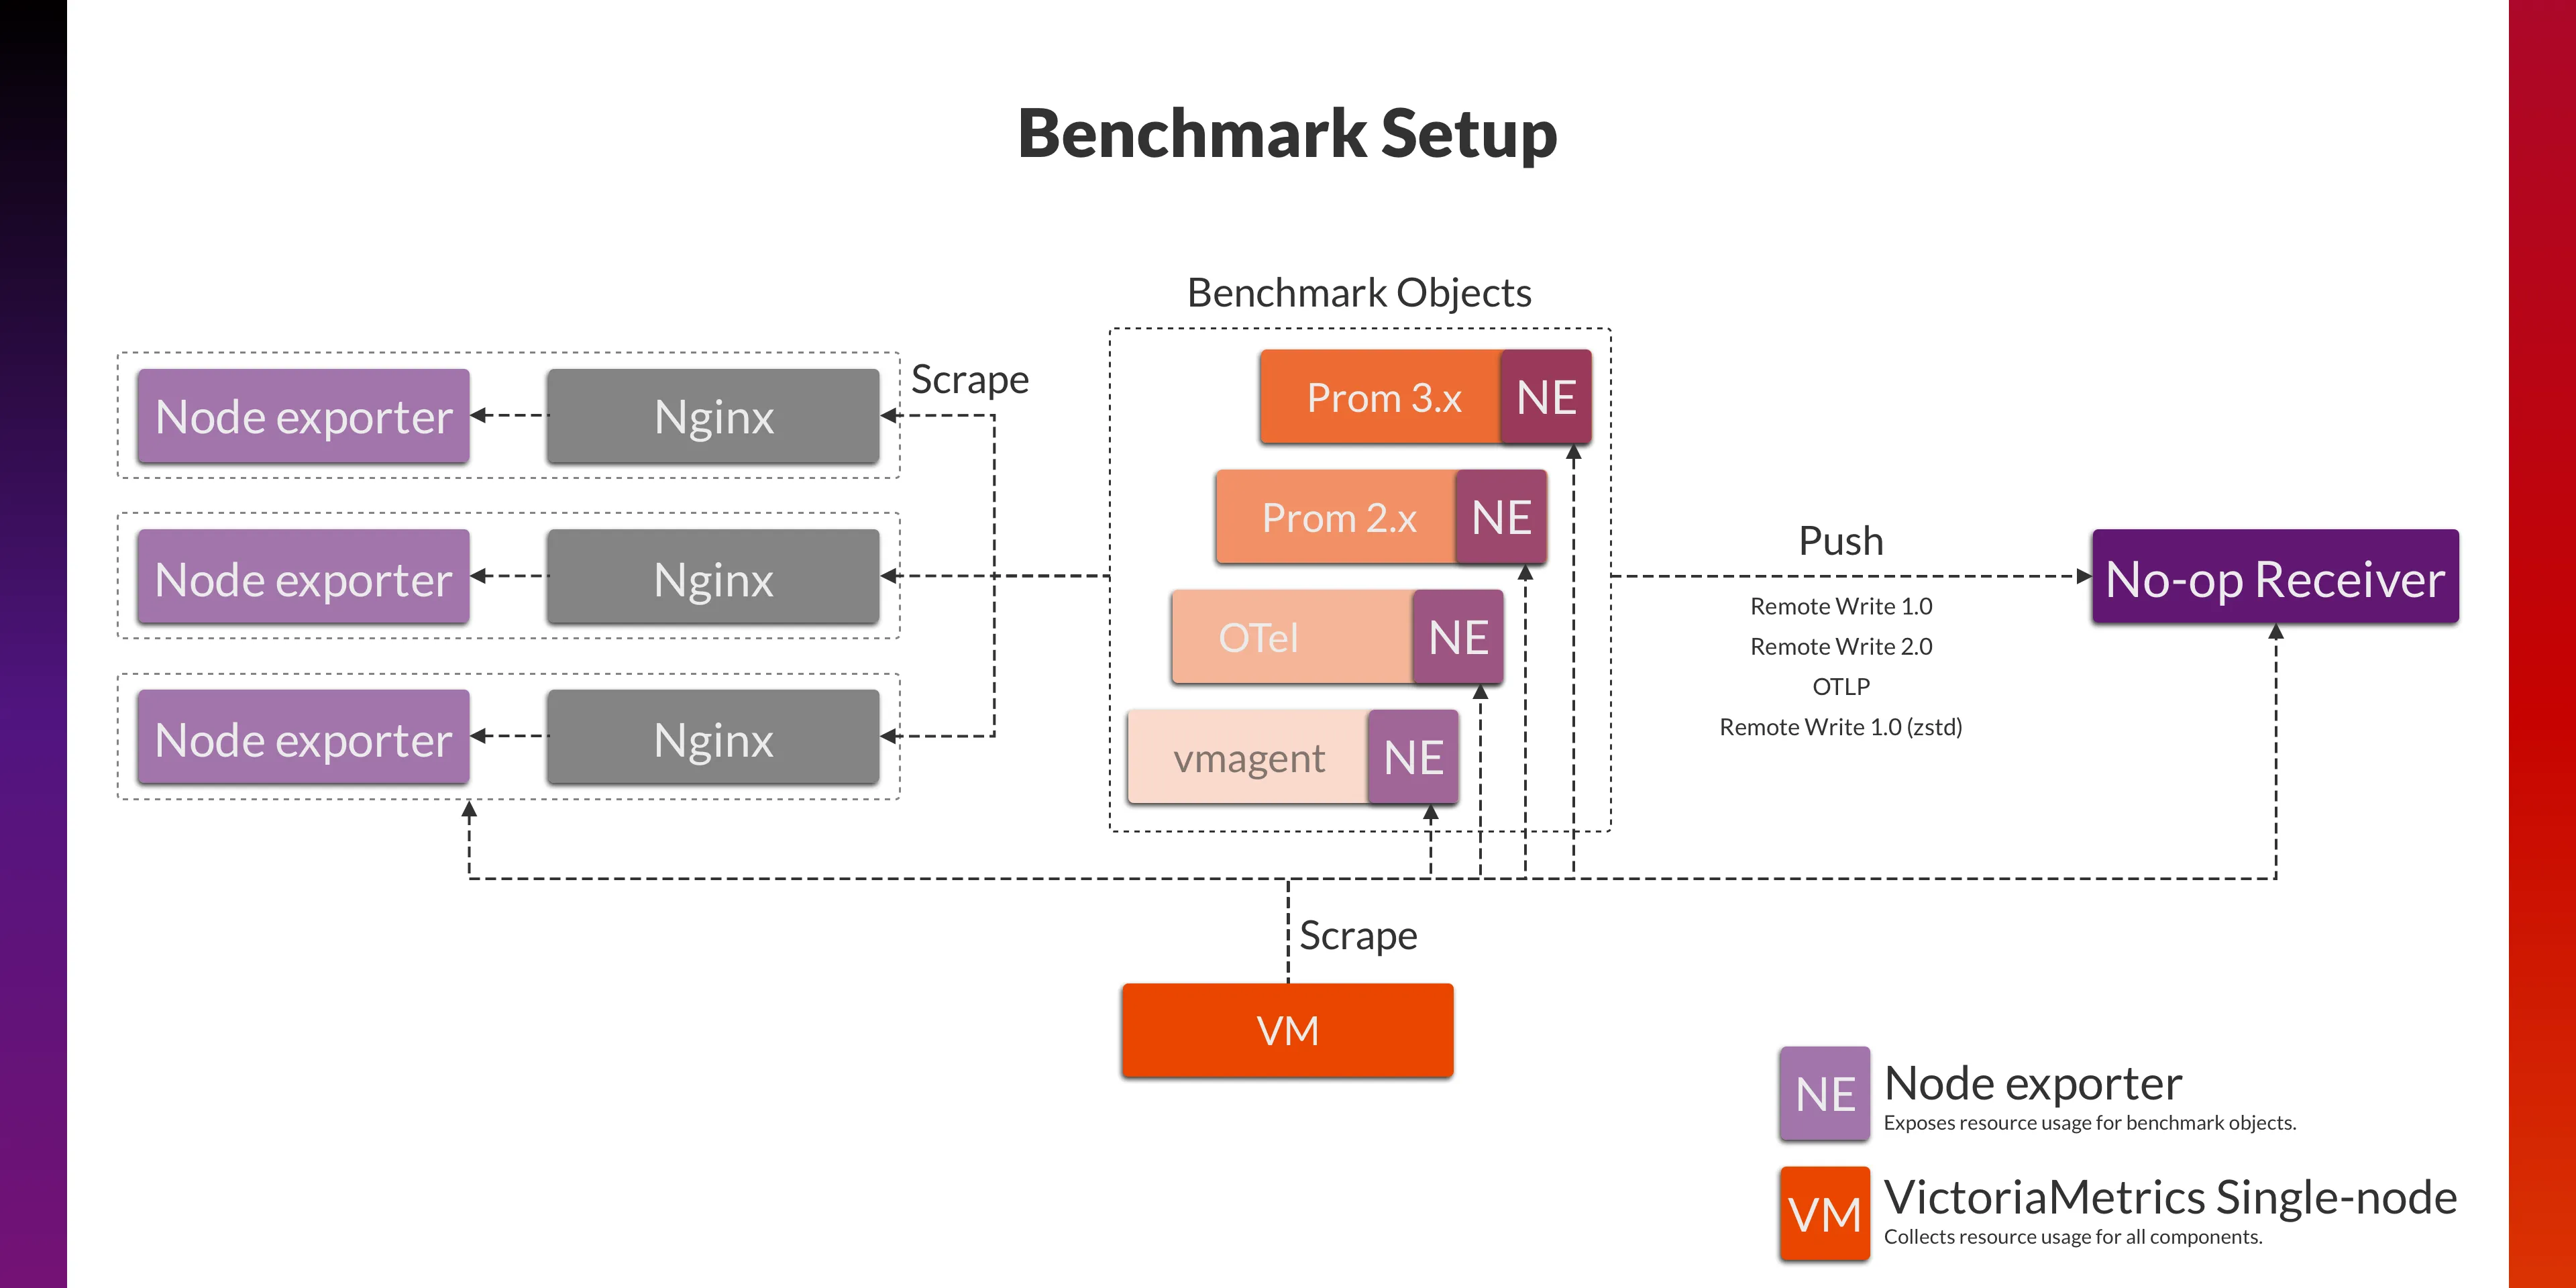 Benchmark architecture
Initially, as a baseline, we ran the benchmark for several days to ascertain the resource usage of different benchmark objects.
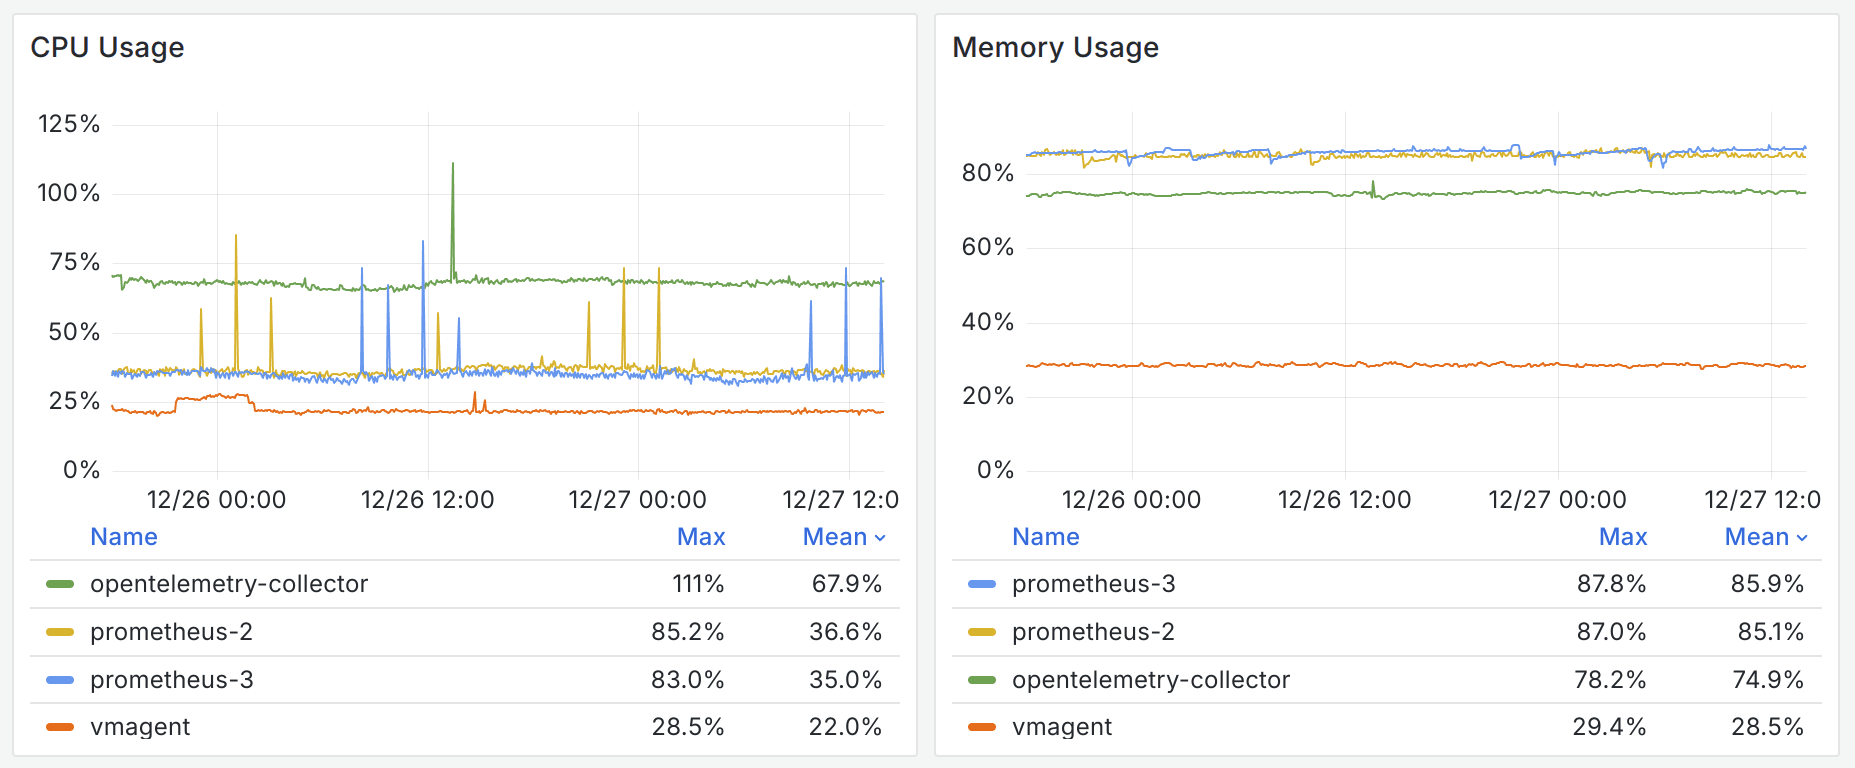 Result #1 cpu and memory
It seems upgrading Prometheus from version 2.x to 3.x won’t save any CPU or memory for you. And Prometheus uses the most memory among the benchmark objects. The OpenTelemetry Collector, served as a data collection agent, has very high CPU overhead and relatively high memory usage.
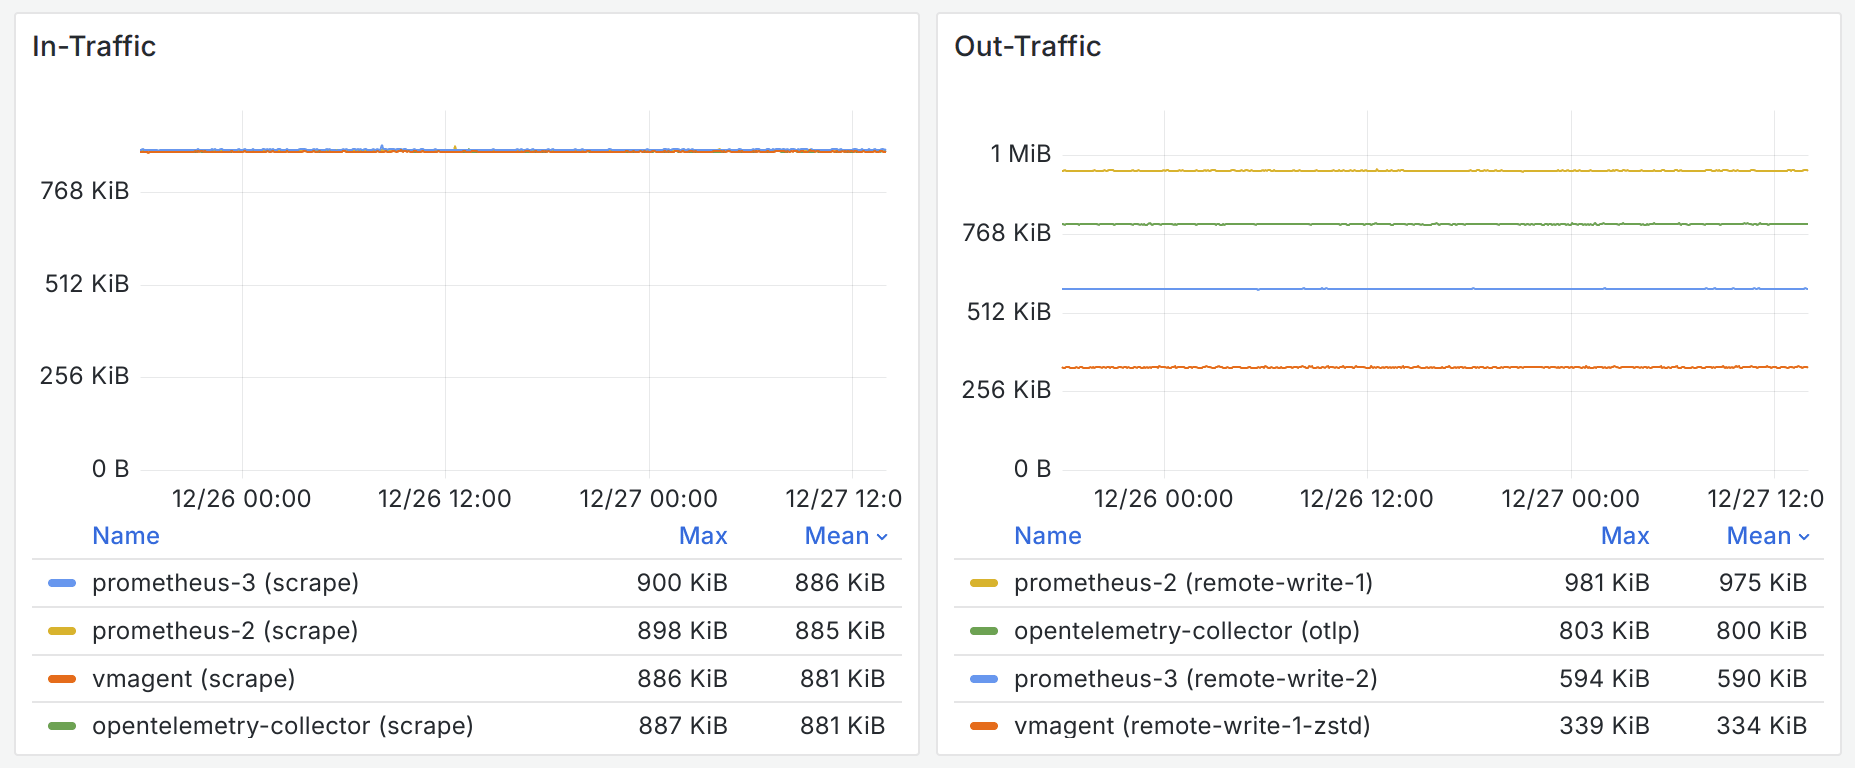 Result #1 traffic
The network traffic reflects the efficiency of the different protocols. Since benchmark objects were scraping the same targets, the in-traffic is mostly identical. The out-traffic shows that remote write 2.0 in Prometheus 3.x saves 40% of bandwidth compared with remote write 1.0. OTLP is also not very efficient. vmagent uses VictoriaMetrics remote write protocol, a variant of Prometheus remote write 1.0, which employs a different compression algorithm zstd in replacement of the less efficient Snappy, resulting in significant bandwidth savings.
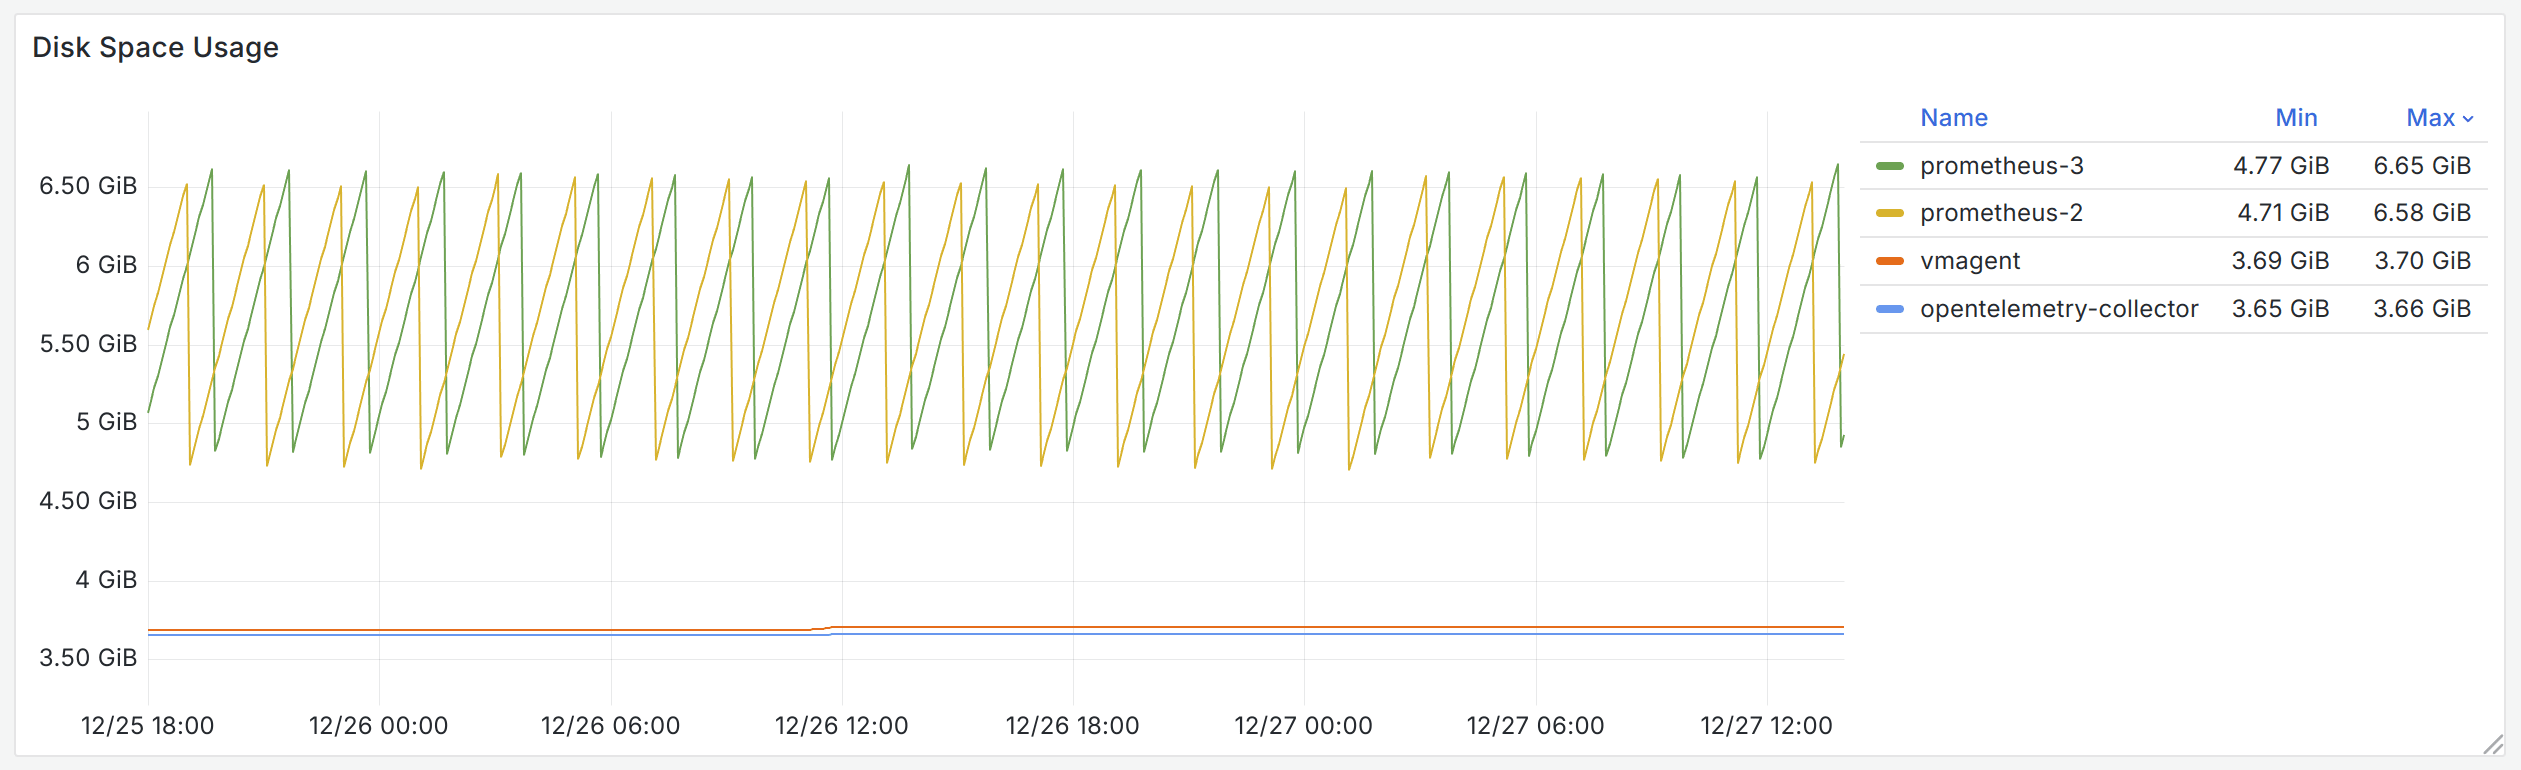 Result #1 disk
Disk usage on the instance includes space taken up by the OS and persistent data generated by benchmark objects. Fluctuations in disk usage indicate usage by benchmark objects.
In terms of disk usage, since the benchmark does not simulate the case when remote storage is unavailable, both the OpenTelemetry Collector and vmagent barely use any additional storage space. Prometheus, however, because WAL is enabled (even in Agent Mode), has to write the write-ahead log and purge it every two hours, which leads to the jagged pattern in the disk usage graph above.
After our initial analysis, we have identified some issues worth further discussion:
The config of the OpenTelemetry Collector is very simple:
service:
  pipelines:
    metrics:
      receivers: [prometheus]
      processors: [batch]
      exporters: [otlp]
Therefore, the CPU overhead issue is either with the Prometheus receiver or the OTLP exporter.
By adding extensions: [pprof], we collected the profile sample of the OpenTelemetry Collector. The profiling result told us that the OpenTelemetry Collector spends more time on the scrape operation, thus it can be reasonably assumed that the overhead is caused by the Prometheus receiver.
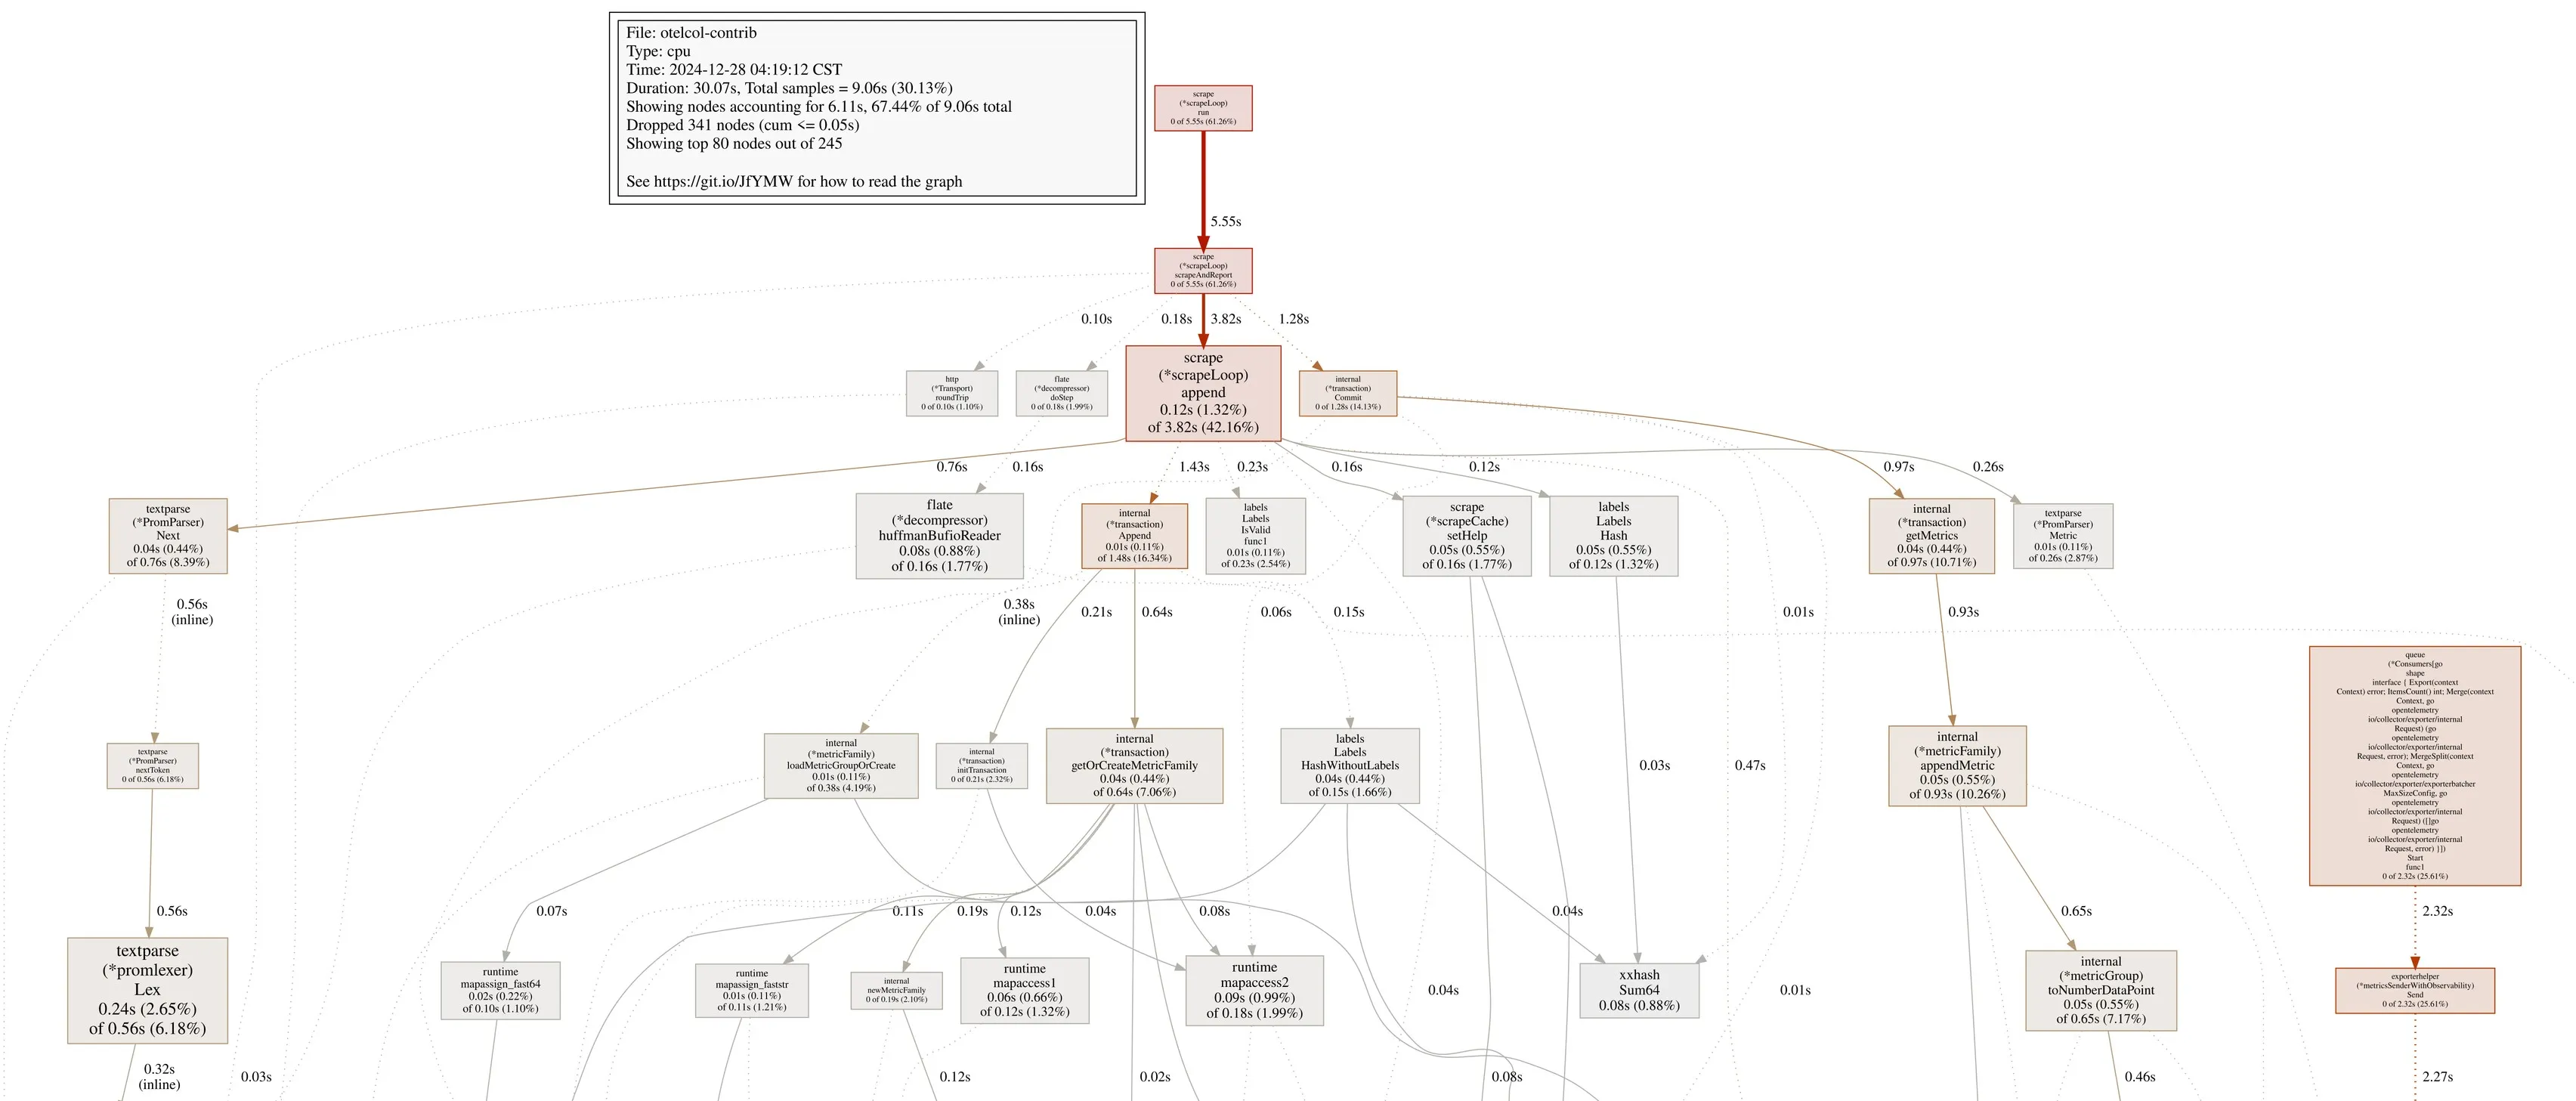 Profiling Opentelemetry Collector
Considering that scraping metrics in the Prometheus text format is not the primary function of the OpenTelemetry (Collector), these performance flaws seem reasonable. Optimizing it could be an interesting process, but that is not the focus of this post.
But what if various infrastructure components (such as Node Exporter) could provide OTLP support? Would the OpenTelemetry Collector take advantage of it?
We then redesigned the data collection process of the OpenTelemetry Collector and examined its resource usage when collecting data in the push mode. The new architecture is as follows:
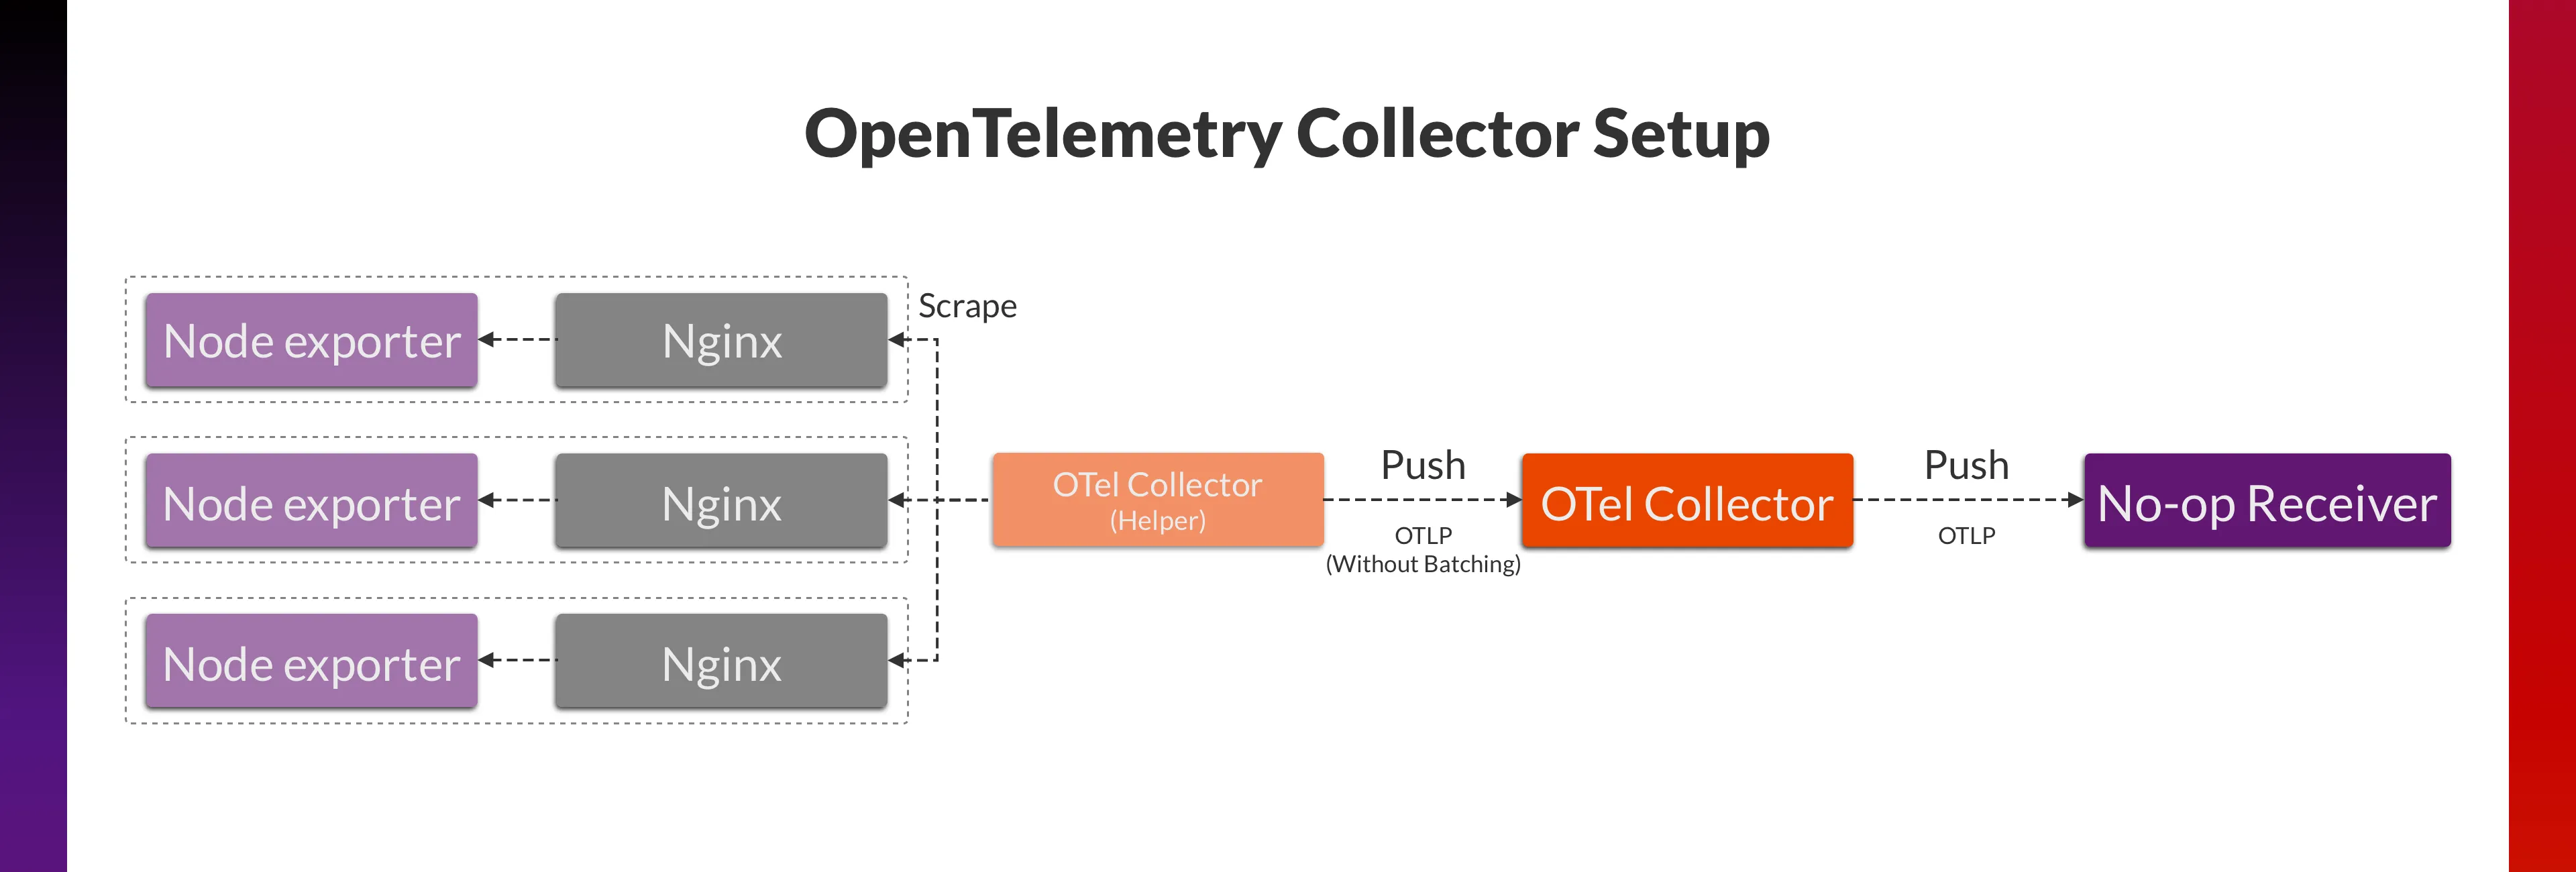 Opentelemetry Collector setup
OpenTelemetry Collector helper still uses Prometheus receiver to scrape Node exporter metrics. Data is then exported by OTLP exporter to the OpenTelemetry Collector at 40 req/s without batching.
 Benchmarking OpenTelemetry Collector
By comparison, we found that in using this pattern, the OpenTelemetry Collector’s CPU usage has dropped by 1.56x and its memory usage decreased by 3.23x.
Surprised by the extremely low bandwidth usage of the customized version of remote write 1.0 of vmagent, we tried to integrate zstd with remote write 2.0 as well. With some simple changes in Prometheus 3.x source code, we observed the following results:
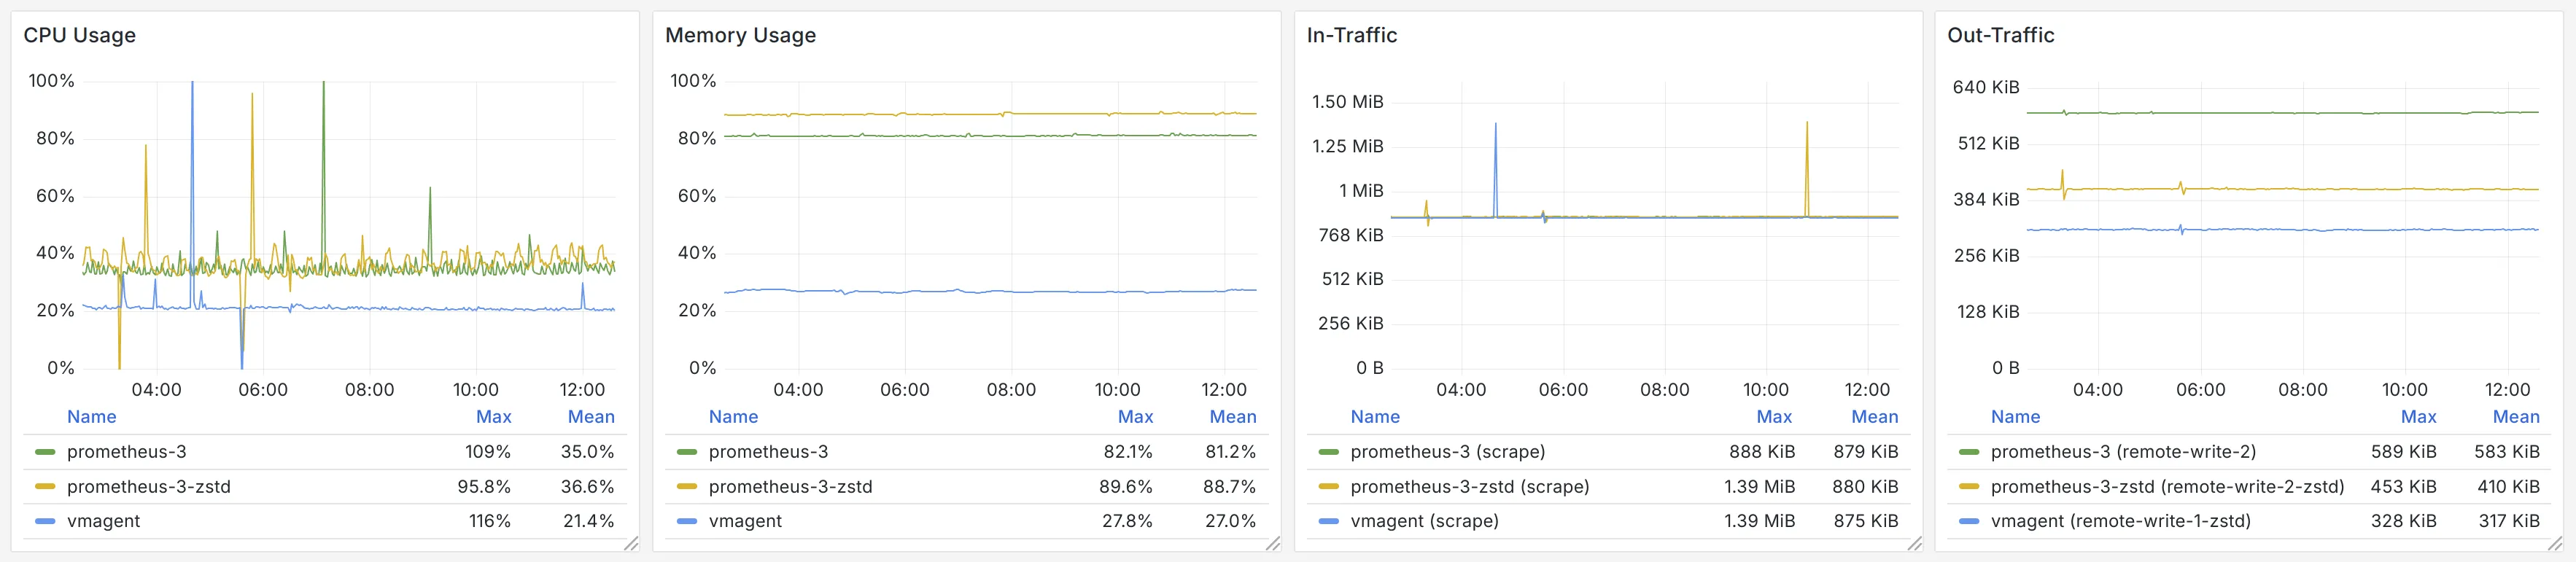 Prometheus 3.x with zstd
With the help of zstd, the bandwidth usage of remote write 2.0 is reduced by 30%. We thought the change of the compression algorithm would affect the CPU usage. However, with the same workload, the CPU usage only increased by 4%, which is insignificant. It is reasonable to believe that zstd provides significant value for users who are concerned about bandwidth usage, distribute infrastructure across multiple cloud providers, and need to transfer data across availability zones.
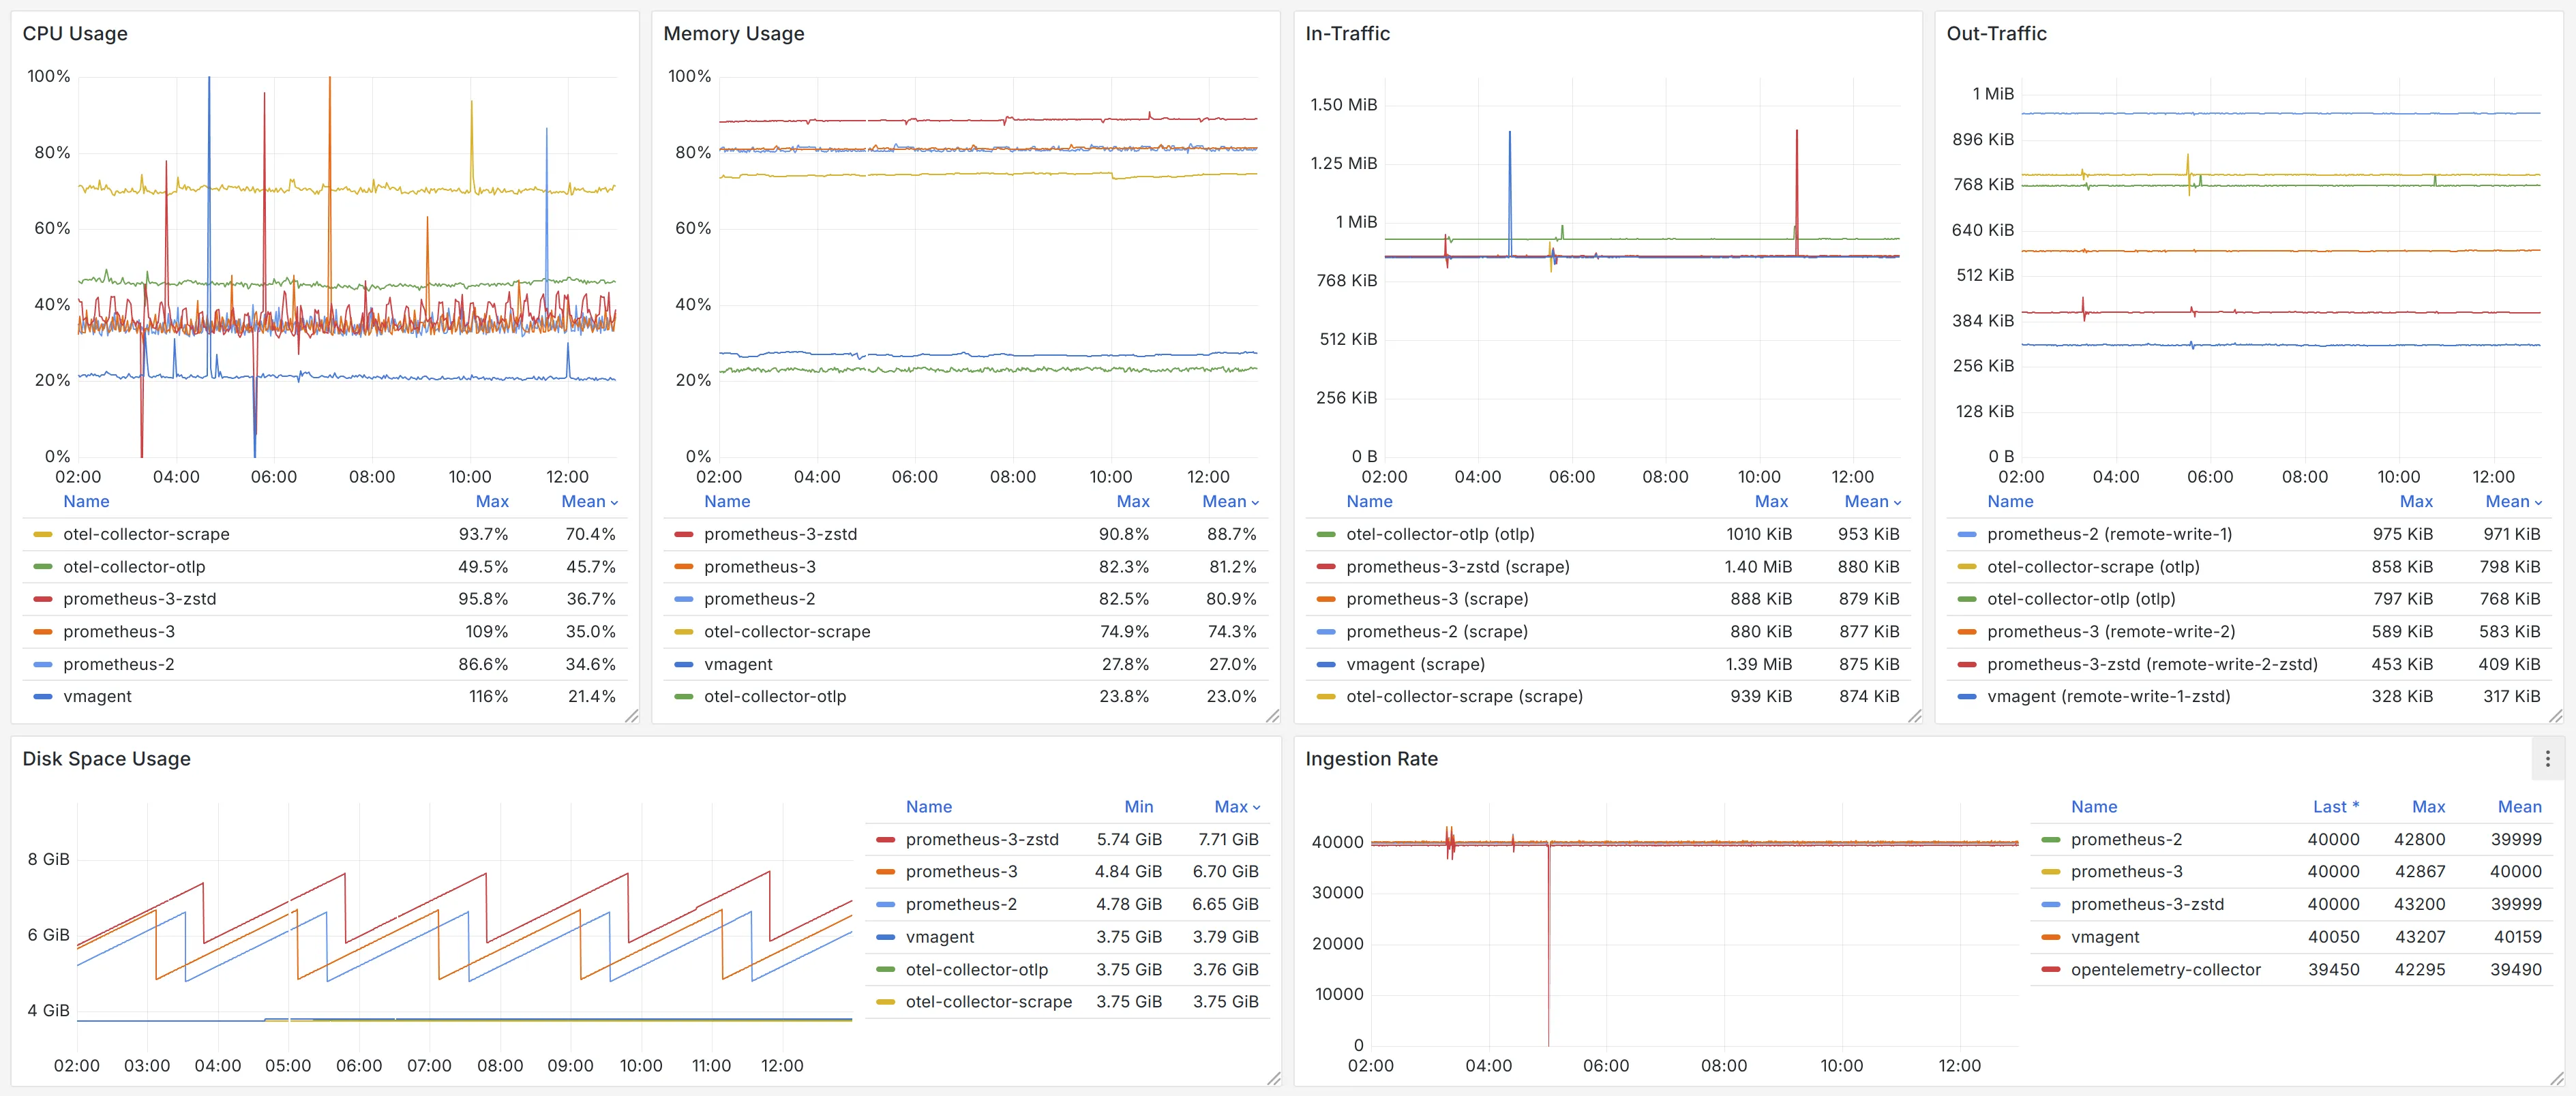 Benchmark result
The benchmark result is also available on snapshots.raintank.io.
The initial question we want to discuss is: why should we consider OpenTelemetry when Prometheus’s data model and remote write protocol are already supported by many vendors and projects?
The conclusion is that, before most exporters (especially those who generate large amount of time series, like Istio and kube-state-metrics) can provide support for OTLP, integrating OpenTelemetry comes with extra costs.
In the Prometheus ecosystem, the new remote-write protocol in Prometheus 3.x reduces bandwidth usage by 40%. Enabling the zstd compression option can boost this figure to 60%. On the other hand, since Prometheus 2.x will also receive performance patches, the difference in resource usage between the two major versions seems rather indistinguishable.
And vmagent, as a special competitor to OpenTelemetry Collector and Prometheus 3.x in this benchmark , can scrape the metrics data in Prometheus text format with extremely low resource overhead, utilizing 3.2x/1.6x less CPU and 2.7x/3.0x less memory. Meanwhile, with the combination of remote write 1.0 and the zstd compression, it can also minimize bandwidth usage, saving 46% of network bandwidth compared with remote write 2.0, making it an excellent cost-effective choice for users.
With OpenTelemetry and Prometheus continuously rolling out new standards, the new protocols will show advantages if more exporters could add support for fully utilizing them. But for now, it seems that users still have reasons to stick to the existing standards. After all, migrations and upgrades come with not only benefits but also unignorable costs.
此内容由惯性聚合(RSS阅读器)自动聚合整理,仅供阅读参考。 原文来自 — 版权归原作者所有。