



This piece is part of our ongoing VictoriaMetrics series where we break down how different components of the system do their thing:
We already know how vmstorage handles data ingestion from vminsert in the previous article, turning them into what we call “raw-row shards” in memory. However, they’re not searchable yet.
If you’ve forgotten the details, there’s no need to reread the article — here’s the summary:
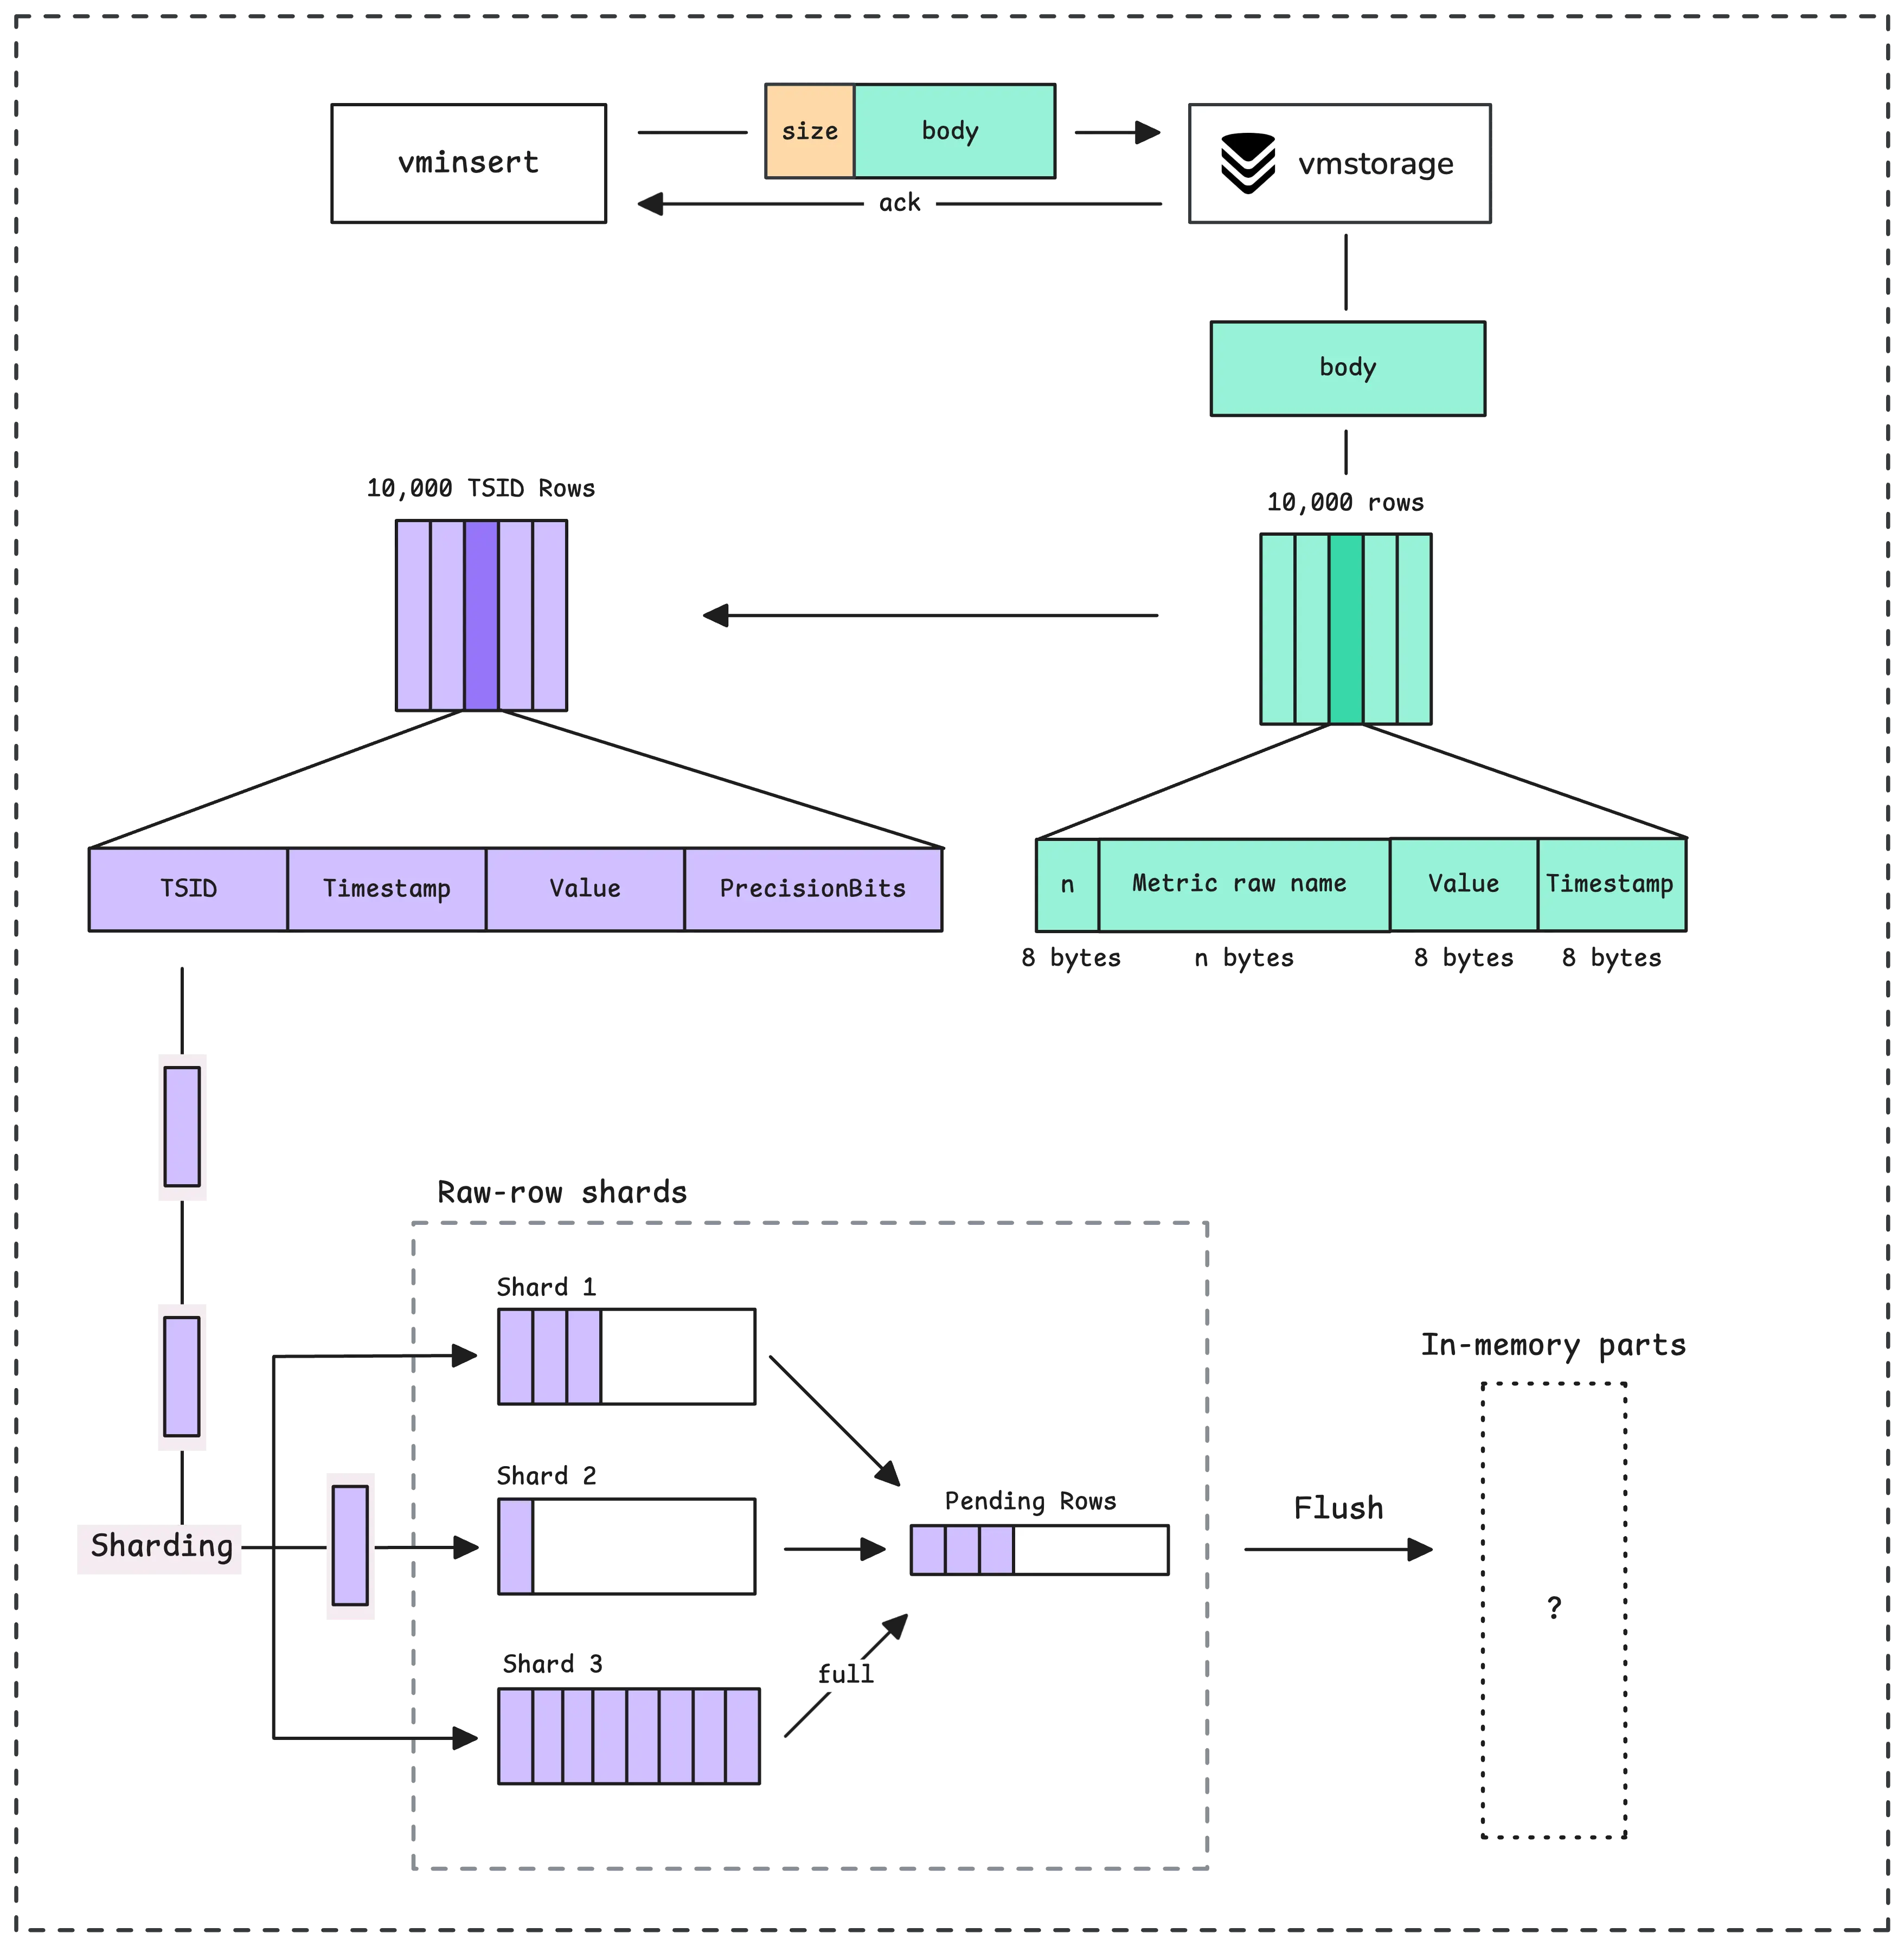
To be queryable, vmstorage flushes the raw-row shards data into what’s called “LSM parts”, starting with in-memory parts.
There are 2 situations that trigger the flushing process:
How many rows currently waiting to be flushed to an LSM part: vm_pending_rows{type="storage"}
When the flush happens, vmstorage goes through all the raw-row shards and collects those TSID rows into a buffer. This buffer will be sorted by TSID and timestamp, grouped into blocks and those blocks are separated by TSID:
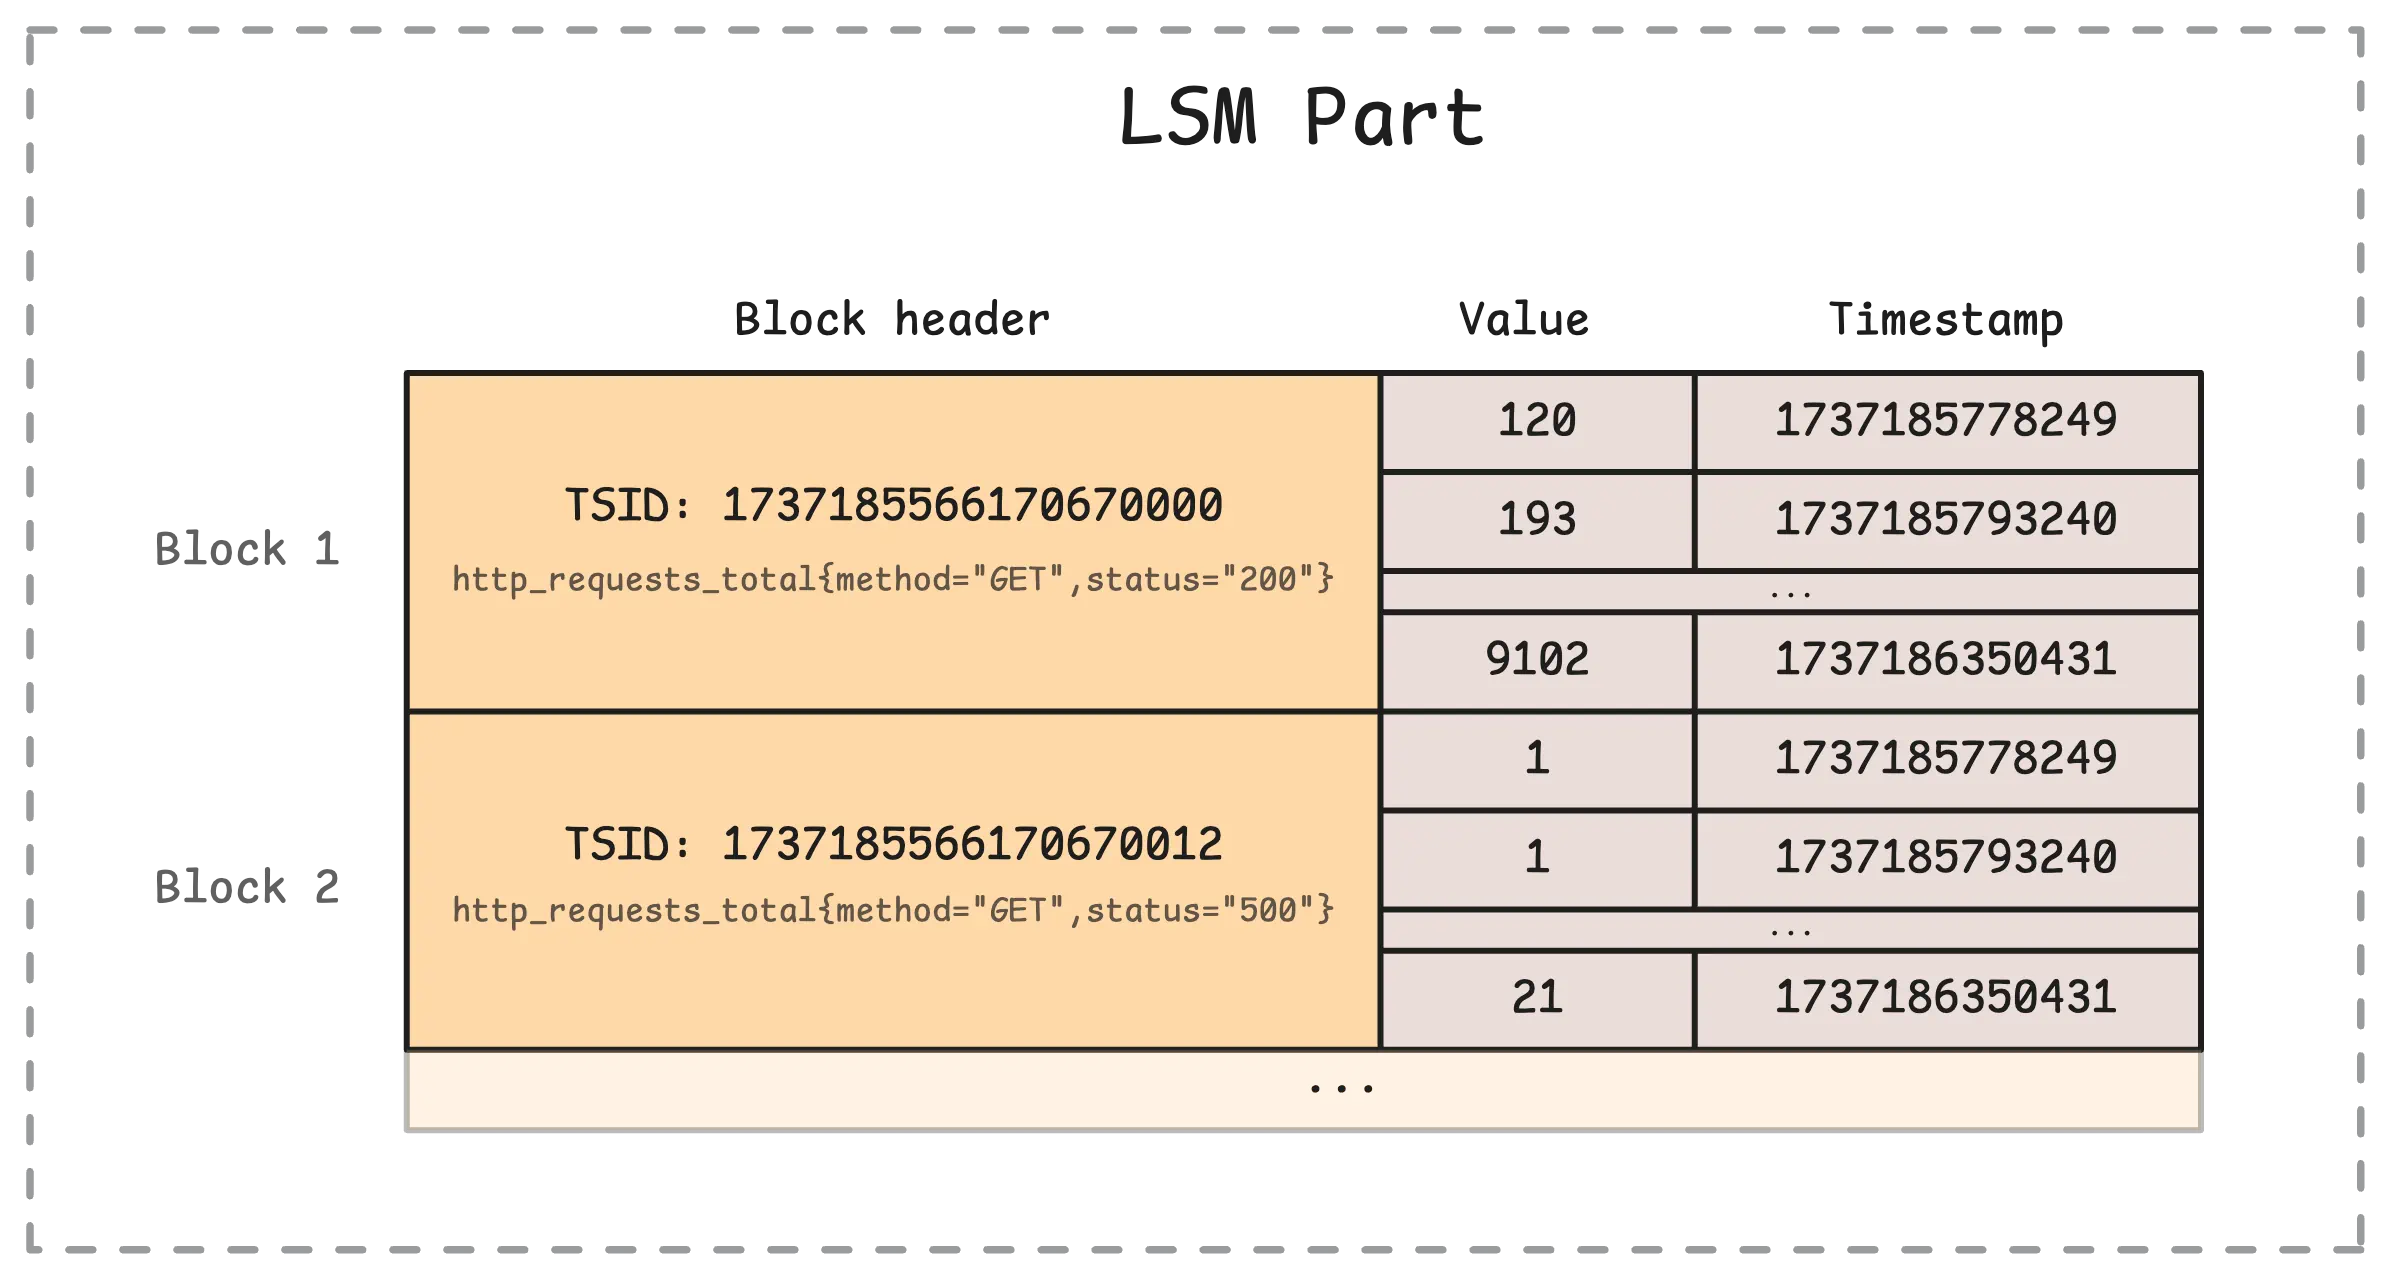
That means the same metrics (e.g. http_requests_total{method="GET",status="200"}) with different timestamps and values go into the same block in a part. Each block can hold up to 8,192 rows, if it’s larger than that, it will be split into multiple blocks even with the same TSID.
Each partition, which covers one month of data, organizes its data into 3 types of LSM parts:
{-storageDataPath}/data/small folder).{-storageDataPath}/data/big folder).vmstorage can handle up to 60 in-memory parts at a time. Together, they use about 10% of your system’s memory. For instance, if your vmstorage memory is 10 GB, the in-memory parts will take roughly 1 GB. Each part ranges between 1 MB (minimum) to 17 MB (maximum).
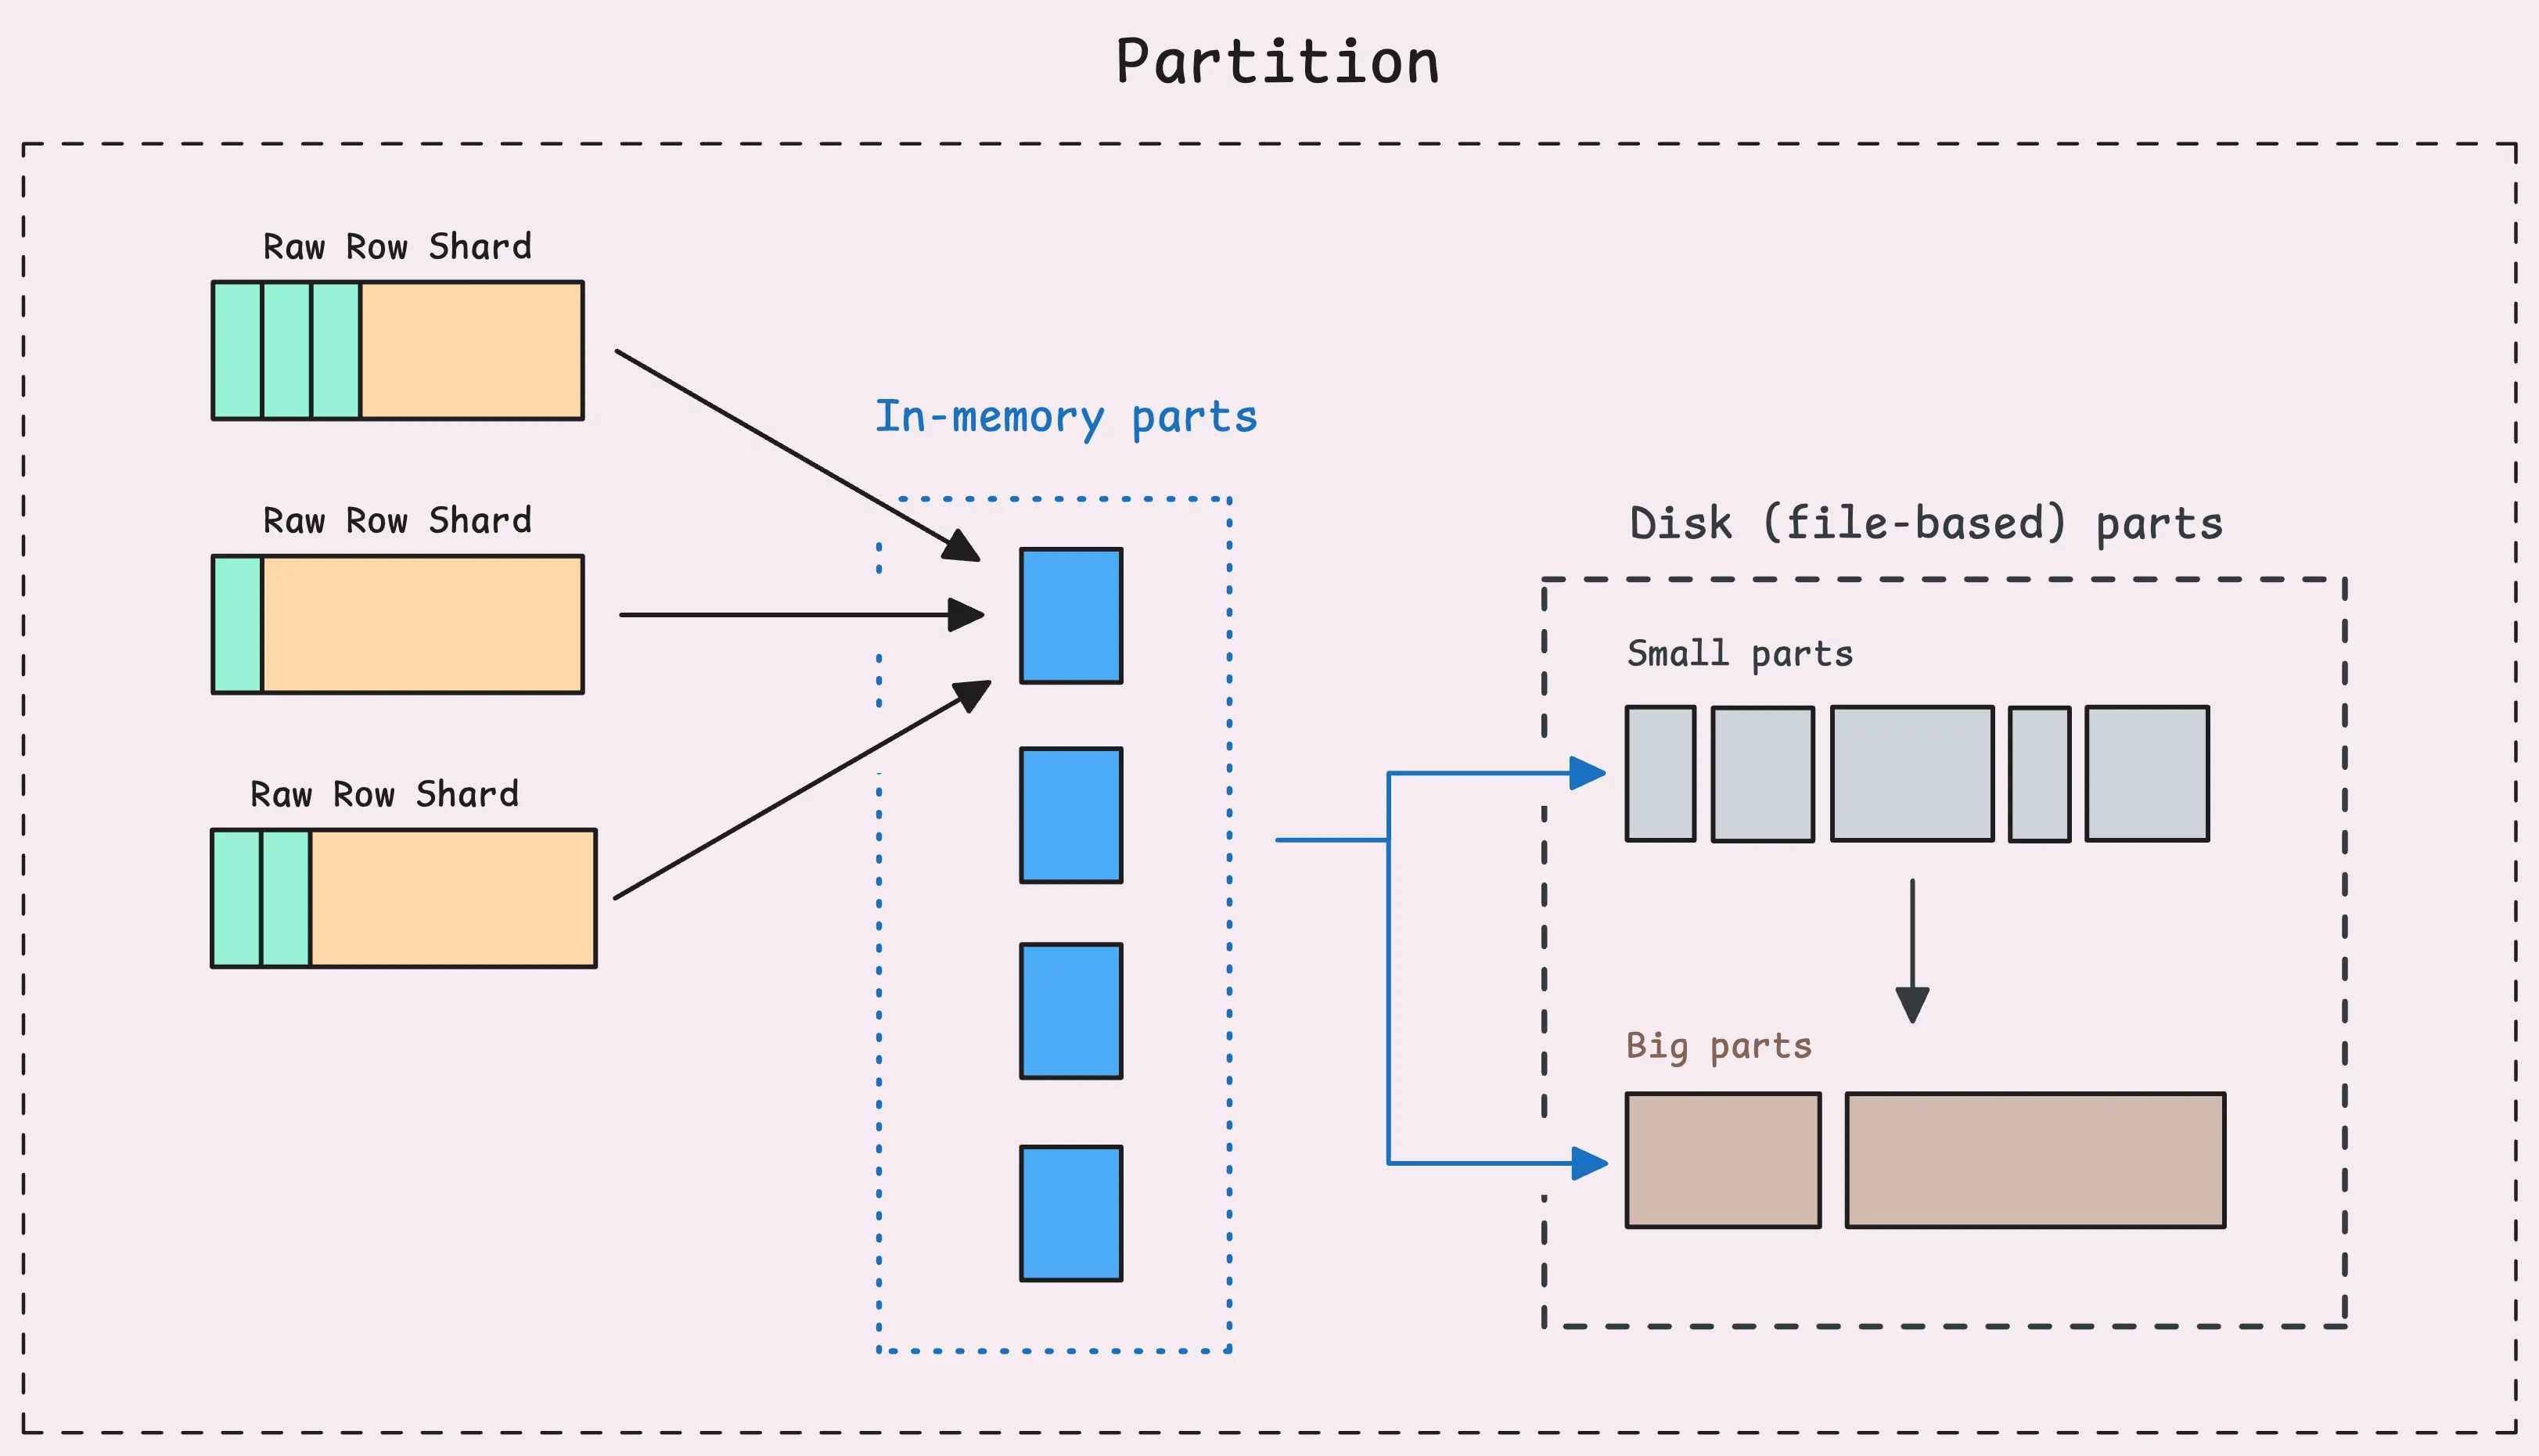
As more data is ingested, more and more parts are created, some parts may only contain a few rows or a few blocks.
When there are too many LSM parts - whether in-memory or on disk, every query needs to scan and merge data from all of them to return results. This could slow the system down over time.
To prevent that, vmstorage relies on two processes: flushing and merging.
Every 5 seconds (-inmemoryDataFlushInterval), vmstorage flushes its in-memory parts to disk-based parts.
During this process, it merges these parts, flushes them, and ensures that recently ingested data isn’t lost, even if vmstorage crashes — whether due to an OOM error, a SIGKILL, or something else. That said, there’s always a small window of time when data could be lost before the flush occurs.
Unlike flushing, merging doesn’t run on a fixed schedule. Instead, it works on a “cause and effect” basis.
For example, when in-memory parts get flushed to small parts on disk, the number of small parts grows. When this happens, vmstorage triggers a merge process for the small parts in that partition, looking for a chance to combine them into larger parts.
Basically, when any type of part starts piling up, the system steps in and merges just those parts.
“So small parts are bigger than in-memory parts, and big parts are bigger than small parts?”
It’s tempting to think of it like that because of the names, but it’s not entirely true.
Small parts might be larger than in-memory parts, or they might not. Similarly, small parts could be smaller than big parts, or not. It all depends on the timing of the merge and the available resources like memory and disk space at that moment. This means that 2 identical sets of parts merged at different times might result in different part types because the available resources were different at those times.
For example, if the system has less free memory during one merge compared to another, it might create a big part instead of a small part to avoid using the limited memory. But some rules do provide rough guidelines:
vm_blocks{type="storage/*"} (e.g. "storage/inmemory", "storage/small", "storage/big").vm_blocks{type="storage/*"}.vm_data_size_bytes{type="storage/*"}.vm_merges_total{type="storage/*"}.vm_active_merges{type="storage/*"}.But wait, how does vmstorage know which parts to merge? If it continuously merges all the parts, we end up with a single in-memory part, single small part and a single big part, right?
The algorithm is a little bit more complicated than the explanation below, but the idea is enough.
vmstorage maintains a list of parts of the same type in a partition, and decides which parts to merge based on something called “merge multiplier”, an indicator to evaluate if the merge is worth the effort.
Merge multiplier is the ratio between the total size of output parts and the size of the largest part being merged (total / largest part).
If the merged output is:
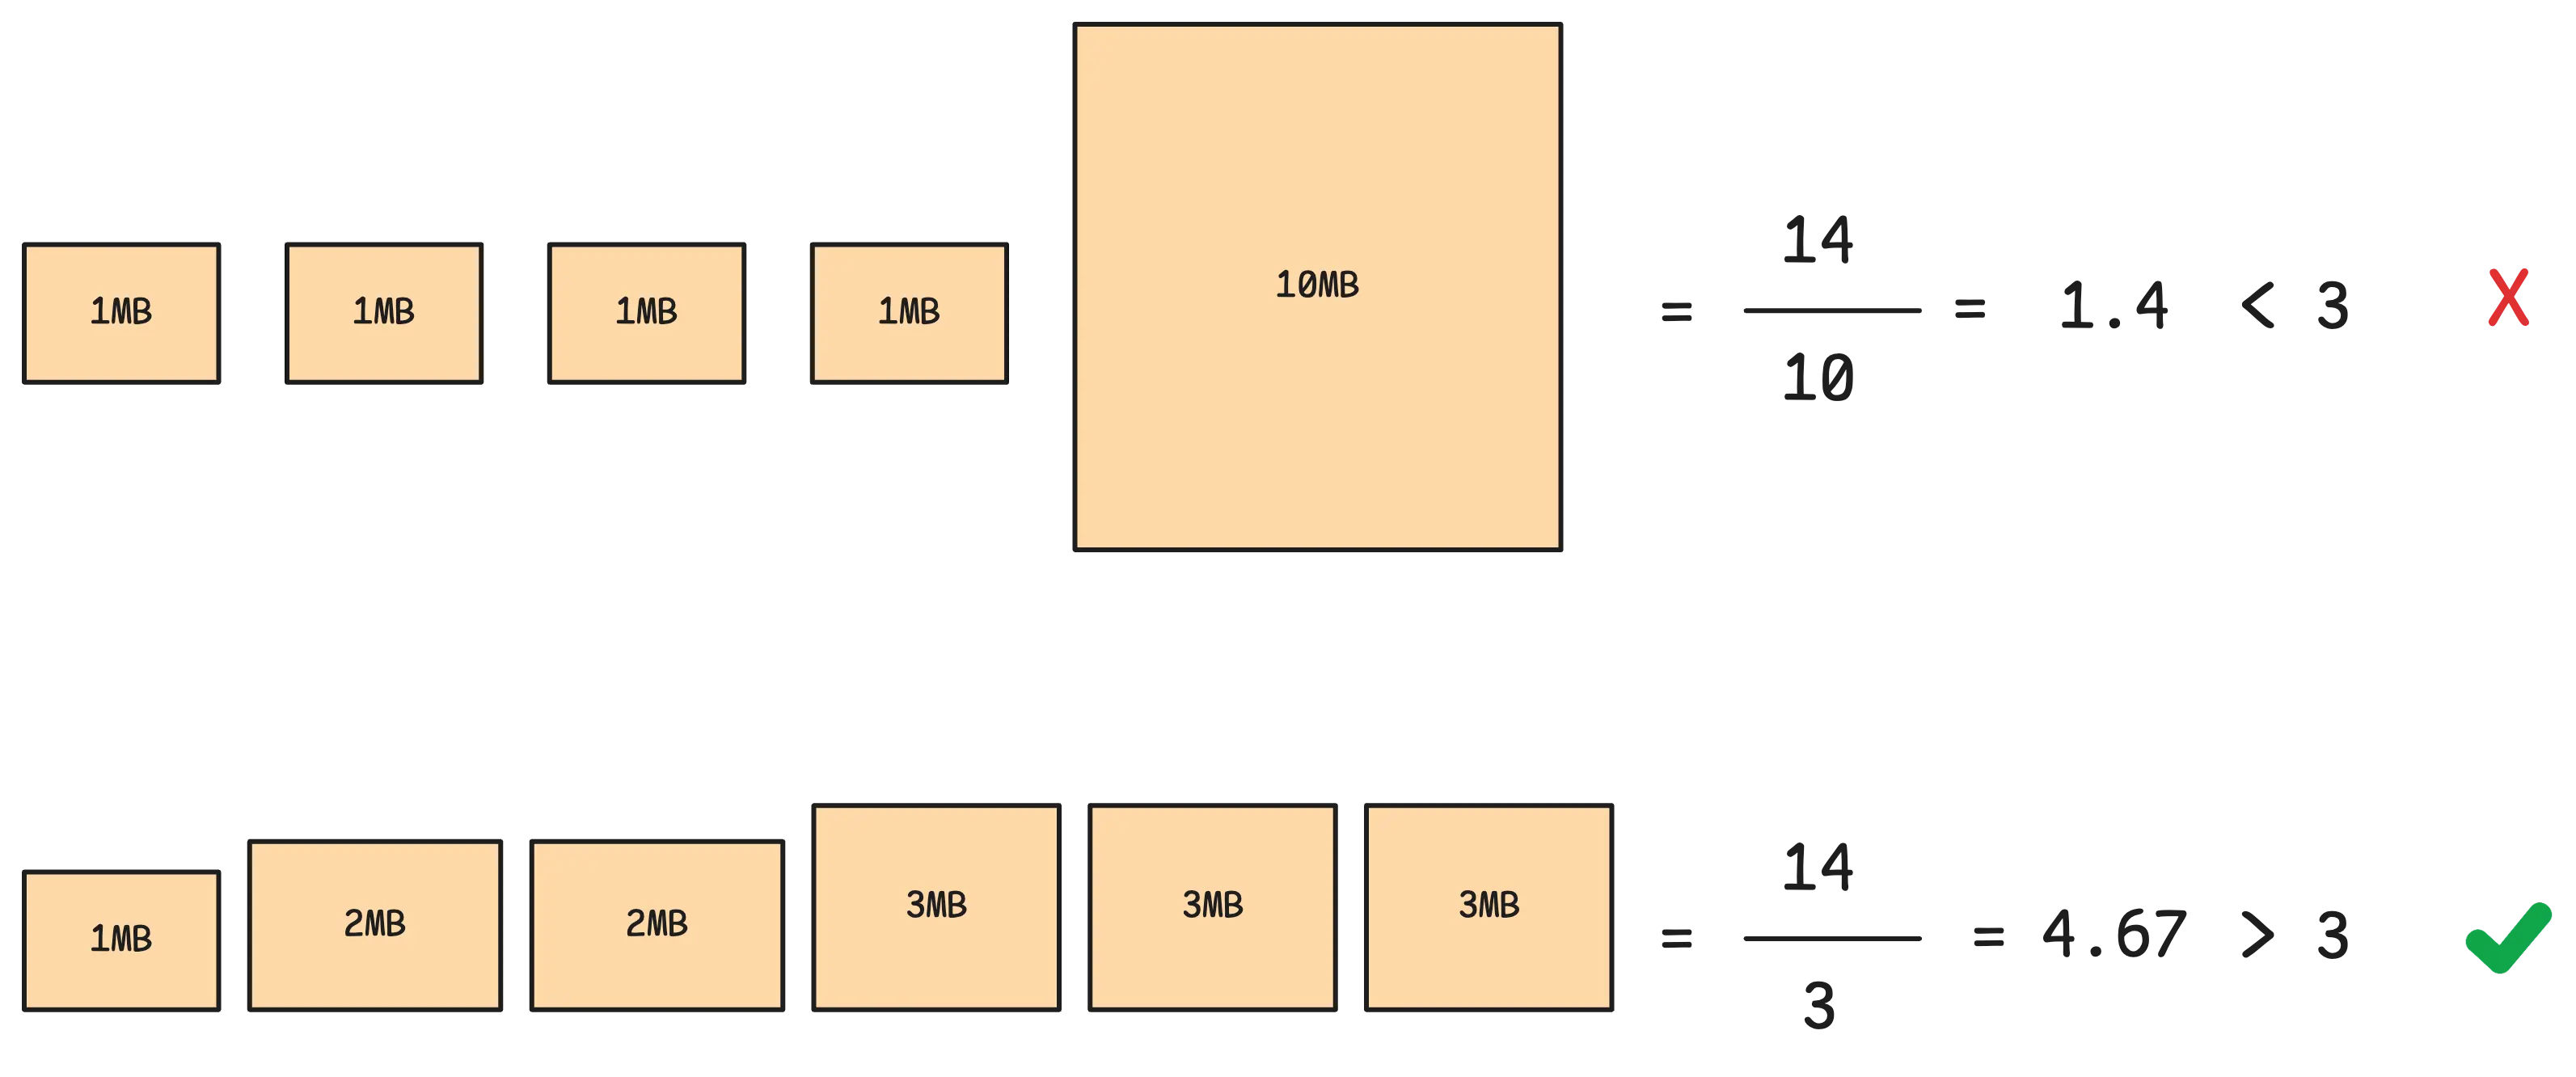
Assume the merge multiplier is 3, it means the merged output should be 3 times larger than the biggest input part. Most of the time, the merge multiplier of vmstorage is set to 7.5 with maximum 15 parts being merged at a time.
When merging happens, vmstorage also performs deduplication.
Deduplication is the process of identifying and removing data points that are almost identical but recorded at slightly different times.
This often occurs when two (or more) systems monitor the same metric for redundancy or reliability purposes and send their data to a shared storage. While the values and labels in the data are identical, their timestamps might vary by a few milliseconds or seconds.
Deduplication resolves this by retaining only one version of each duplicate data point:
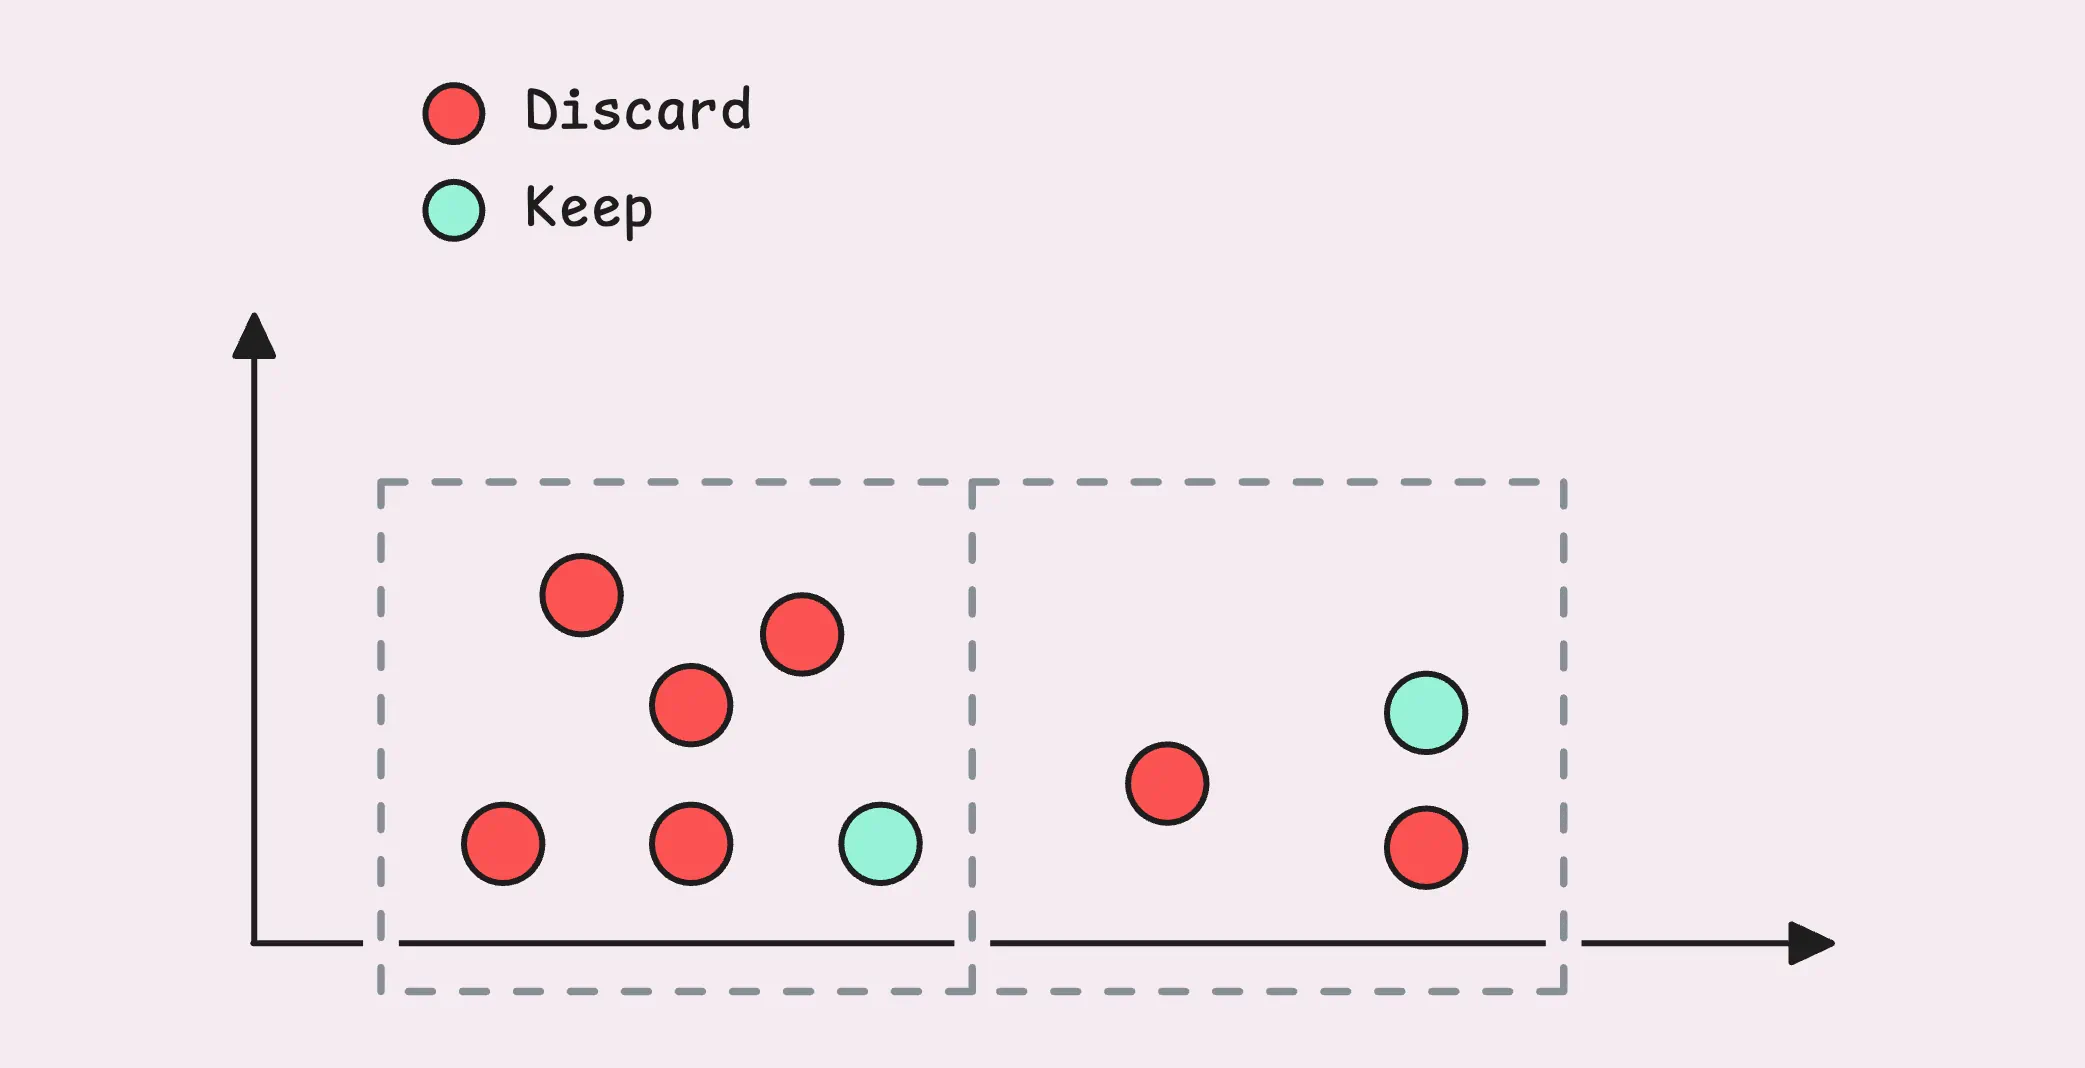
This visual isn’t an exact match for how VictoriaMetrics handles deduplication, but it gives you a good sense of the idea.
By default, deduplication is turned off. To enable it, you need to configure the deduplication window using -dedup.minScrapeInterval. When configured correctly, deduplication can significantly reduce disk usage while improving query speed and efficiency.
How many samples that were deduplicated during the merge process: vm_deduplicated_samples_total.
Interestingly, deduplication can sometimes function like downsampling, as both processes reduce the amount of data stored over a given time period.
If you’re doing something like real-time updates (e.g. candle of trading systems), where multiple samples have the same timestamp but the value is updated through time, it’s better to exclude this timeseries from deduplication as it will always choose the highest value.
“What happens if I change the deduplication window?”
Each part has a header that tracks the deduplication window at the time it was merged. VictoriaMetrics uses a dedicated worker called the “Deduplication Watcher” to keep an eye on all partitions and parts. Every hour (with a bit of randomness added), it checks whether the deduplication window you’ve set is larger than the one recorded in the part header. If it is, the system applies the updated deduplication settings for those parts.
Behind the scenes, it triggers a merge for all the parts in the target partition. This merge process applies the new deduplication settings.
It’s worth noting that data in the current partition (for the current month) won’t be retroactively deduplicated by this change. But any new data coming in will immediately follow the new deduplication window
We don’t want to keep all the metrics forever, right? That’s a pretty common need, and VictoriaMetrics makes it simple with a retention policy.
This lets you decide how long to keep data on disk using the -retentionPeriod setting. By default, it’s set to 1 month (you can go as low as 1 day or as high as 100 years, though). Any samples sent from vminsert that fall outside the retention period are dropped right away. There’s also a retention watcher running every minute to clear out old parts and partitions.
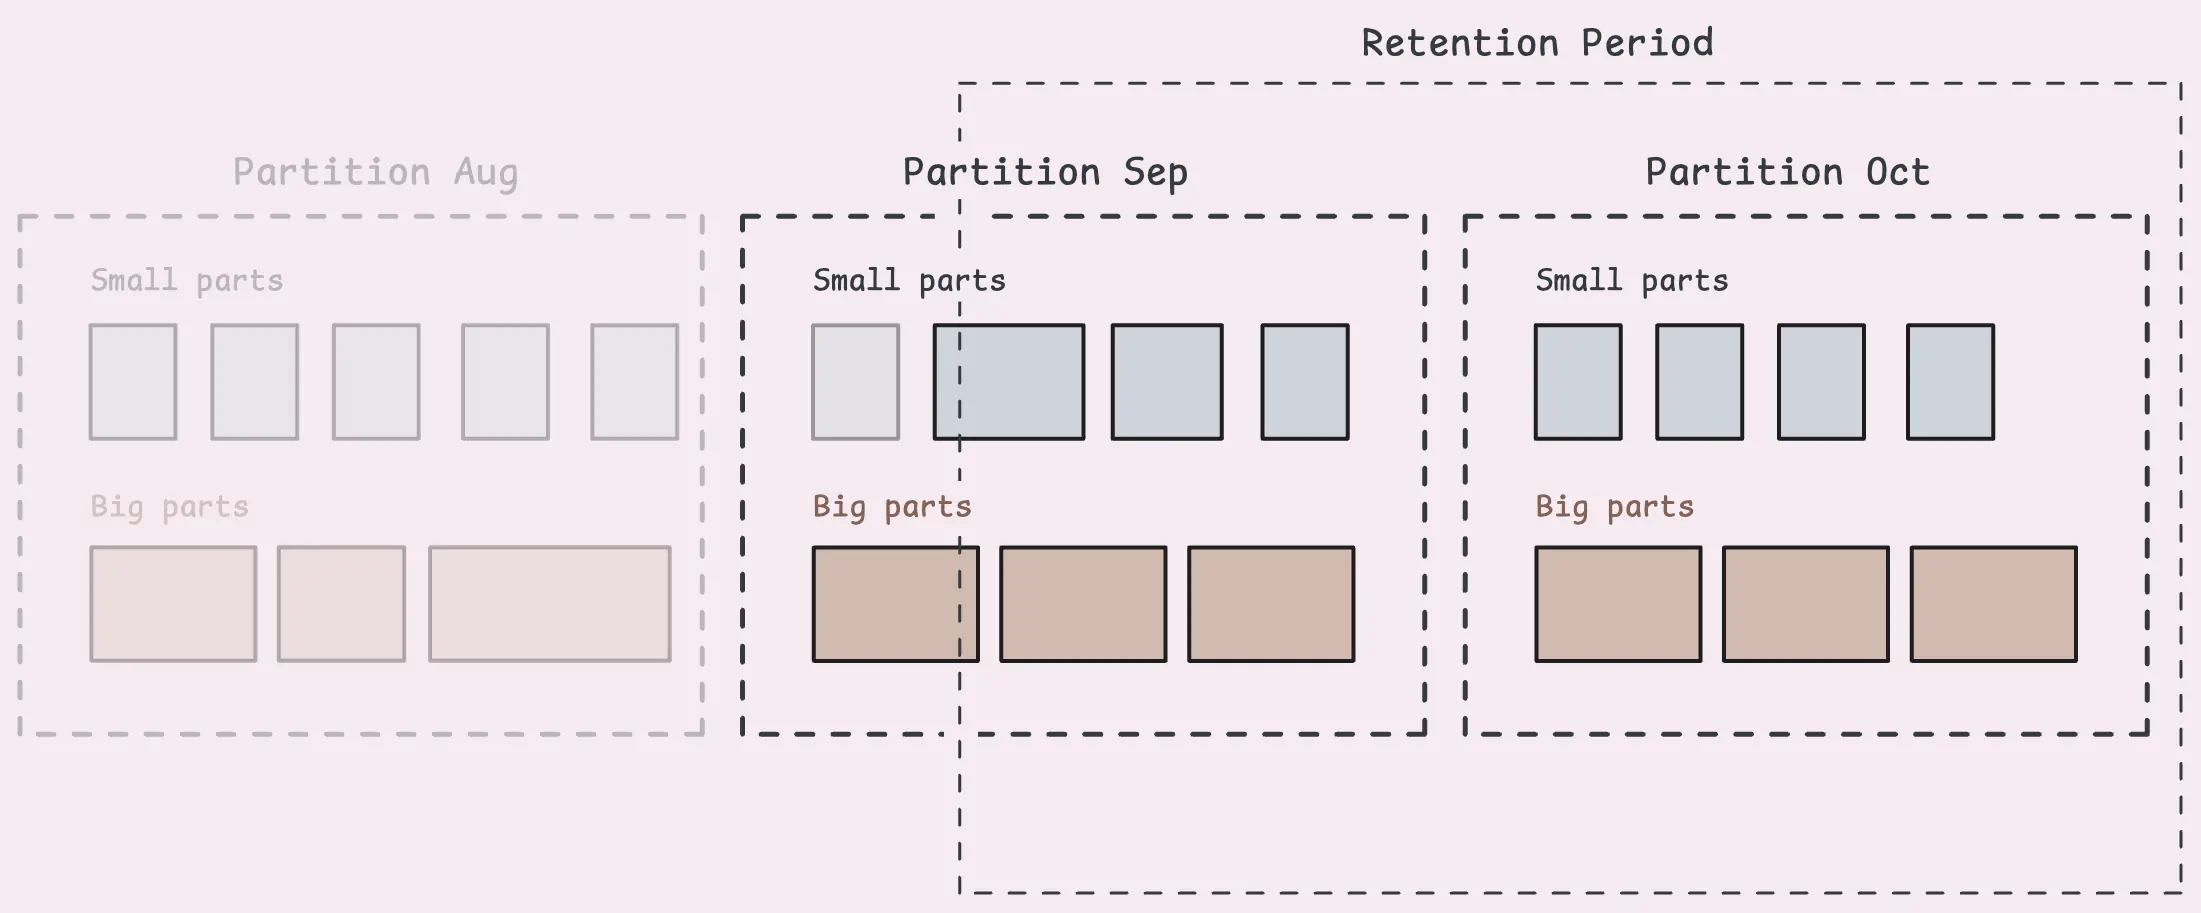
That said, keep in mind that each part contains many samples, and if even one sample in a part falls within the retention period, that whole part will stick around. So, some old data might hang around longer than expected until the entire part is outside the retention window.
If you’re on the Enterprise plan, you get more flexibility with retention filters. These let you define retention periods for specific types of data based on criteria like labels.
-retentionFilter='{team="juniors"}:3d' -retentionFilter='{env=~"dev|staging"}:30d' -retentionPeriod=1y
For example:
team="juniors" could have a 3-day retention.env=~"dev|staging" could have a 30-day retention.This gives you a lot of control over how long specific slices of your data stick around.
And then there’s downsampling, which is a lifesaver for managing high volumes of older data. Older data doesn’t get queried as often as recent data, so storing every single sample forever isn’t practical. Downsampling reduces the number of samples stored by keeping just one sample per time interval for older data.
-downsampling.period=30d:5m
In this example:
You can combine these rules for multi-level downsampling, applying different levels of granularity as data ages. On top of that, you can even set up downsampling for specific time series using filters, just like retention filters:
-downsampling.period='{__name__=~"(node|process)_.*"}:30d:1m'
This snippet tells VictoriaMetrics to downsample data points older than 30 days to one-minute intervals, but only for time series with names that start with the node_ or process_ prefixes.
Earlier, we touched on how vmstorage can enter a read-only mode when disk space runs low and stop accepting new timeseries arrivals from vminsert.
This safeguard is managed by a worker called the “free disk space watcher”. Its job is to keep an eye on available disk space and automatically switch vmstorage to read-only mode if things get too tight.
What counts as low disk space?
By default, the threshold is set to 10 MB (-storage.minFreeDiskSpaceBytes). The watcher checks the disk space every second at the storage path.
If the available disk space drops below this threshold, vmstorage switches to read-only mode with a warning message. In this state, it continues serving read queries - like searching for metrics or selecting data, but it stops accepting new data writes. Any data sent from vminsert will still receive an acknowledgment but won’t be stored.
Whether vmstorage is in read-only mode: vm_storage_is_read_only{}
Once enough disk space is freed up (above the threshold), the watcher automatically switches vmstorage back to read-write mode. When this happens, it signals all the relevant components to resume normal operations, and new data writes start flowing in again.
This section goes a bit deeper into the technical details. Think of it as a bonus for anyone curious about how the system works under the hood.
Our data are organized into blocks. Each block contains many rows (up to 8,192 rows) of the same TSID. Let’s remind ourselves with the diagram below:
Within a partition, you’ll find in-memory parts, small parts, and big parts. All of them are stored the same way: in a columnar format.
That means we don’t store a block in a single record. Instead, the value, the timestamp, and the TSID are split into different files.
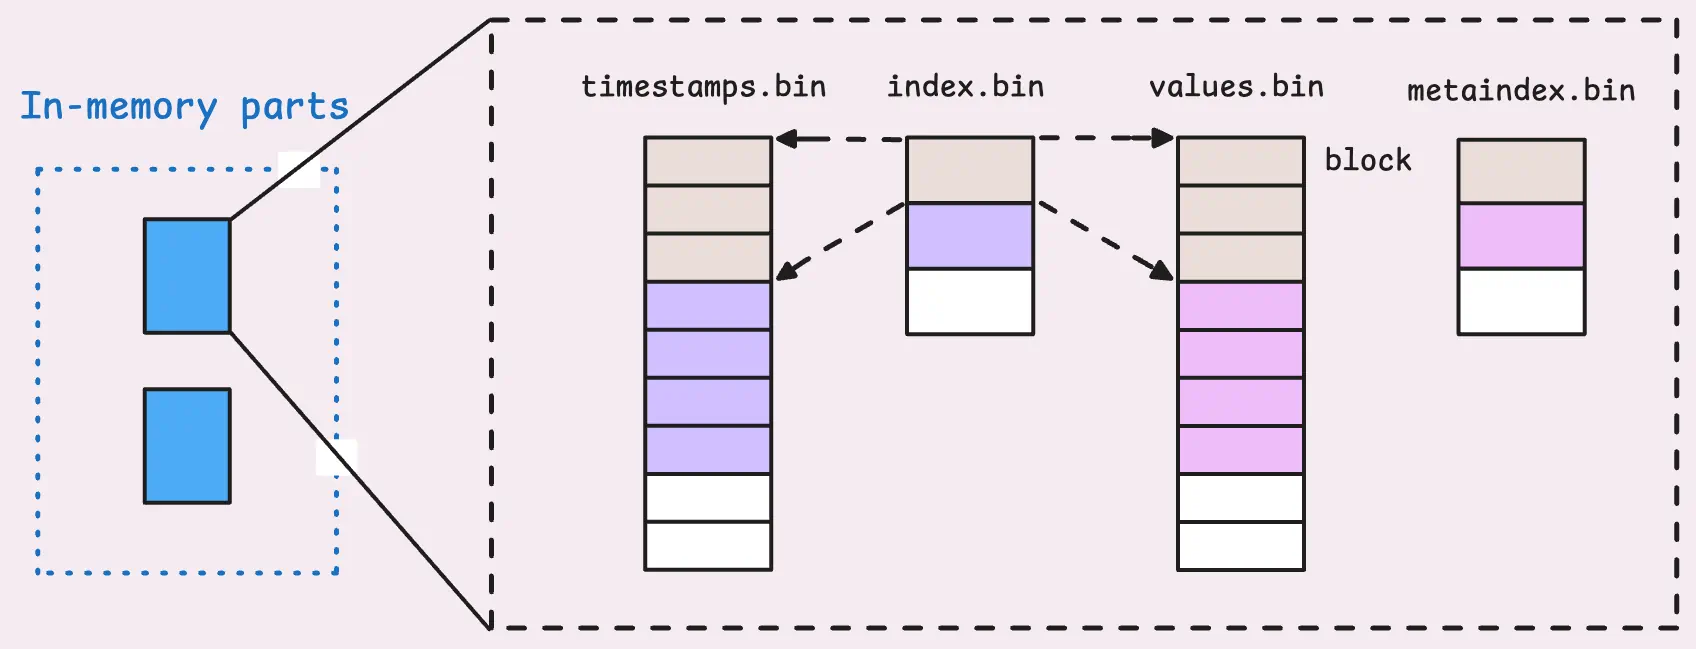
This columnar solution enables better compression and faster lookups since each type of data can be handled in a way that suits its characteristics.
Specifically, each cell of values.bin and timestamps.bin represents data for one block, and each block contains many rows of the same TSID. But how do we know the boundary of each block in those files?
It turns out each block has a header that describes the block, including the TSID of the block, how many rows are in the block, and the boundary of the block in values.bin and timestamps.bin. These headers are stored in index.bin. One row in index.bin corresponds to many blocks.
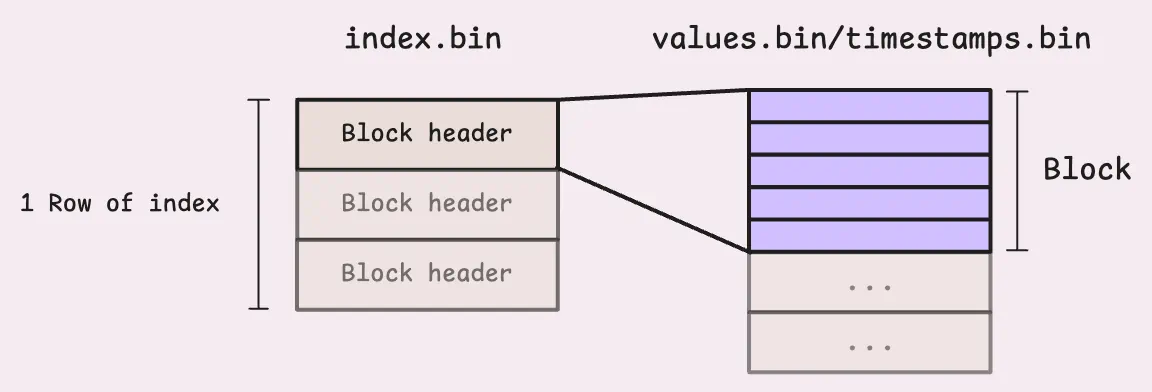
But again, how do we know the boundary of each row (array of blocks) in index.bin? This is where metaindex.bin comes in. It contains information about how many blocks are in each row of index.bin, the offset of each row in index.bin, and the TSID of the first block in each row. When vmstorage opens a part, it only loads the metaindex.bin into memory and then uses it to find the correct metrics it needs.
Here’s an example of how a big part looks in a directory, with file sizes included for context:
total 641M
-rw-r--r--    1 root     root       12.4M Oct 21 15:11 index.bin
-rw-r--r--    1 root     root       29.7K Oct 21 15:11 metaindex.bin
-rw-r--r--    1 root     root       24.7M Oct 21 15:11 timestamps.bin
-rw-r--r--    1 root     root      604.0M Oct 21 15:11 values.bin
The sizes vary quite a bit, but there is a clear pattern. Each file serves a specific purpose and uses different compression strategies to optimize storage. The values.bin file is always the largest because it holds the raw metric values. Next in size is usually timestamps.bin, followed by index.bin. Finally, the file we load into memory is metaindex.bin, which is a significantly smaller.
The author’s writing style emphasizes clarity and simplicity. Instead of using complex, textbook-style definitions, we explain concepts in a way that’s easy to understand, even if it’s not always perfectly aligned with academic precision.
If you spot anything that’s outdated or have questions, don’t hesitate to reach out. You can drop me a DM on X(@func25).
If you want to monitor your services, track metrics, and see how everything performs, you might want to check out VictoriaMetrics. It’s a fast, open-source, and cost-saving way to keep an eye on your infrastructure.
此内容由惯性聚合(RSS阅读器)自动聚合整理,仅供阅读参考。 原文来自 — 版权归原作者所有。