
惯性聚合 高效追踪和阅读你感兴趣的博客、新闻、科技资讯
阅读原文 在惯性聚合中打开

推荐订阅源

Martin Fowler
Martin Fowler
L
Lohrmann on Cybersecurity
罗磊的独立博客
V
V2EX
人人都是产品经理
人人都是产品经理
腾讯CDC
让小产品的独立变现更简单 - ezindie.com
aimingoo的专栏
aimingoo的专栏
D
Docker
云风的 BLOG
云风的 BLOG
B
Blog
OSCHINA 社区最新新闻
OSCHINA 社区最新新闻
Microsoft Azure Blog
C
Check Point Blog
IT之家
IT之家
S
Secure Thoughts
S
Security @ Cisco Blogs
博客园 - 聂微东
阮一峰的网络日志
阮一峰的网络日志
G
Google Developers Blog
www.infosecurity-magazine.com
TaoSecurity Blog
TaoSecurity Blog
博客园_首页
雷峰网
雷峰网
博客园 - 三生石上(FineUI控件)
奇客Solidot–传递最新科技情报
奇客Solidot–传递最新科技情报
H
Heimdal Security Blog
Last Week in AI
Last Week in AI
Engineering at Meta
Engineering at Meta
D
DataBreaches.Net
J
Java Code Geeks
PCI Perspectives
PCI Perspectives
GbyAI
GbyAI
Help Net Security
Help Net Security
W
WeLiveSecurity
CTFtime.org: upcoming CTF events
S
Schneier on Security
H
Hackread – Cybersecurity News, Data Breaches, AI and More
F
Full Disclosure
A
About on SuperTechFans
K
KPMG report finds enterprise disconnect between AI and its ROI | CIO
Recorded Future
Recorded Future
C
CXSECURITY Database RSS Feed - CXSecurity.com
NISL@THU
NISL@THU
Hacker News: Ask HN
Hacker News: Ask HN
The Cloudflare Blog
Latest news
Latest news
The Last Watchdog
The Last Watchdog
Attack and Defense Labs
T
The Blog of Author Tim Ferriss

VictoriaMetrics: Simple & Reliable Monitoring for Everyone on VictoriaMetrics

Operator now has Long-Term Support (LTS) version Multi-tiered Observability: A Practical Way to Handle Diverse Workloads VictoriaMetrics April 2026 Ecosystem Updates Not All Telemetry Requires Premium Pricing VictoriaMetrics at KubeCon Amsterdam: Community Highlights What's new in VictoriaMetrics Anomaly Detection (Q1 2026) What's New in VictoriaMetrics Cloud Q1 2026? Logs, MCP Server, Better Alerting, and... a Secret Project VictoriaMetrics at KubeCon: Optimizing Tail Sampling in OpenTelemetry with Retroactive Sampling VictoriaMetrics March 2026 Ecosystem Updates Observability Lessons From OpenAI Benchmarking Kubernetes Log Collectors: vlagent, Vector, Fluent Bit, OpenTelemetry Collector, and more VictoriaMetrics February 2026 Ecosystem Updates VictoriaMetrics at FOSDEM, Cloud Native Days France, and CfgMgmtCamp Ghent What’s new in VictoriaMetrics Anomaly Detection (2025) VictoriaMetrics January 2026 Ecosystem Updates VictoriaLogs Basics: What You Need to Know, with Examples & Visuals What's New in VictoriaMetrics Cloud Q4 2025? New tiers, more deployment options, IaC and alerting rules. Vibe coding tools observability with VictoriaMetrics Stack and OpenTelemetry How a US Software Provider Improved Traffic Alerting with VictoriaMetrics Anomaly Detection VictoriaMetrics 2025 Developer Experience: A Year in Review Spotify’s performance & control across large monitoring environments with VictoriaMetrics VictoriaMetrics Achieves Red Hat OpenShift Operator Certification Our latest updates across the VictoriaMetrics Observability ecosystem New Capacity Tiers in VictoriaMetrics Cloud Announcing 1B+ Downloads & Product Development With Logs, Traces, Metrics AI Agents Observability with OpenTelemetry and the VictoriaMetrics Stack Discarding gRPC-Go: The Story Behind OTLP/gRPC Support in VictoriaTraces What's New in VictoriaMetrics Cloud Q3 2025? From new region in Asia to proactive alerts How DreamHost Slashed Memory Usage by 80% and Scaled to 76 Million Time Series Upcoming Conferences & Meetups: Where to Meet Our Team VictoriaMetrics Long-Term Support (LTS): H2 2025 Update Creating a Sustainable Open Source Business Model - Introduction Full-Stack Observability with VictoriaMetrics in the OTel Demo Alerting Best Practices vmanomaly Deep Dive: Smarter Alerting with AI (Tech Talk Companion) VictoriaLogs Practical Ingestion Guide for Message, Time and Streams Monotonic and Wall Clock Time in the Go time package Hello Singapore! VictoriaMetrics Cloud Expands to Asia Pacific MCP Server Integration & Much More: What's New in VictoriaMetrics Cloud Q2 2025 FIPS 140-3 Compatible Builds for VictoriaMetrics Enterprise Components VictoriaLogs Unleashed: Cluster Version Now Available for Exceptional, Linear Scaling Integrations made easy with VictoriaMetrics Cloud Developer's Note: Research on Distributed Tracing, Comparing With Tempo and ClickHouse vmagent: Key Features Explained in Under 15 Minutes Go synctest: Solving Flaky Tests vmalert: Maximize Your Monitoring (Tech Talk Companion) Celebrating 14K Stars on GitHub: Spring Update vmalert: Maximize Your Monitoring VictoriaMetrics Connects with the Open Source Community at LinuxFest Northwest 2025 Graceful Shutdown in Go: Practical Patterns VictoriaLogs: Gaps, Gains & Growth Prometheus Monitoring: Functions, Subqueries, Operators, and Modifiers VictoriaMetrics Cloud: What's New in Q1 2025? Don’t default to microservices: You’ll thank us later! Container CPU Requests & Limits Explained with GOMAXPROCS Tuning gRPC in Go: Streaming RPCs, Interceptors, and Metadata From Chaos to Clarity with VictoriaLogs Prometheus Alerting 101: Rules, Recording Rules, and Alertmanager Heading to London: Meet Our Team at KubeCon Europe 2025 Inside vmselect: The Query Processing Engine of VictoriaMetrics Meet Our Team at Scale 22x Practical Protobuf - From Basic to Best Practices VictoriaLogs Status Update: Heading Towards the Cluster Version 24th of February 2025 Statement: VictoriaMetrics Stands with Ukraine! Prometheus Metrics Explained: Counters, Gauges, Histograms & Summaries Prometheus Monitoring: Instant Queries and Range Queries Explained 300%+ Growth in 2024: Join Our Team in 2025! FOSDEM 2025 recap How Protobuf Works—The Art of Data Encoding OpenTelemetry, Prometheus, and More: Which Is Better for Metrics Collection and Propagation? How vmstorage Handles Query Requests From vmselect How vmstorage's IndexDB Works VictoriaMetrics Tech Talk Stream: A Deep Dive into Blackbox Monitoring How HTTP/2 Works and How to Enable It in Go VictoriaMetrics Cloud: What's New in Q4 2024? How vmstorage Processes Data: Retention, Merging, Deduplication,... How vmstorage Handles Data Ingestion From vminsert When Metrics Meet vminsert: A Data-Delivery Story From net/rpc to gRPC in Go Applications VictoriaMetrics helps IHI Terrasun Win Big in Vegas on $1.2B Clean Energy Project Piros | VictoriaMetrics Partner Allenta | VictoriaMetrics Partner CloudRaft | VictoriaMetrics Partner Sensedia & VictoriaMetrics: API-compatible Efficient Storage Scalable Prometheus: Why DSV Chose VictoriaMetrics Sensor Factory | VictoriaMetrics Partner Erythix | VictoriaMetrics Partner Groove X & VictoriaMetrics: Faster Device Health Monitoring Scaled & Performant Monitoring at Spotify with VictoriaMetrics Grammarly & VictoriaMetrics: 10× Lower Costs & Direct Access Zelarsoft | VictoriaMetrics Partner DFKI & VictoriaMetrics: Efficient Long-Term Metric Storage Niubits | VictoriaMetrics Partner Megazone Cloud | VictoriaMetrics Partner Cogito Software | VictoriaMetrics Partner Bajau | VictoriaMetrics Partner Find Out Why Dig Security Chose VictoriaMetrics! Ness | VictoriaMetrics Partner Alpha Data | VictoriaMetrics Partner SIOS Technology | VictoriaMetrics Partner
VictoriaLogs in VictoriaMetrics Cloud: Fast, Cost-Effective Log Management is Here
Jose Gomez-Selles · 2026-02-10 · via VictoriaMetrics: Simple & Reliable Monitoring for Everyone on VictoriaMetrics

Yes, you got it right: VictoriaLogs is now Generally Available in VictoriaMetrics Cloud!

We believe that this is a huge milestone in our journey to deliver what our users are expecting from us: a complete, managed observability solution.

If you’ve been following our quarterly updates, you know we’ve been after this launch for a while. In our latest update a few weeks ago we already announced that we were ready and today we’re making it official.

You may have a lot of questions, and we believe the best way to answer them is to try it out by signing up for a one-month free trial without needing to add a credit card.

Alternatively, you may also contact us for more info or… Just keep reading!

What’s in the box?

#

Plain and simple: VictoriaLogs at a couple of clicks away. If you didn’t know it already, you’ll actually find that VictoriaLogs is built with the same philosophy that made VictoriaMetrics so popular: performance, cost efficiency and ease of use. In VictoriaMetrics Cloud, we like to go one step further and give you the option to deploy and use it within seconds in a fully managed environment, while we take care of upgrades, the infra, backups and all those boring duties so you can focus on what matters.
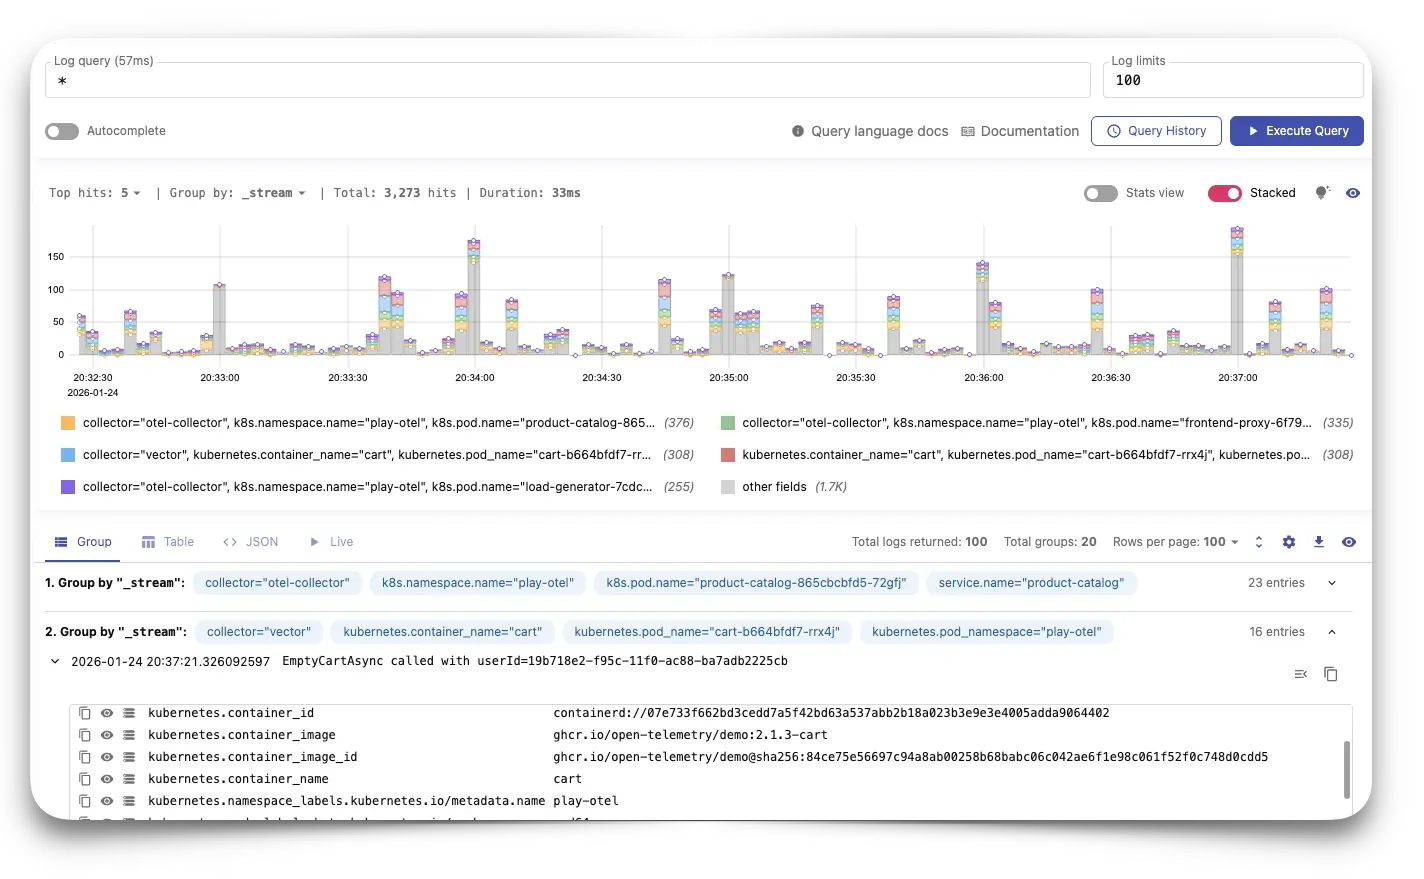
Exploring Logs

#

Once your VictoriaLogs deployment is up and running, exploring your logs is easy. In the Explore section you’ll find everything you need to understand your logs at a glance: visualize log distribution over time, group logs by streams, and spot noisy or weird fields instantly.

And the best part? The UI helps you every step of the way with autocomplete suggestions and query prettification, making complex queries easy to build and understand. Your query history is automatically saved, including favorites, so you can quickly return to the queries that matter most (or that one that clicked but you just can’t remember now).

At a glance

#

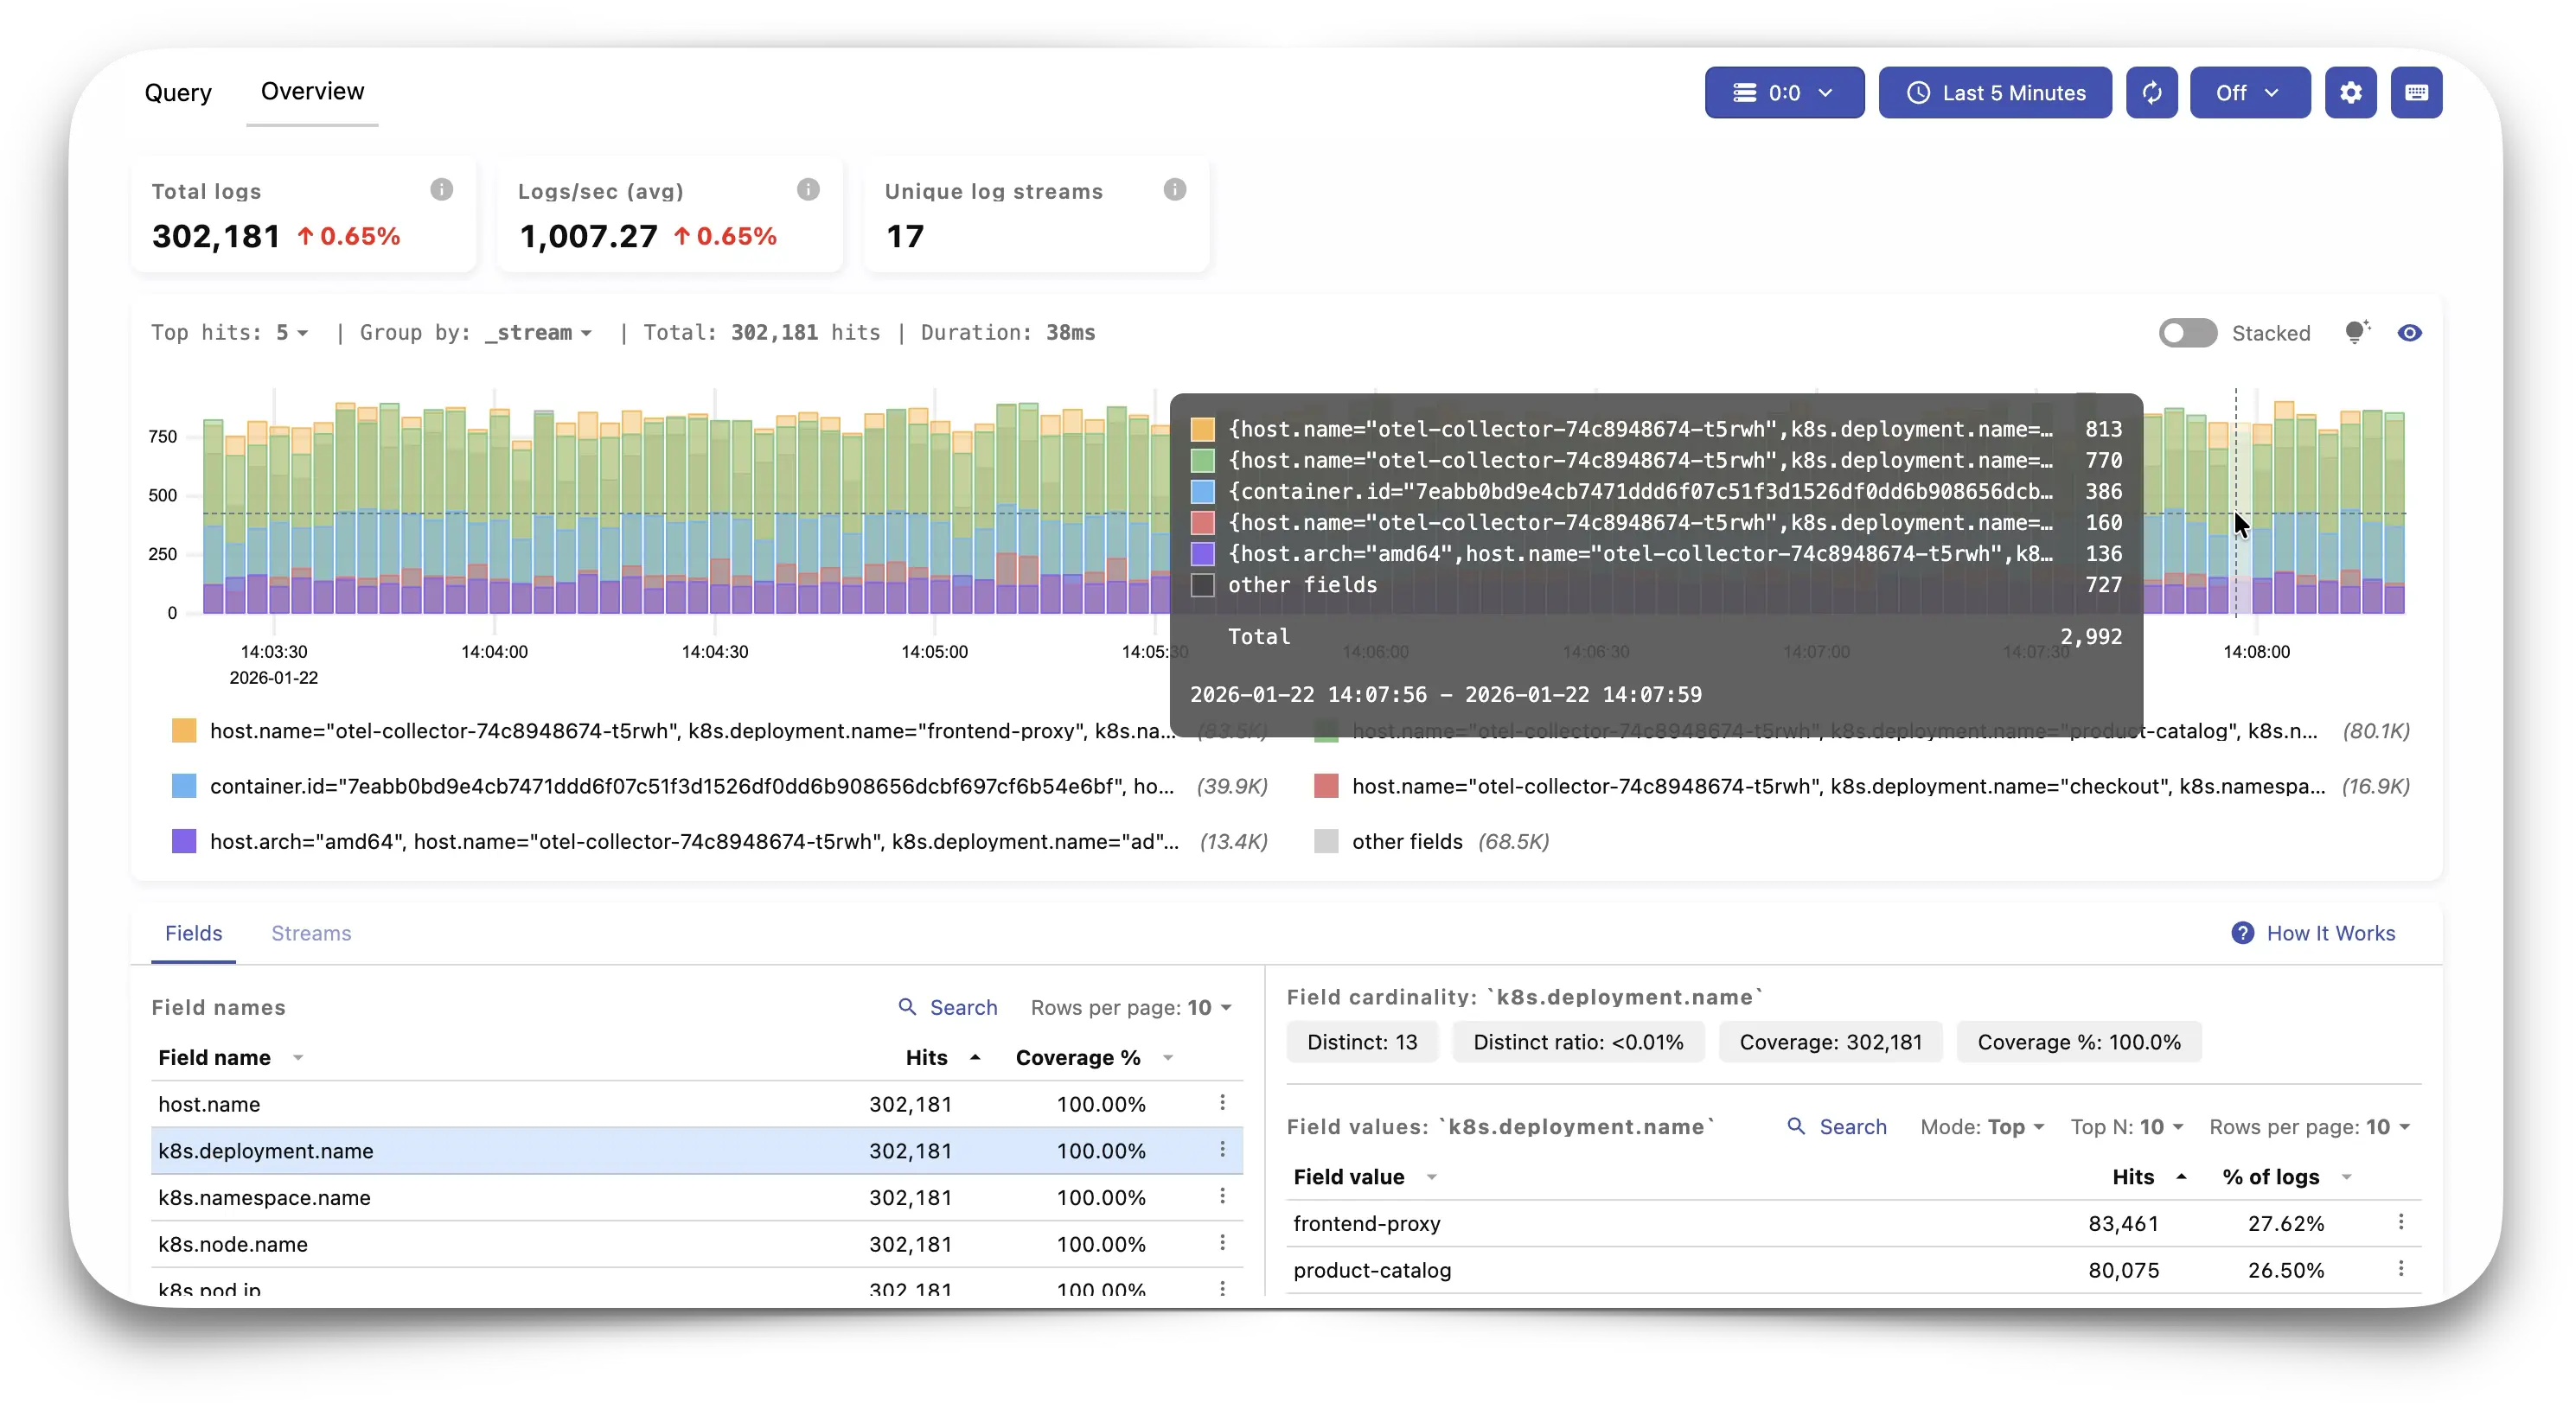
The Overview page provides a bird’s-eye view of your logging data, displaying statistics about total logs, rates, and cardinality. The Names and Values tables let you drill down into field names and their values, helping you identify patterns and outliers quickly. Clicking on any name or value automatically filters your view, making exploratory analysis feel natural and snappy.
LogsQL

#

Querying VictoriaLogs is powered by the LogsQL language, designed specifically for log analysis. With LogsQL, you can filter, transform, and aggregate your logs as you wish.

Check out the full documentation to discover all the available capabilities, including how to convert Loki queries to LogsQL or SQL to LogsQL. For hands-on learning, explore LogsQL examples and the LogsQL tutorial to unlock the full potential of your log data.

And it is this simple: retrieving the ordered set of k8s logs with errors in the last hour looks like this:

error kubernetes _time:1h | sort by (_time)

So… how do I get started?

#

Knock yourself in! Not to repeat myself about quick-starting, but the process can be summarized in 3 steps:

  1. After signing up, you can just go ahead and
  2. Deploy VictoriaLogs instances. After a few seconds, everything will be ready for you to
  3. Send data, in the same way as with VictoriaMetrics instances today.

But just in case, let’s explain these last two steps a bit more in detail.

Deploy

#

Go to the create page, (i.e. https://console.victoriametrics.cloud/deployments/create#logs), where you can select:
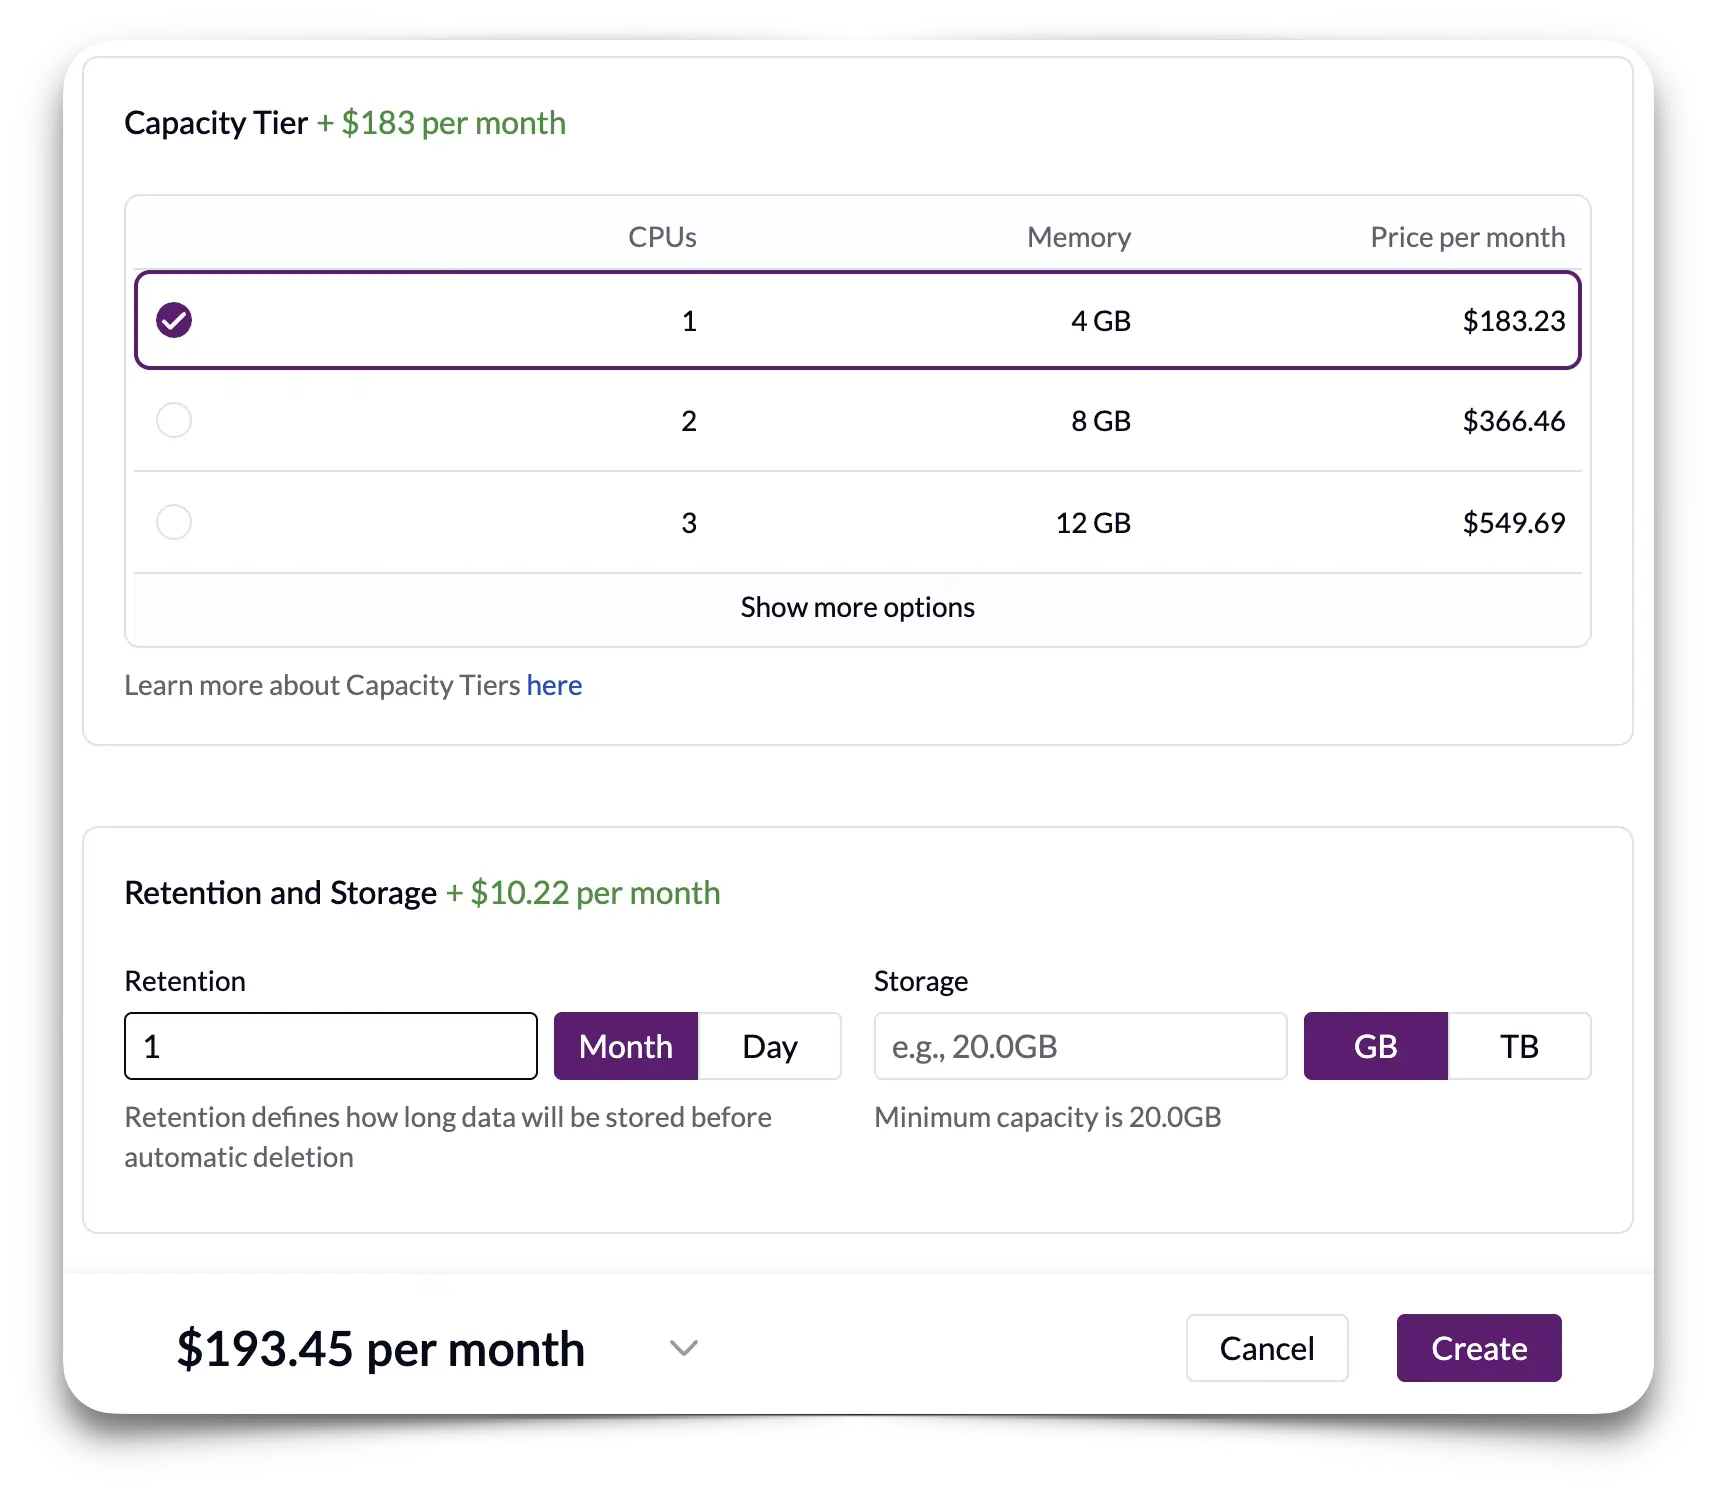
  • The Region where you want your instance to run
  • The Capacity Tier that will be deployed
  • The Retention and Storage to save your data

We have published some of our test results the documentation. You may also learn more about how to estimate the needed compute resources, including storage for your workloads in this FAQ.

Send

#

Now that we have the deployment ready, we need an Access Token to write data to our deployment. We recommend following the easy copy-paste integrations, which you may also find in the docs. But if you were seeking an example, an OpenTelemetry collector integration would just need you to add the bearertokenauth extension and plug it into your otlphttp exporter like this:

config:
  extensions:
    # We are using the token directly, but a filename may also be provided
    # This is used to authenticate with VictoriaMetrics Cloud, and
    # needs to be included in the otlp exporter (see below).
    bearertokenauth:
      scheme: "Bearer"
      token: <MY_TOKEN>
    # ...other extensions go here.

  exporters:
    # Here we define the VictoriaMetrics Cloud endpoint, with auth included.
    otlphttp/cloud:
      logs_endpoint: https://<MY_VMCLOUD_ENDPOINT>/insert/opentelemetry/v1/logs
      auth:
        authenticator: bearertokenauth
    # ...other exporters go here

  service:
    extensions: [bearertokenauth, health_check]
    pipelines:
      # Basic pipeline to collect metrics and send them to VictoriaMetrics Cloud.
      logs:
        receivers: [otlp]
        processors: []
        exporters: [otlphttp/cloud]
      # ...more pipelines go here.

Analyze

#

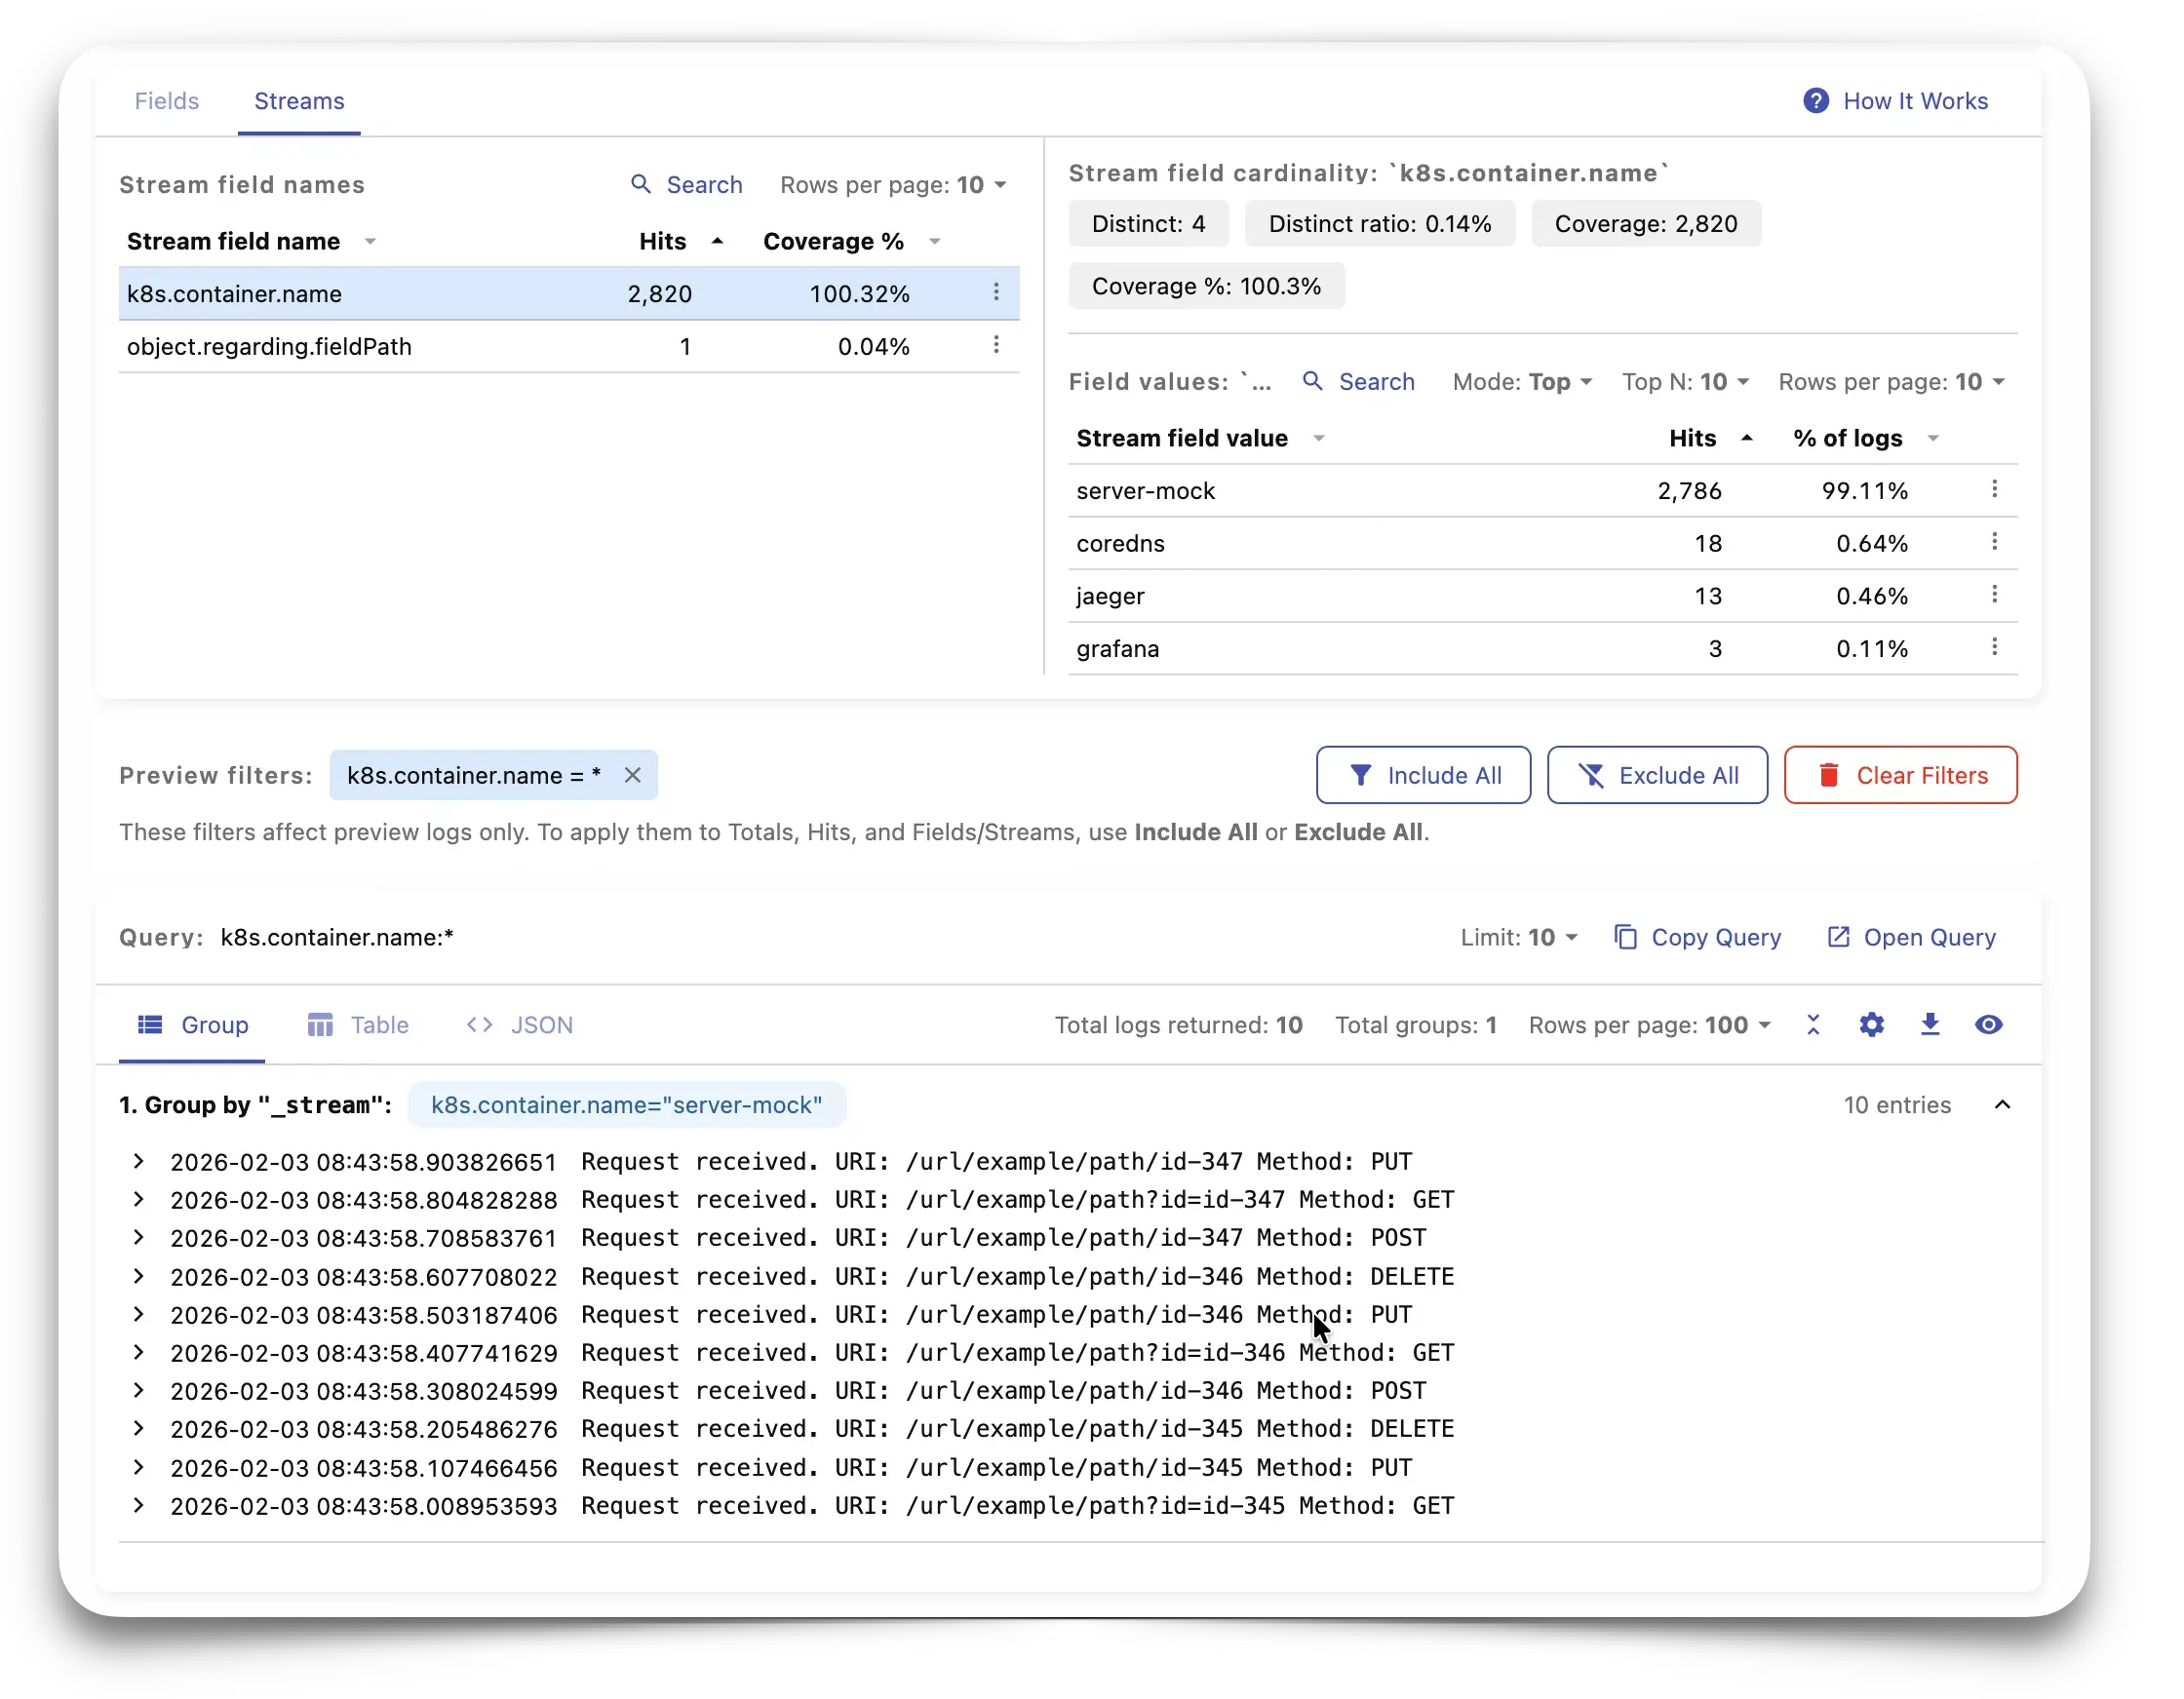
Now it’s time to go check what we’re sending. And for that I’ll be showing an example. I went a bit further, and added the following to my OpenTelemetry exporter config to group streams by containers:

  otlphttp/victorialogs:
    headers:
      VL-Msg-Field: object.note
      VL-Stream-Fields: object.regarding.fieldPath,k8s.container.name
    logs_endpoint: http://vl-svc:9428/insert/opentelemetry/v1/logs

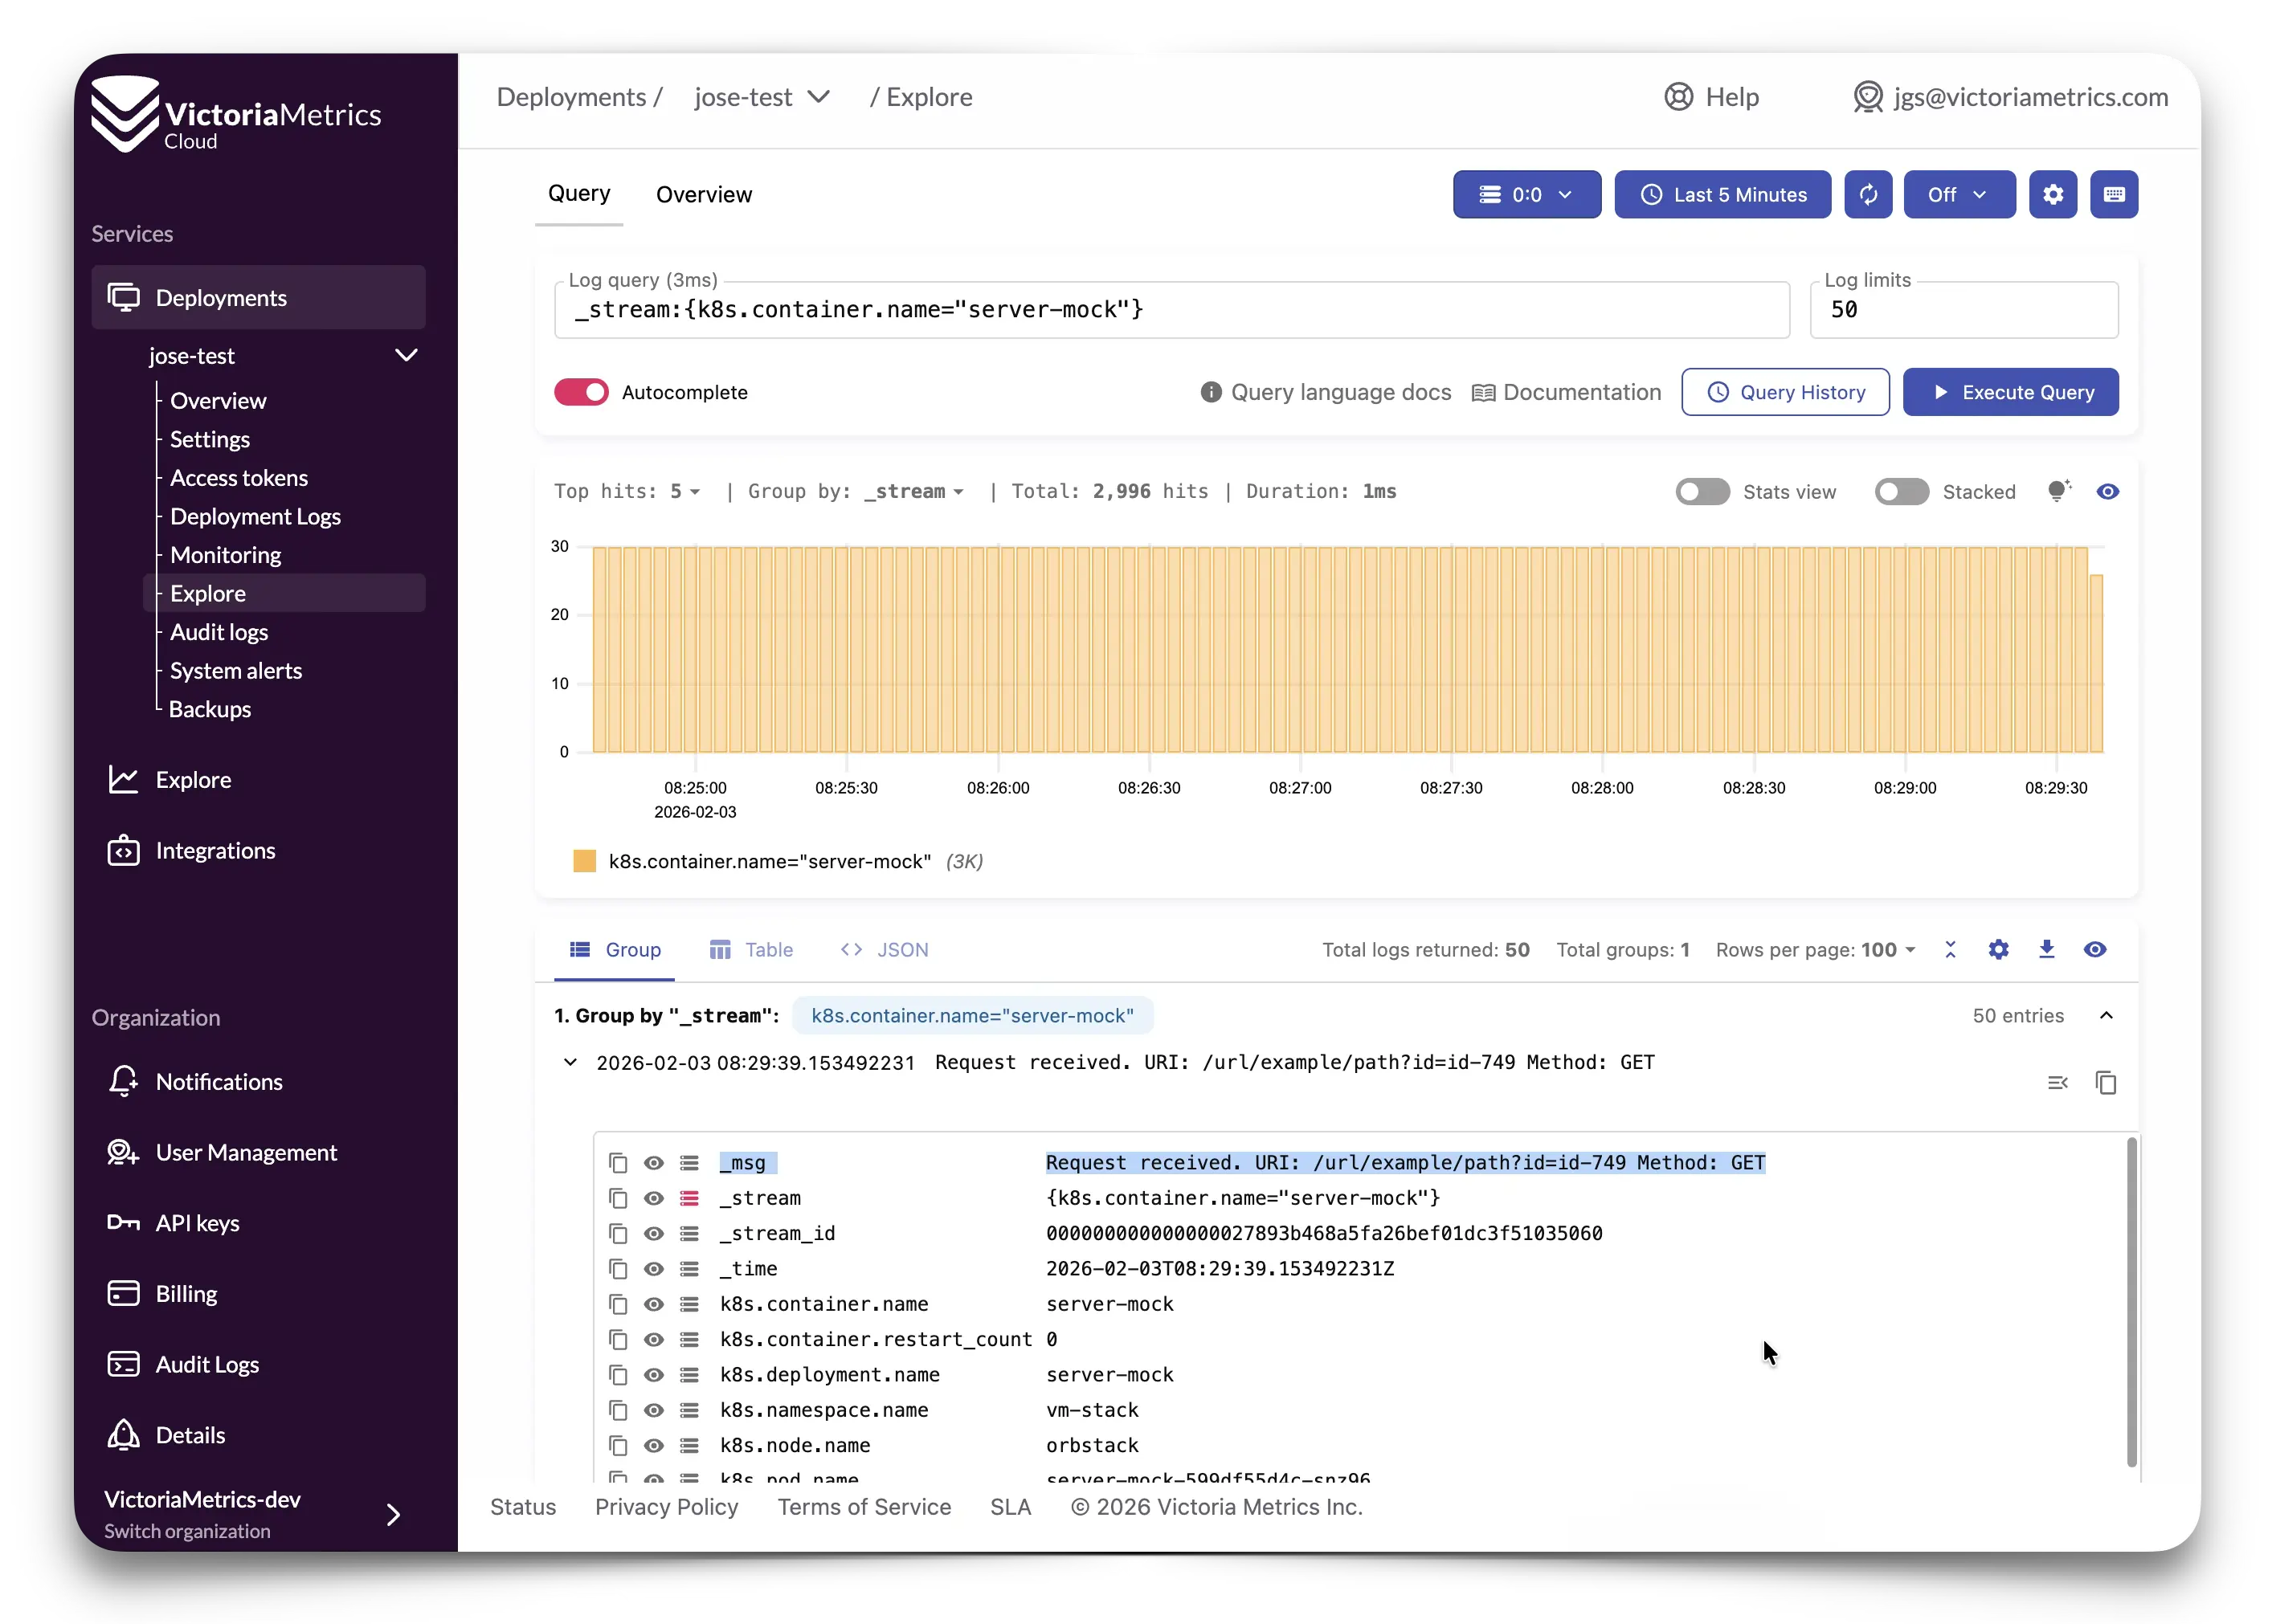
In this way, I’m telling VictoriaLogs to put together everything coming from the same container. Now I can go to the Explore section and, in the Overview tab, check which logs are coming from each container, together with hits and percentage statistics and the queries being used:
I can also move to the Query tab, and use the same queries or being helped by autocompleting while I write to make an ad-hoc analysis:
Integrate

#

VictoriaMetrics Cloud can easily be integrated with Data Visualization tools like Grafana or Perses.

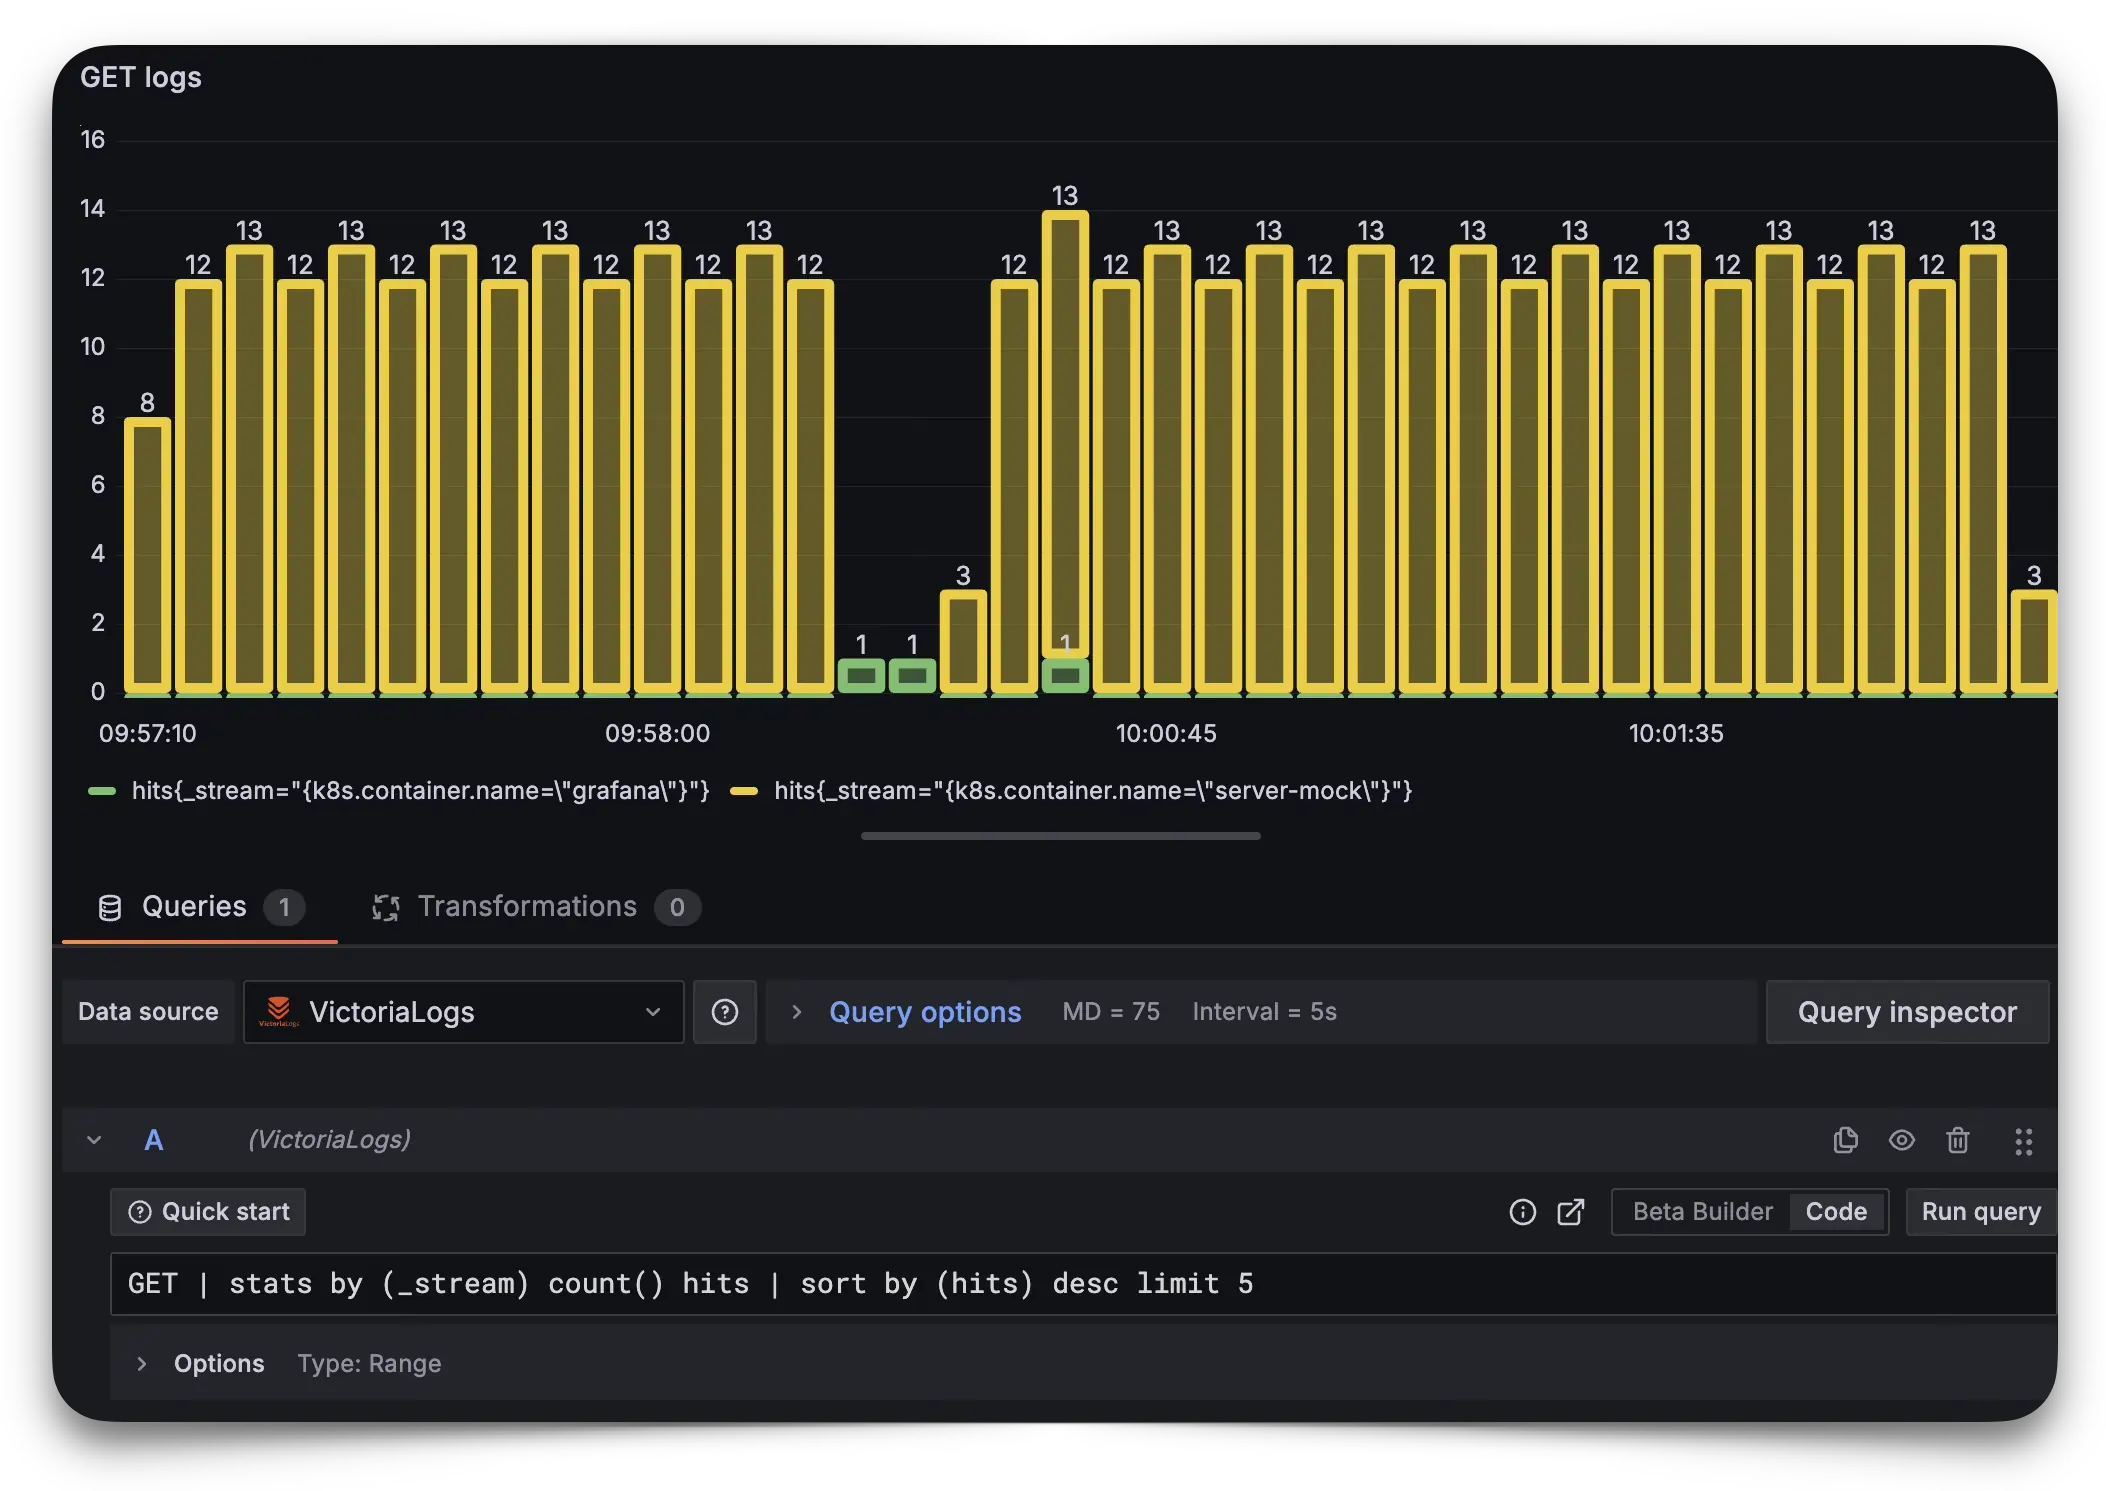
For example, after using the VictoriaLogs Plugin for Grafana with a Read-only Access Token, a range query can help us to see in real time, inside a dashboard, the evolution of GET queries received in a server in this way:

GET | stats by (_stream) count() hits | sort by (hits) desc limit 5

It will produce a visualization like this:
Go!

#

Now you have everything needed to get started. You’re ready to start reducing costs and time debugging issues. Of course, it would also be great to know your feedback. Don’t be shy!

#

We didn’t want to end this post without taking a moment to thank everyone who participated in our closed beta program. Your feedback, bug reports, feature requests, and real-world use cases have been instrumental in shaping VictoriaLogs for VictoriaMetrics Cloud. From helping us refine the UI to stress-testing integrations and pushing the limits of performance, you’ve made this product better in countless ways.

Special thanks as well to those who filled out our feedback surveys sharing your use cases. Your input directly influenced our roadmap, from tier design to integration priorities. We couldn’t have done this without you. ❤️

What’s next?

#

This has been a great start of the year. But that’s just a start. As we said at the beginning of this post: this was only another milestone in our observability journey. And we can’t wait to tell you more about what we’re cooking. Stay tuned!