It’s been an exciting journey since we launched VictoriaMetrics Cloud, empowering many with a managed, simple, reliable, and efficient monitoring solution to reduce monitoring costs by up to 5x. Designed to eliminate the overhead of running infrastructure, VictoriaMetrics Cloud has proven to be a game-changer, offering the scalability and power of the popular VictoriaMetrics open-source time-series database with added Enterprise features but, this time, fully managed. This means that users can focus on their own operations and code while we take care of managing the monitoring infrastructure with automated backups and scalability in a pay-as-you-go billing format.
In our Q3 update, we shared how new integrations, together with a new cluster topology and a lot of quality of life improvements are freeing enterprises from infrastructure maintenance while providing deep, actionable insights.
Today, as we start a new year, in case you missed our latest Virtual Meetup, we wanted to tell you more about the latest and greatest enhancements of VictoriaMetrics Cloud. These updates include two new integrations, improved billing features, enriched documentation, a more user-friendly interface, and enhanced usability—each designed to make your monitoring experience even smoother and more productive.
But that’s not all—read on to see what’s next on the horizon for VictoriaMetrics Cloud!
VictoriaMetrics Cloud already provides many ways of facilitating data ingestion, visualization, retrieval or even notifications from various different sources and technologies. All the way from enabling Kubernetes monitoring, setting up alerts, collecting workloads data via VMAgent and Vector, up to dashboarding in Perses or Grafana. This work keeps evolving and, this time, we are adding two more integrations to the mix.
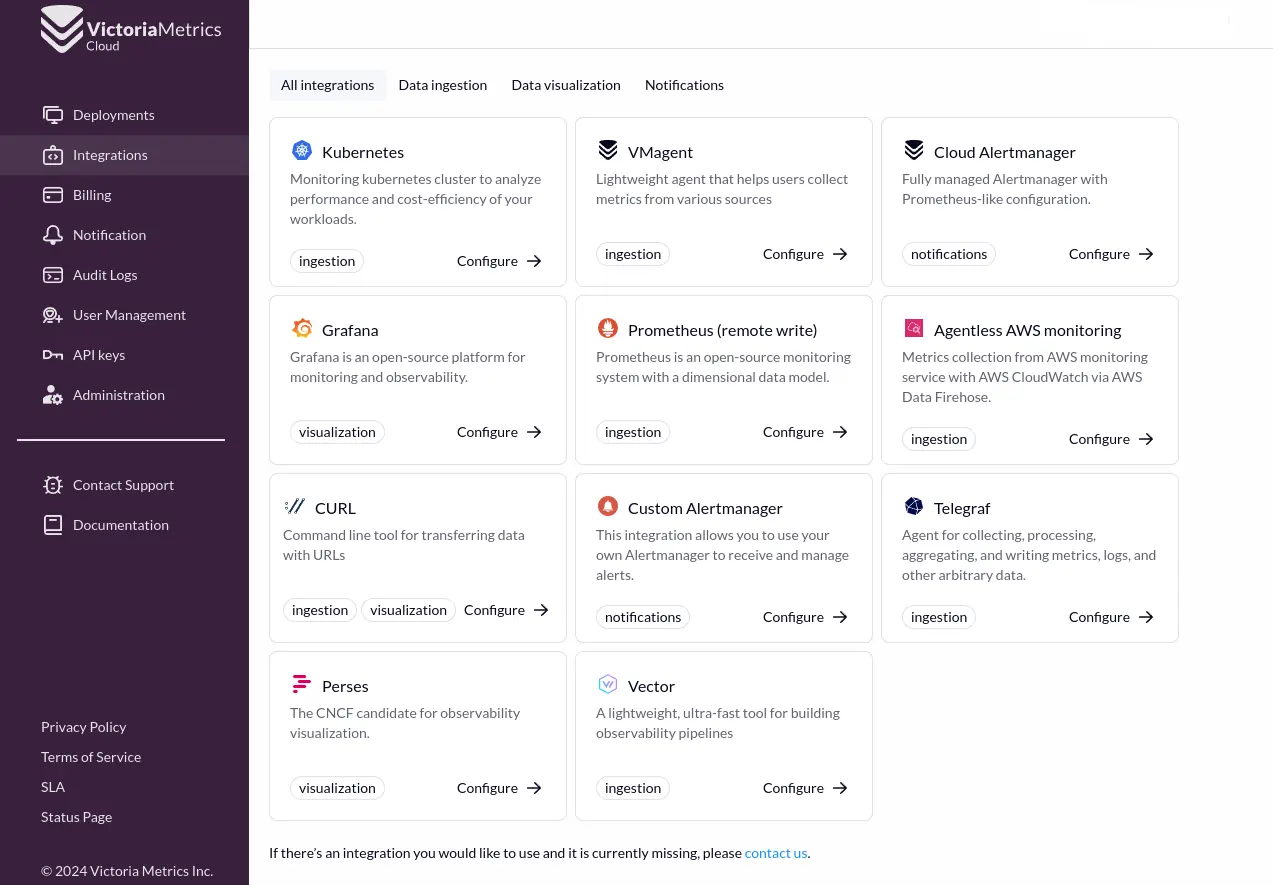 Integrations available in VictoriaMetrics Cloud
Before jumping into it, remember that integrating VictoriaMetrics Cloud is super easy. This is because VictoriaMetrics is compatible with nearly every protocol out there (and if we are missing something, let us know!). Based on this flexibility, it all comes down to just tweak some read or write tokens. That’s it! In any case, we know that the landscape is vast, and going through documentation of every tool can be exhausting. That’s why we aim at easing this experience for our cloud users with direct and easy step-by-step guides embedded in the VictoriaMetrics Cloud user interface.
In any case, if you are interested in knowing how it’s done, now we summarize the needed steps for the two brand new integrations that you can find in the latest version of VictoriaMetrics Cloud: Agentless AWS monitoring service with CloudWatch via Data Firehose and curl.
This is a great addition for those users who want to observe their workloads and platforms running on AWS, and export metrics from Amazon CloudWatch. In this case, the data transport will be OpenTelemetry through Amazon Data Firehose. By the way, if you want to learn more about this integration feel free to read more in this article in ITNEXT written by Arseny Zinchenko.
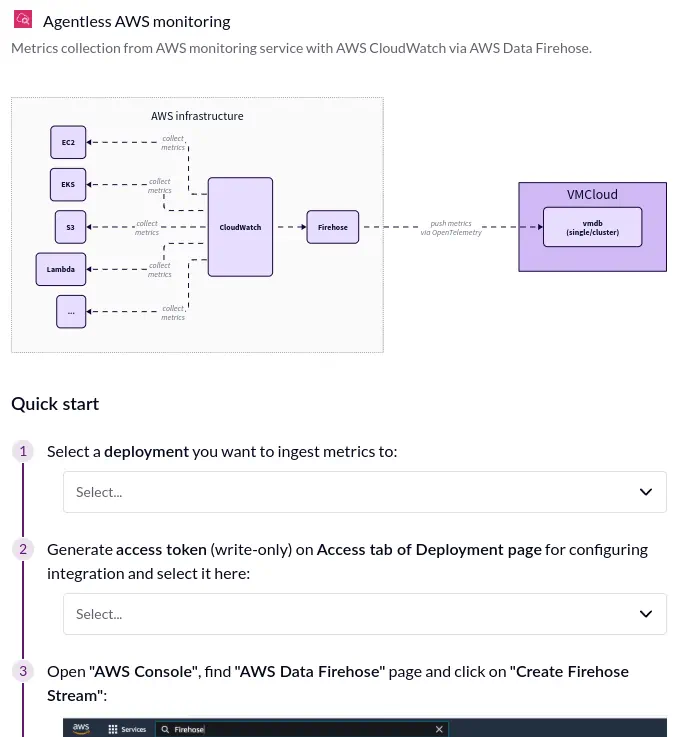 CloudWatch integration in VictoriaMetrics Cloud
All in all, you just need to follow these steps:
Create a Firehose Stream in the AWS Console with Direct PUT as Source and HTTP Endpoint as Destination, and give it a name.
We will be using the OpenTelemetry write url, which will look something like:
https://<your_cluster_url>/opentelemetry/api/v1/push or https://<your_cluster_url>/insert/0/opentelemetry/api/v1/push
if you are running the cluster version.Bearer ******* (your write bearer token)GZIPConfigure an S3 bucket
After that, Create a metric stream in AWS CloudWatch with the destination towards the just created Custom setup with Firehose, and give it a name.
Since we exported these metrics to VictoriaMetrics Cloud via OpenTelemetry, we need to take into account
that there’s a difference between formats when querying. But fear not! To automatically convert
metrics to Prometheus-compatible format, we just need to activate the opentelemetry.usePrometheusNaming
flag on the Settings tab (in “Advanced settings” section):
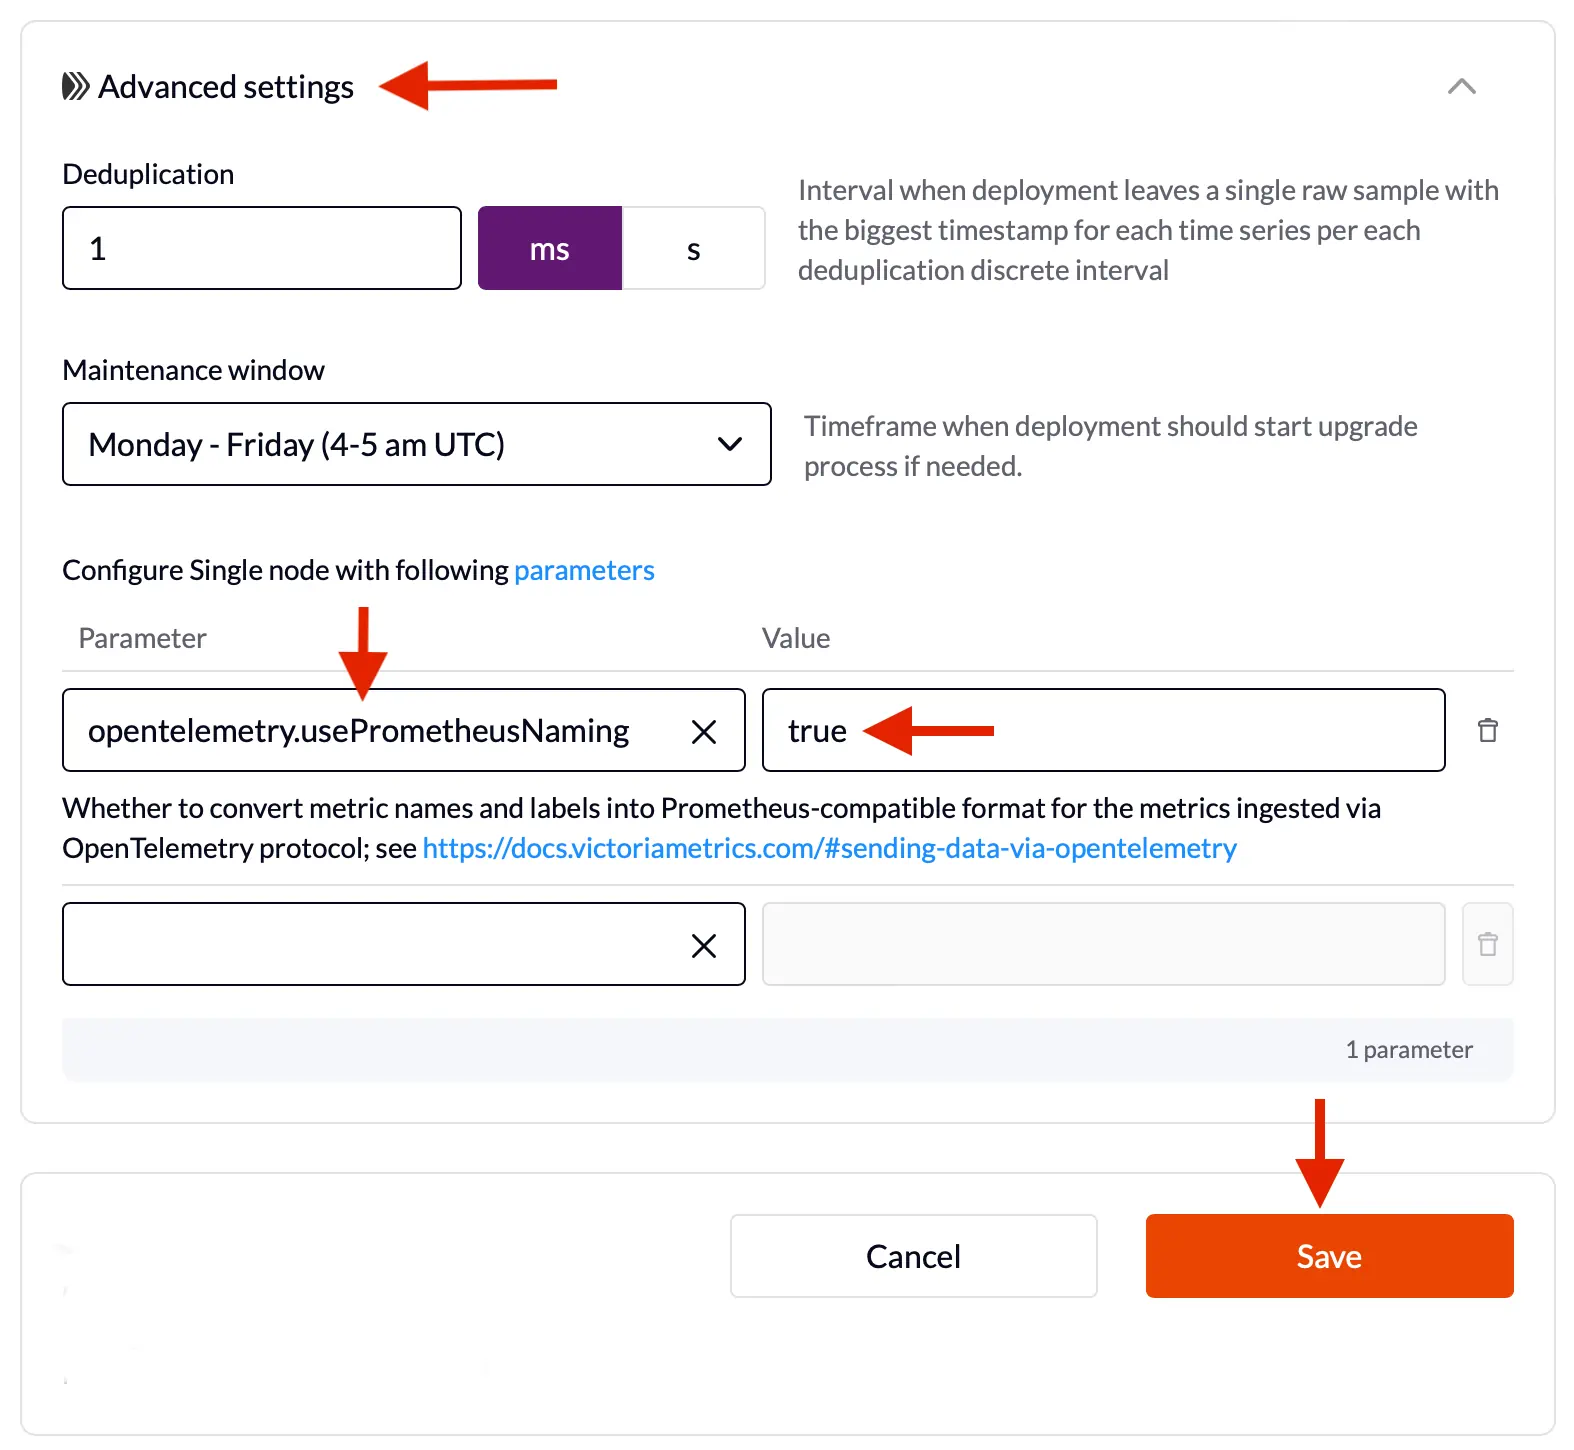 Activating OpenTelemetry-to-Prometheus naming flag
It wasn’t that hard, right? Remember that you can find a step-by-step guide on how to perform this integration inside the User Interface.
Fancy dashboards and modern integrations are great, and we love them! But sometimes we just need to curl our way out of many situations. Whether we are trying to add manually some data for tests, at scale in production with automations in kilometric bash scripts, or even exporting some metrics inside a Jenkins job for later analysis, curl-ing an API is just useful and handy.
That’s why we have included this simple, yet powerful, integration to guide you through it. As it happened with our previous integration, you will find this information right in the User Interface with a wizard guiding your steps!
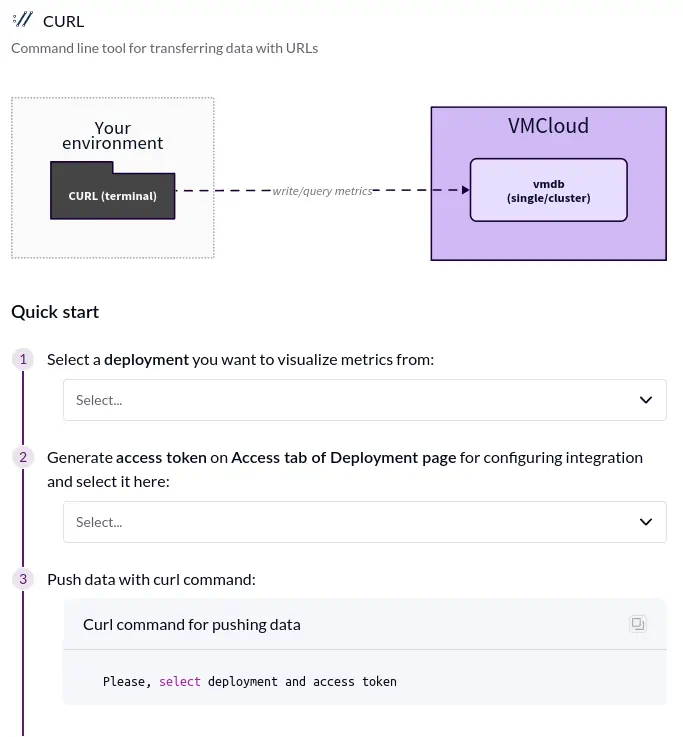 Read, query and export data with curl
Of course it cannot be easier! Remember, we just need to obtain our Read or Write Access tokens from our VictoriaMetrics Cloud deployment, and add them to the Authorization header:
curl \
  -H 'Authorization: Bearer <your_token>' \
  -X POST 'https://<your_cluster_url>/insert/0/prometheus/api/v1/import/prometheus' \
  -d 'foo{bar="baz"} 123'
curl \
  -H 'Authorization: Bearer <your_token>' \
  'https://<your_cluster_url>/select/0/prometheus/api/v1/query' \
  -d 'query=sum(foo)'
curl \
  -H 'Authorization: Bearer <your_token>' \
  'https://<your_cluster_url>/select/0/prometheus/api/v1/export' \
  -d 'match={__name__=~".*"}'
Of course, you can also use other APIs available in VictoriaMetrics.
“Where did I put this invoice?” “Was I already charged for this?” “Did I forget to pay that one?”…
If these questions sound familiar, this enhancement is for you. After collecting feedback from our users it became clear that, apart from the notifications and AWS centralized page for payments, we needed an Invoices page to look and download all receipts from a single page while tracking their status for past and near future payments via credit card.
You can find the new info under the Invoices together with your Usage and Payment methods tabs.
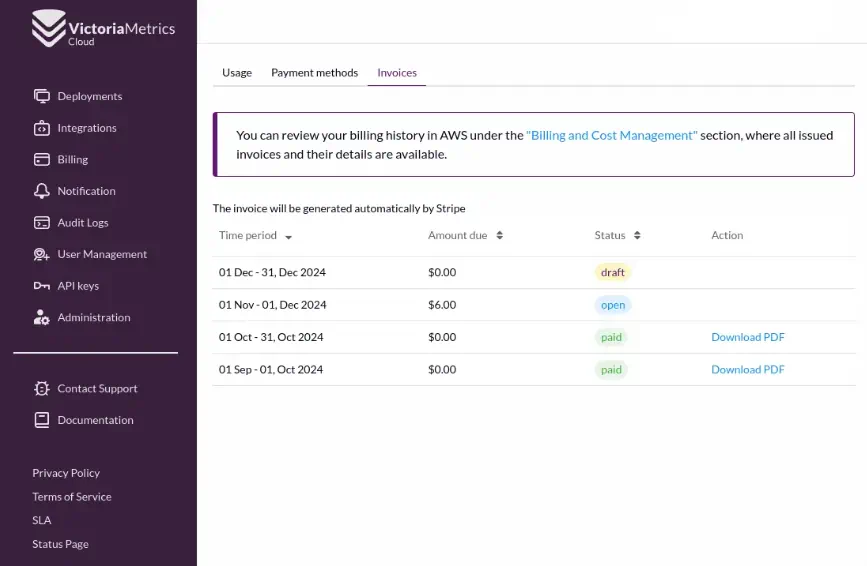 New Invoices tab in the billing page
If it’s not documented, it doesn’t exist. That’s a law in software as true as the fact that deploying on Fridays is not a great idea. That’s why we continue improving our docs. Check out our new Billing, Audit logs and VictoriaMetrics Cloud API documentation pages and let us know what you think!
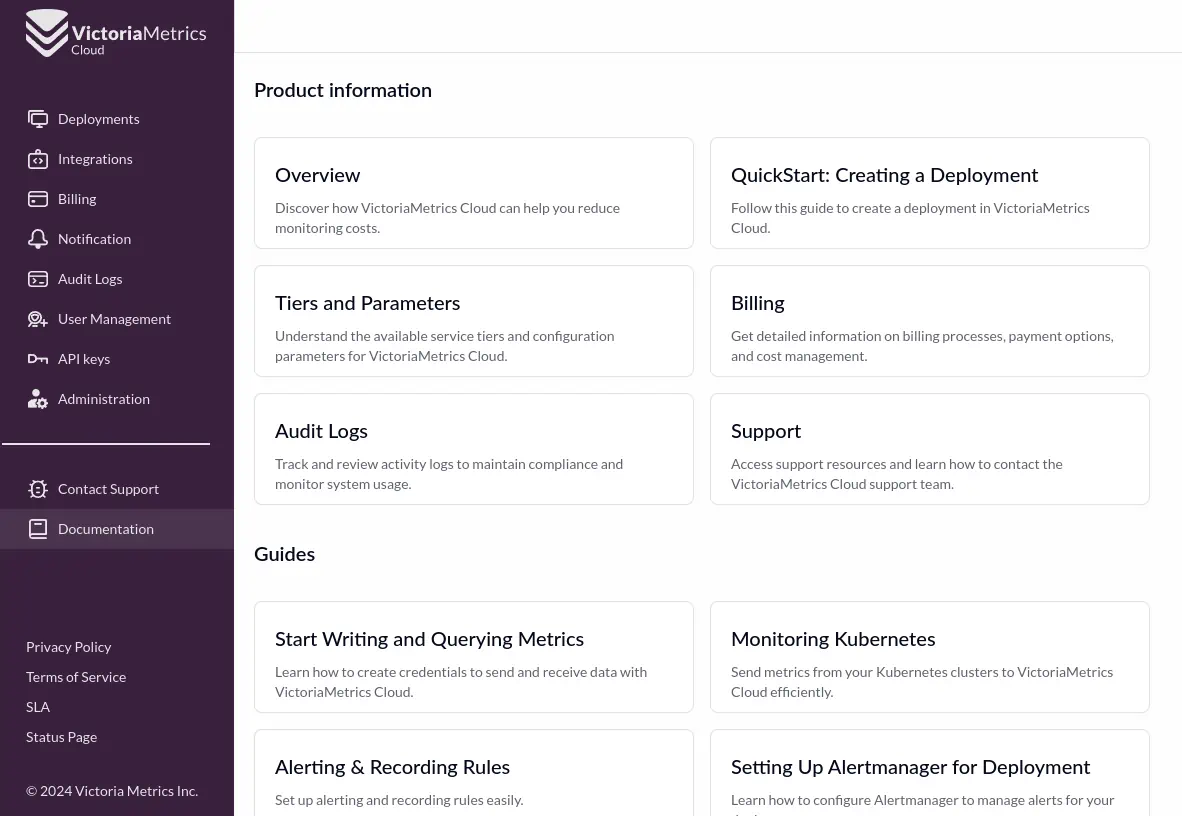 Documentation Section with Product Information and Guides
The last thing we wanted to mention, (but it’s really, really taking a lot of our attention for this last part of the year) is the improvements we are doing based on your invaluable feedback to the User Interface navigation and usability.
We are investing in major changes that will make our page more reactive (wink, wink), which are already noticeable with reduced loading times and smoother navigation. This is an extremely important task that unblocks future improvements that we are already planning. Stay tuned for more!
The VictoriaMetrics Cloud team is excited to continue enhancing our users’ experience based on feedback, and we’ll always focus on improving usability and navigation, making it even easier to use the managed monitoring setup.
Also, we are already working on new Alert Manager deployment options, expanded integrations, support for Organizations management directly within the cloud UI and a new way to monitor and manage your cloud deployments. Stay tuned, because the new updates are big!
Last but not least… Have you heard about VictoriaLogs? Would you like a managed version of it? If so, please let us know about your use case at victoriametrics.com/contact-us/.
Thanks for reading and providing precious feedback. Whether it is for Open Source, Enterprise or Cloud, your feedback and contributions are what makes us better every day. See you in the next update!
And… remember that you can try VictoriaMetrics Cloud for free! Sign up today!
此内容由惯性聚合(RSS阅读器)自动聚合整理,仅供阅读参考。 原文来自 — 版权归原作者所有。