惯性聚合 高效追踪和阅读你感兴趣的博客、新闻、科技资讯
阅读原文 在惯性聚合中打开

推荐订阅源

N
News and Events Feed by Topic
S
Security @ Cisco Blogs
S
Secure Thoughts
Attack and Defense Labs
cs.AI updates on arXiv.org
Hacker News - Newest:
Hacker News - Newest: "LLM"
Recent Commits to openclaw:main
H
Hacker News: Front Page
博客园 - 叶小钗
H
Heimdal Security Blog
Microsoft Security Blog
Forbes - Security
Forbes - Security
AI
AI
cs.CV updates on arXiv.org
T
Troy Hunt's Blog
罗磊的独立博客
Application and Cybersecurity Blog
爱范儿
爱范儿
GbyAI
GbyAI
The Last Watchdog
The Last Watchdog
TaoSecurity Blog
TaoSecurity Blog
C
CXSECURITY Database RSS Feed - CXSecurity.com
D
DataBreaches.Net
Recent Announcements
Schneier on Security
C
Cisco Blogs
美团技术团队
D
Docker
让小产品的独立变现更简单 - ezindie.com
WordPress大学
WordPress大学
月光博客
月光博客
雷峰网
雷峰网
Threat Intelligence Blog | Flashpoint
H
Hackread – Cybersecurity News, Data Breaches, AI and More
A
Arctic Wolf
B
Blog RSS Feed
Cisco Talos Blog
Cisco Talos Blog
C
Cybersecurity and Infrastructure Security Agency CISA
V
Vulnerabilities – Threatpost
V2EX - 技术
V2EX - 技术
Y
Y Combinator Blog
N
News and Events Feed by Topic
www.infosecurity-magazine.com
W
WeLiveSecurity
Security Archives - TechRepublic
G
GRAHAM CLULEY
Jina AI
Jina AI
Hugging Face - Blog
Hugging Face - Blog
酷 壳 – CoolShell
酷 壳 – CoolShell
The Hacker News
The Hacker News

VictoriaMetrics: Simple & Reliable Monitoring for Everyone on VictoriaMetrics

Operator now has Long-Term Support (LTS) version Multi-tiered Observability: A Practical Way to Handle Diverse Workloads VictoriaMetrics April 2026 Ecosystem Updates Not All Telemetry Requires Premium Pricing VictoriaMetrics at KubeCon Amsterdam: Community Highlights What's new in VictoriaMetrics Anomaly Detection (Q1 2026) What's New in VictoriaMetrics Cloud Q1 2026? Logs, MCP Server, Better Alerting, and... a Secret Project VictoriaMetrics at KubeCon: Optimizing Tail Sampling in OpenTelemetry with Retroactive Sampling VictoriaMetrics March 2026 Ecosystem Updates Observability Lessons From OpenAI Benchmarking Kubernetes Log Collectors: vlagent, Vector, Fluent Bit, OpenTelemetry Collector, and more VictoriaMetrics February 2026 Ecosystem Updates VictoriaMetrics at FOSDEM, Cloud Native Days France, and CfgMgmtCamp Ghent VictoriaLogs in VictoriaMetrics Cloud: Fast, Cost-Effective Log Management is Here VictoriaMetrics January 2026 Ecosystem Updates VictoriaLogs Basics: What You Need to Know, with Examples & Visuals What's New in VictoriaMetrics Cloud Q4 2025? New tiers, more deployment options, IaC and alerting rules. Vibe coding tools observability with VictoriaMetrics Stack and OpenTelemetry How a US Software Provider Improved Traffic Alerting with VictoriaMetrics Anomaly Detection VictoriaMetrics 2025 Developer Experience: A Year in Review Spotify’s performance & control across large monitoring environments with VictoriaMetrics VictoriaMetrics Achieves Red Hat OpenShift Operator Certification Our latest updates across the VictoriaMetrics Observability ecosystem New Capacity Tiers in VictoriaMetrics Cloud Announcing 1B+ Downloads & Product Development With Logs, Traces, Metrics AI Agents Observability with OpenTelemetry and the VictoriaMetrics Stack Discarding gRPC-Go: The Story Behind OTLP/gRPC Support in VictoriaTraces What's New in VictoriaMetrics Cloud Q3 2025? From new region in Asia to proactive alerts How DreamHost Slashed Memory Usage by 80% and Scaled to 76 Million Time Series Upcoming Conferences & Meetups: Where to Meet Our Team VictoriaMetrics Long-Term Support (LTS): H2 2025 Update Creating a Sustainable Open Source Business Model - Introduction Full-Stack Observability with VictoriaMetrics in the OTel Demo Alerting Best Practices vmanomaly Deep Dive: Smarter Alerting with AI (Tech Talk Companion) VictoriaLogs Practical Ingestion Guide for Message, Time and Streams Monotonic and Wall Clock Time in the Go time package Hello Singapore! VictoriaMetrics Cloud Expands to Asia Pacific MCP Server Integration & Much More: What's New in VictoriaMetrics Cloud Q2 2025 FIPS 140-3 Compatible Builds for VictoriaMetrics Enterprise Components VictoriaLogs Unleashed: Cluster Version Now Available for Exceptional, Linear Scaling Integrations made easy with VictoriaMetrics Cloud Developer's Note: Research on Distributed Tracing, Comparing With Tempo and ClickHouse vmagent: Key Features Explained in Under 15 Minutes Go synctest: Solving Flaky Tests vmalert: Maximize Your Monitoring (Tech Talk Companion) Celebrating 14K Stars on GitHub: Spring Update vmalert: Maximize Your Monitoring VictoriaMetrics Connects with the Open Source Community at LinuxFest Northwest 2025 Graceful Shutdown in Go: Practical Patterns VictoriaLogs: Gaps, Gains & Growth Prometheus Monitoring: Functions, Subqueries, Operators, and Modifiers VictoriaMetrics Cloud: What's New in Q1 2025? Don’t default to microservices: You’ll thank us later! Container CPU Requests & Limits Explained with GOMAXPROCS Tuning gRPC in Go: Streaming RPCs, Interceptors, and Metadata From Chaos to Clarity with VictoriaLogs Prometheus Alerting 101: Rules, Recording Rules, and Alertmanager Heading to London: Meet Our Team at KubeCon Europe 2025 Inside vmselect: The Query Processing Engine of VictoriaMetrics Meet Our Team at Scale 22x Practical Protobuf - From Basic to Best Practices VictoriaLogs Status Update: Heading Towards the Cluster Version 24th of February 2025 Statement: VictoriaMetrics Stands with Ukraine! Prometheus Metrics Explained: Counters, Gauges, Histograms & Summaries Prometheus Monitoring: Instant Queries and Range Queries Explained 300%+ Growth in 2024: Join Our Team in 2025! FOSDEM 2025 recap How Protobuf Works—The Art of Data Encoding OpenTelemetry, Prometheus, and More: Which Is Better for Metrics Collection and Propagation? How vmstorage Handles Query Requests From vmselect How vmstorage's IndexDB Works VictoriaMetrics Tech Talk Stream: A Deep Dive into Blackbox Monitoring How HTTP/2 Works and How to Enable It in Go VictoriaMetrics Cloud: What's New in Q4 2024? How vmstorage Processes Data: Retention, Merging, Deduplication,... How vmstorage Handles Data Ingestion From vminsert When Metrics Meet vminsert: A Data-Delivery Story From net/rpc to gRPC in Go Applications VictoriaMetrics helps IHI Terrasun Win Big in Vegas on $1.2B Clean Energy Project Piros | VictoriaMetrics Partner Allenta | VictoriaMetrics Partner CloudRaft | VictoriaMetrics Partner Sensedia & VictoriaMetrics: API-compatible Efficient Storage Scalable Prometheus: Why DSV Chose VictoriaMetrics Sensor Factory | VictoriaMetrics Partner Erythix | VictoriaMetrics Partner Groove X & VictoriaMetrics: Faster Device Health Monitoring Scaled & Performant Monitoring at Spotify with VictoriaMetrics Grammarly & VictoriaMetrics: 10× Lower Costs & Direct Access Zelarsoft | VictoriaMetrics Partner DFKI & VictoriaMetrics: Efficient Long-Term Metric Storage Niubits | VictoriaMetrics Partner Megazone Cloud | VictoriaMetrics Partner Cogito Software | VictoriaMetrics Partner Bajau | VictoriaMetrics Partner Find Out Why Dig Security Chose VictoriaMetrics! Ness | VictoriaMetrics Partner Alpha Data | VictoriaMetrics Partner SIOS Technology | VictoriaMetrics Partner
What’s new in VictoriaMetrics Anomaly Detection (2025)
Fred Navruzov · 2026-02-03 · via VictoriaMetrics: Simple & Reliable Monitoring for Everyone on VictoriaMetrics

It’s been a while since the last update on “What’s New” series, so I will try and keep it short yet informative.

Stay tuned for upcoming content on anomaly detection.

Series posts:

Introduction

#

For those who might not be familiar: VictoriaMetrics Anomaly Detection (vmanomaly) is our anomaly detection product available to enterprise customers. It is designed to help teams get insights from timeseries-like data (pure metrics or message-derived metrics) received from VictoriaMetrics, VictoriaLogs or VictoriaTraces for unexpected changes in behavior, simplifying alerting rules and their maintenance, improving signal reliability and reducing operational overhead. Learn more about vmanomaly from our docs.

VictoriaMetrics Anomaly Detection has had a productive year with lots of user feedback that has had a major impact on product development. So first and foremost: a big thank you to all of our users that have contributed feedback!

We’ve added improvements across the board: in core functionality, simplicity, performance, visualisation and AI integration. In addition to bug fixes and speedups, below is a list of what was accomplished in 2025.

Stateful Mode

#

Stateful mode was added for operational continuity and resource optimization. This means vmanomaly can easily catch up with what has been happening if an outage takes place by persisting and restoring its state - including anomaly detection model instances and training data - between service runs, mitigating the need to have to retrain the models from scratch. Stateful deployments can also be augmented with config hot reloading, so you can make changes to your schedulers, models or data and see the effects without downtime - what can be reused, will be reused, what’s changed will be applied.

Stateful mode can be enabled by the restore_state setting (first introduced in v1.24.0) in a config.

Example use cases:

  • Larger anomaly detection setups requiring state and persistence across restarts where reliability and continuity are critical and refitting models from scratch is costly.

  • Scenarios requiring continuity for online (incrementally updated) models without losing learned patterns in accumulated state.

Hot Reloading

#

As mentioned above, hot reloading allows you to make changes to your configuration without restarting the service. This is particularly useful for large setups where downtime is costly or undesirable. Also, the neat side effect is that you can also override logging levels on the fly to limit the logs of desired components (like service, scheduler or reader) and troubleshoot issues without restarting the service.

Migration

#

As vmanomaly deployments evolve, become more complex and support state, we added a dedicated page for migrating to the latest version of vmanomaly. It covers the key changes, compatibility considerations, and best practices to ensure a smooth transition for stateful and stateless modes of operation with a compatibility matrix and list of breaking changes list.

As a part of the migration process, dry-run mode was added for convenient config validation. Now you can check what models could be lost during migration or when updating to a newer version of vmanomaly without actually applying the changes. This is particularly useful for large setups where you want to ensure that no unintended changes occur during upgrades or config modifications.

High Availability and Scalability

#

To ensure continuous operation and fault tolerance, vmanomaly now supports High Availability (HA) deployments and horizontal scalability (HS) strategies based on global config sharding into sub-configurations. This allows multiple instances of vmanomaly to receive the same global config but operate on different subsets of data, models or schedulers, improving fault tolerance and load distribution.
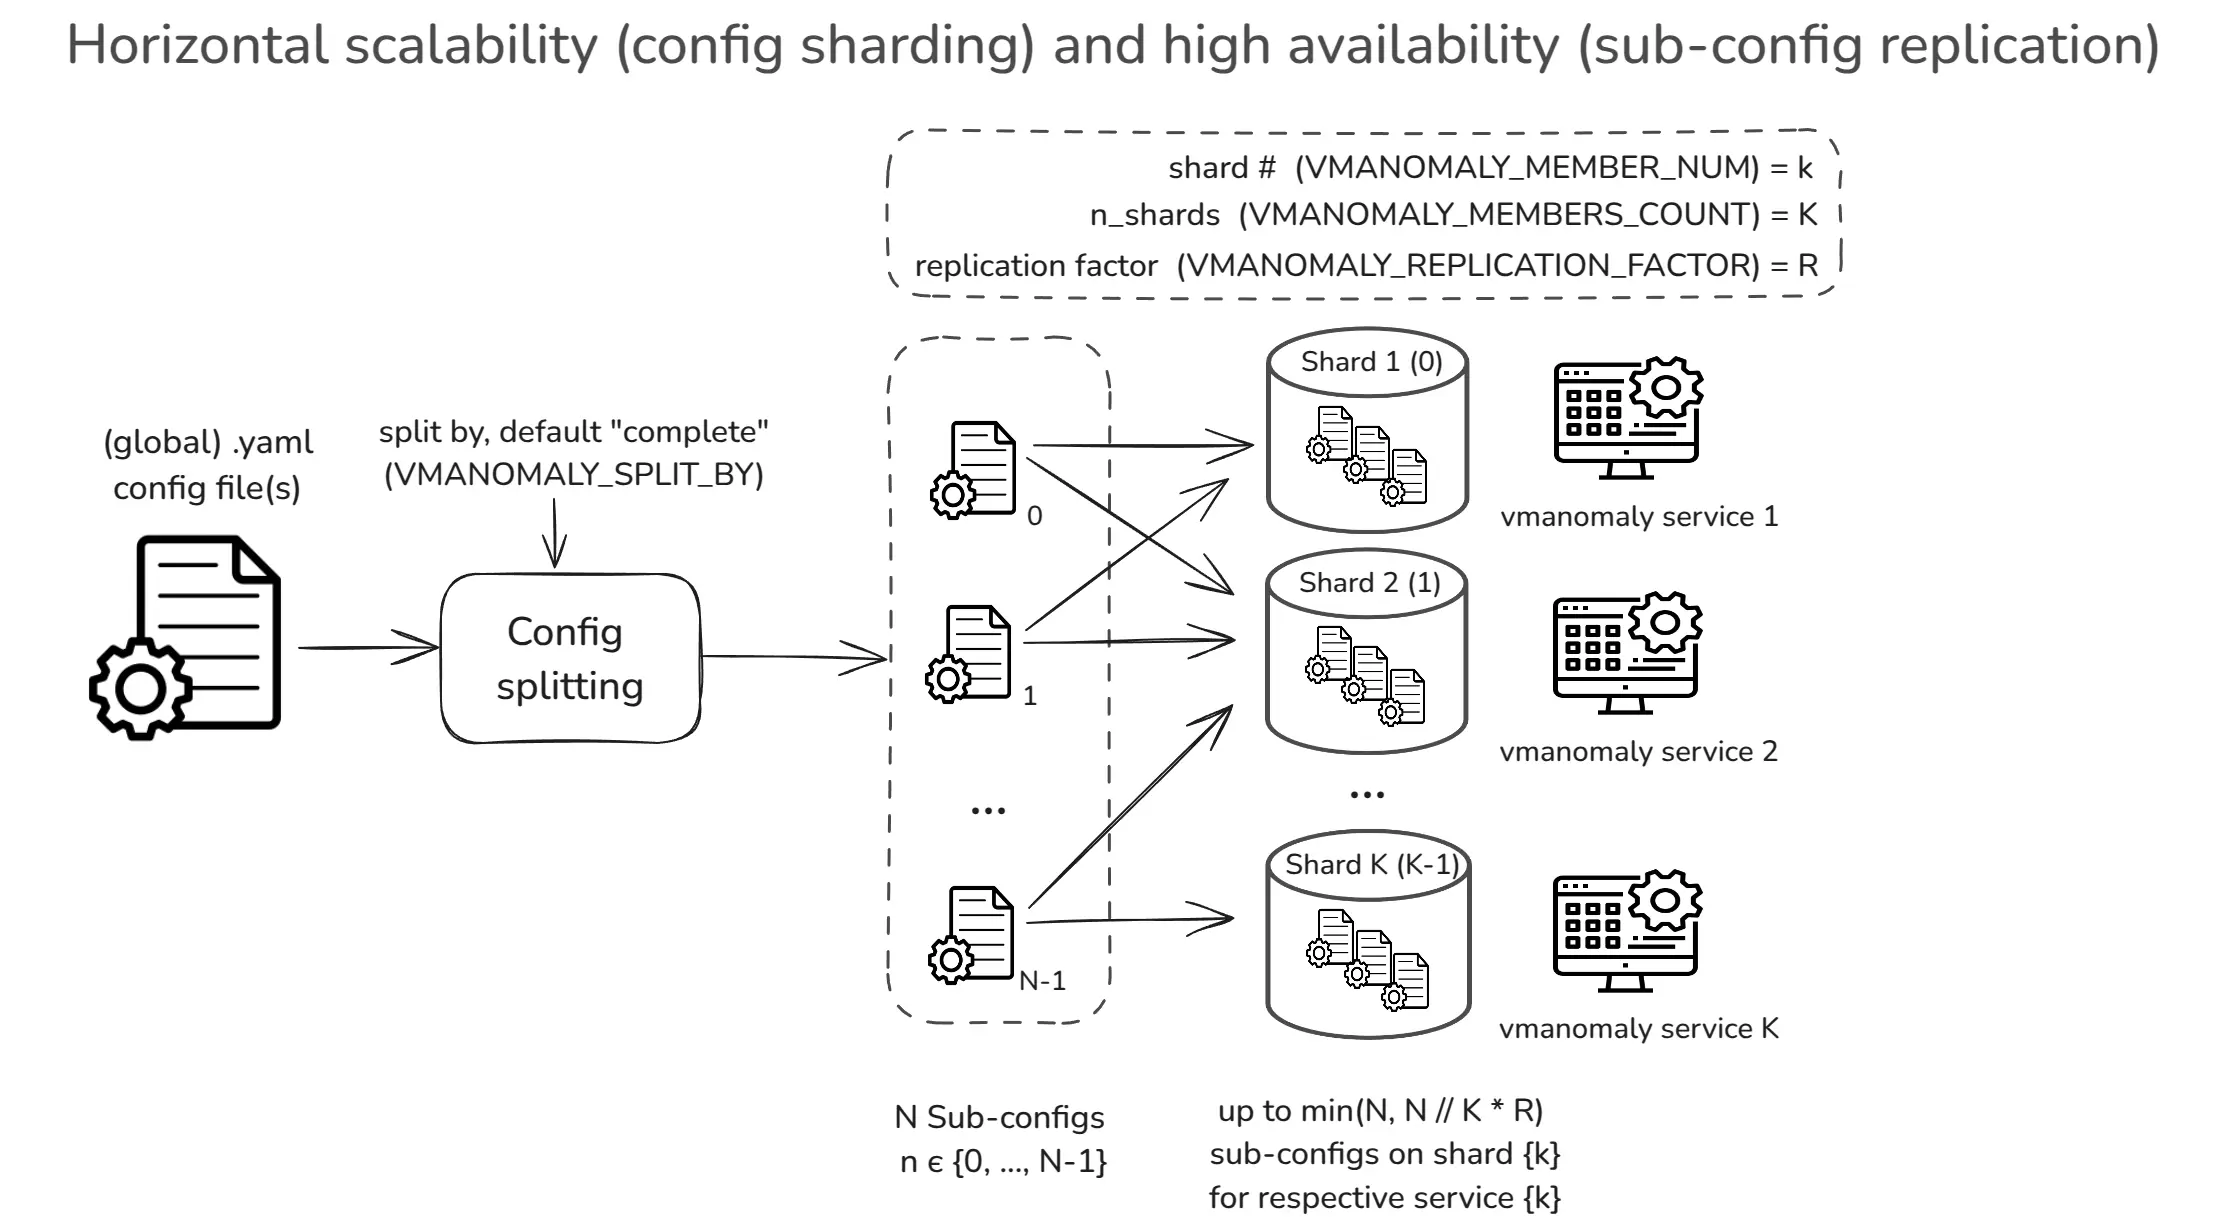
vmanomaly HA & HS architecture example

Please refer to deployment option settings for more details on how to set up HA and HS deployments for Docker, Docker Compose or Kubernetes helm charts.

New Data Sources

#

vmanomaly now supports additional input data sources for anomaly detection through VictoriaLogs reader, allowing users to monitor log-derived and traces-derived metrics for anomalies. This expands the versatility, enabling it to handle a wider range of data sources beyond timeseries metrics from VictoriaMetrics or Prometheus, including VictoriaLogs and VictoriaTraces.

Under the hood, it leverages /select/stats_query_range endpoint of VictoriaLogs / VictoriaTraces to fetch Prometheus-compatible metrics for anomaly detection.

Switching to log-derived metrics is as simple as changing the reader type in the service config, and changing the query language to LogsQL respectively:

# other config settings, like schedulers, models, etc.
reader:
  type: vlogs
  queries:
    # good baseline series to detect drops/spikes without depending on any schema
    ingestion_volume:
      expr: * | stats count() as logs
      step: 5m
    ingestion_rate:
      expr: * | stats rate() as logs_per_sec
      step: 5m
    # catches “new sources exploded”/“sources disappeared”.
    active_streams:
      expr: * | stats count_uniq(_stream) as active_streams
      step: 3m
    # other LogsQL | stats pipe queries ...
  # other vm-like reader settings

Visualizations

#

To improve user experience and facilitate easier management of anomaly detection configurations and results, several visualization tools have been introduced:

UI

#

The UI has been released to help users visualize and manage their anomaly detection configurations and results more effectively. The UI provides an intuitive interface for exploring detected anomalies, configuring models with wizard-like guidance, backtesting, copying generated configs and alerting rules to a production setup.
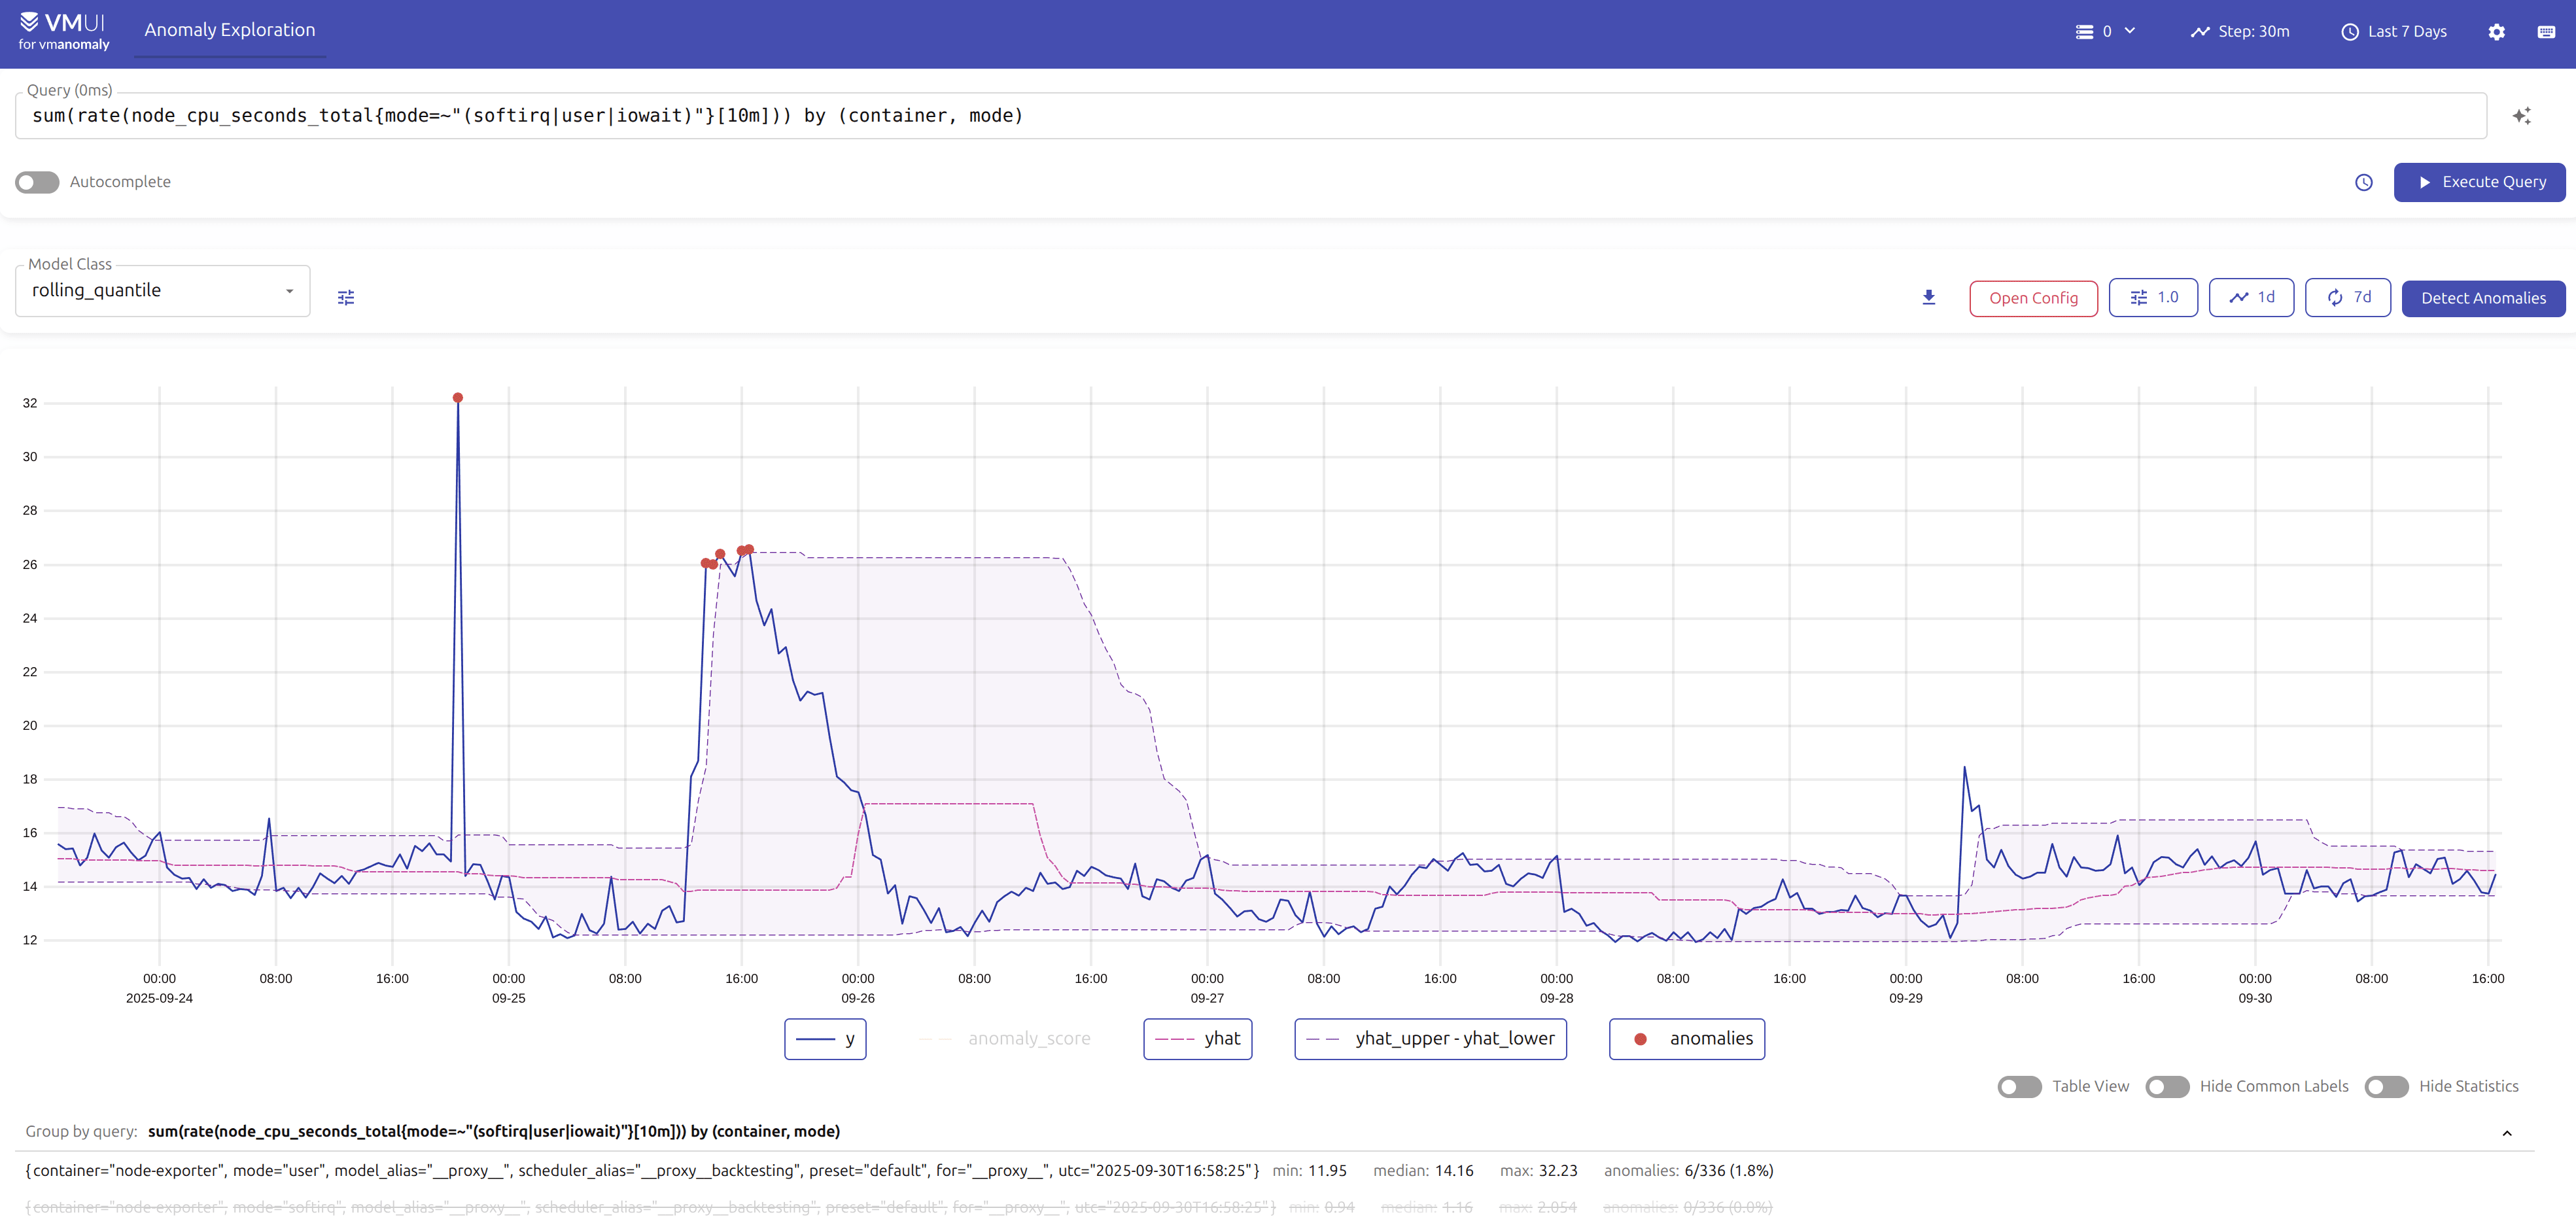
vmanomaly UI overview

You can find usage example and detailed guide in the respective docs.

Anomaly Score Dashboard

#

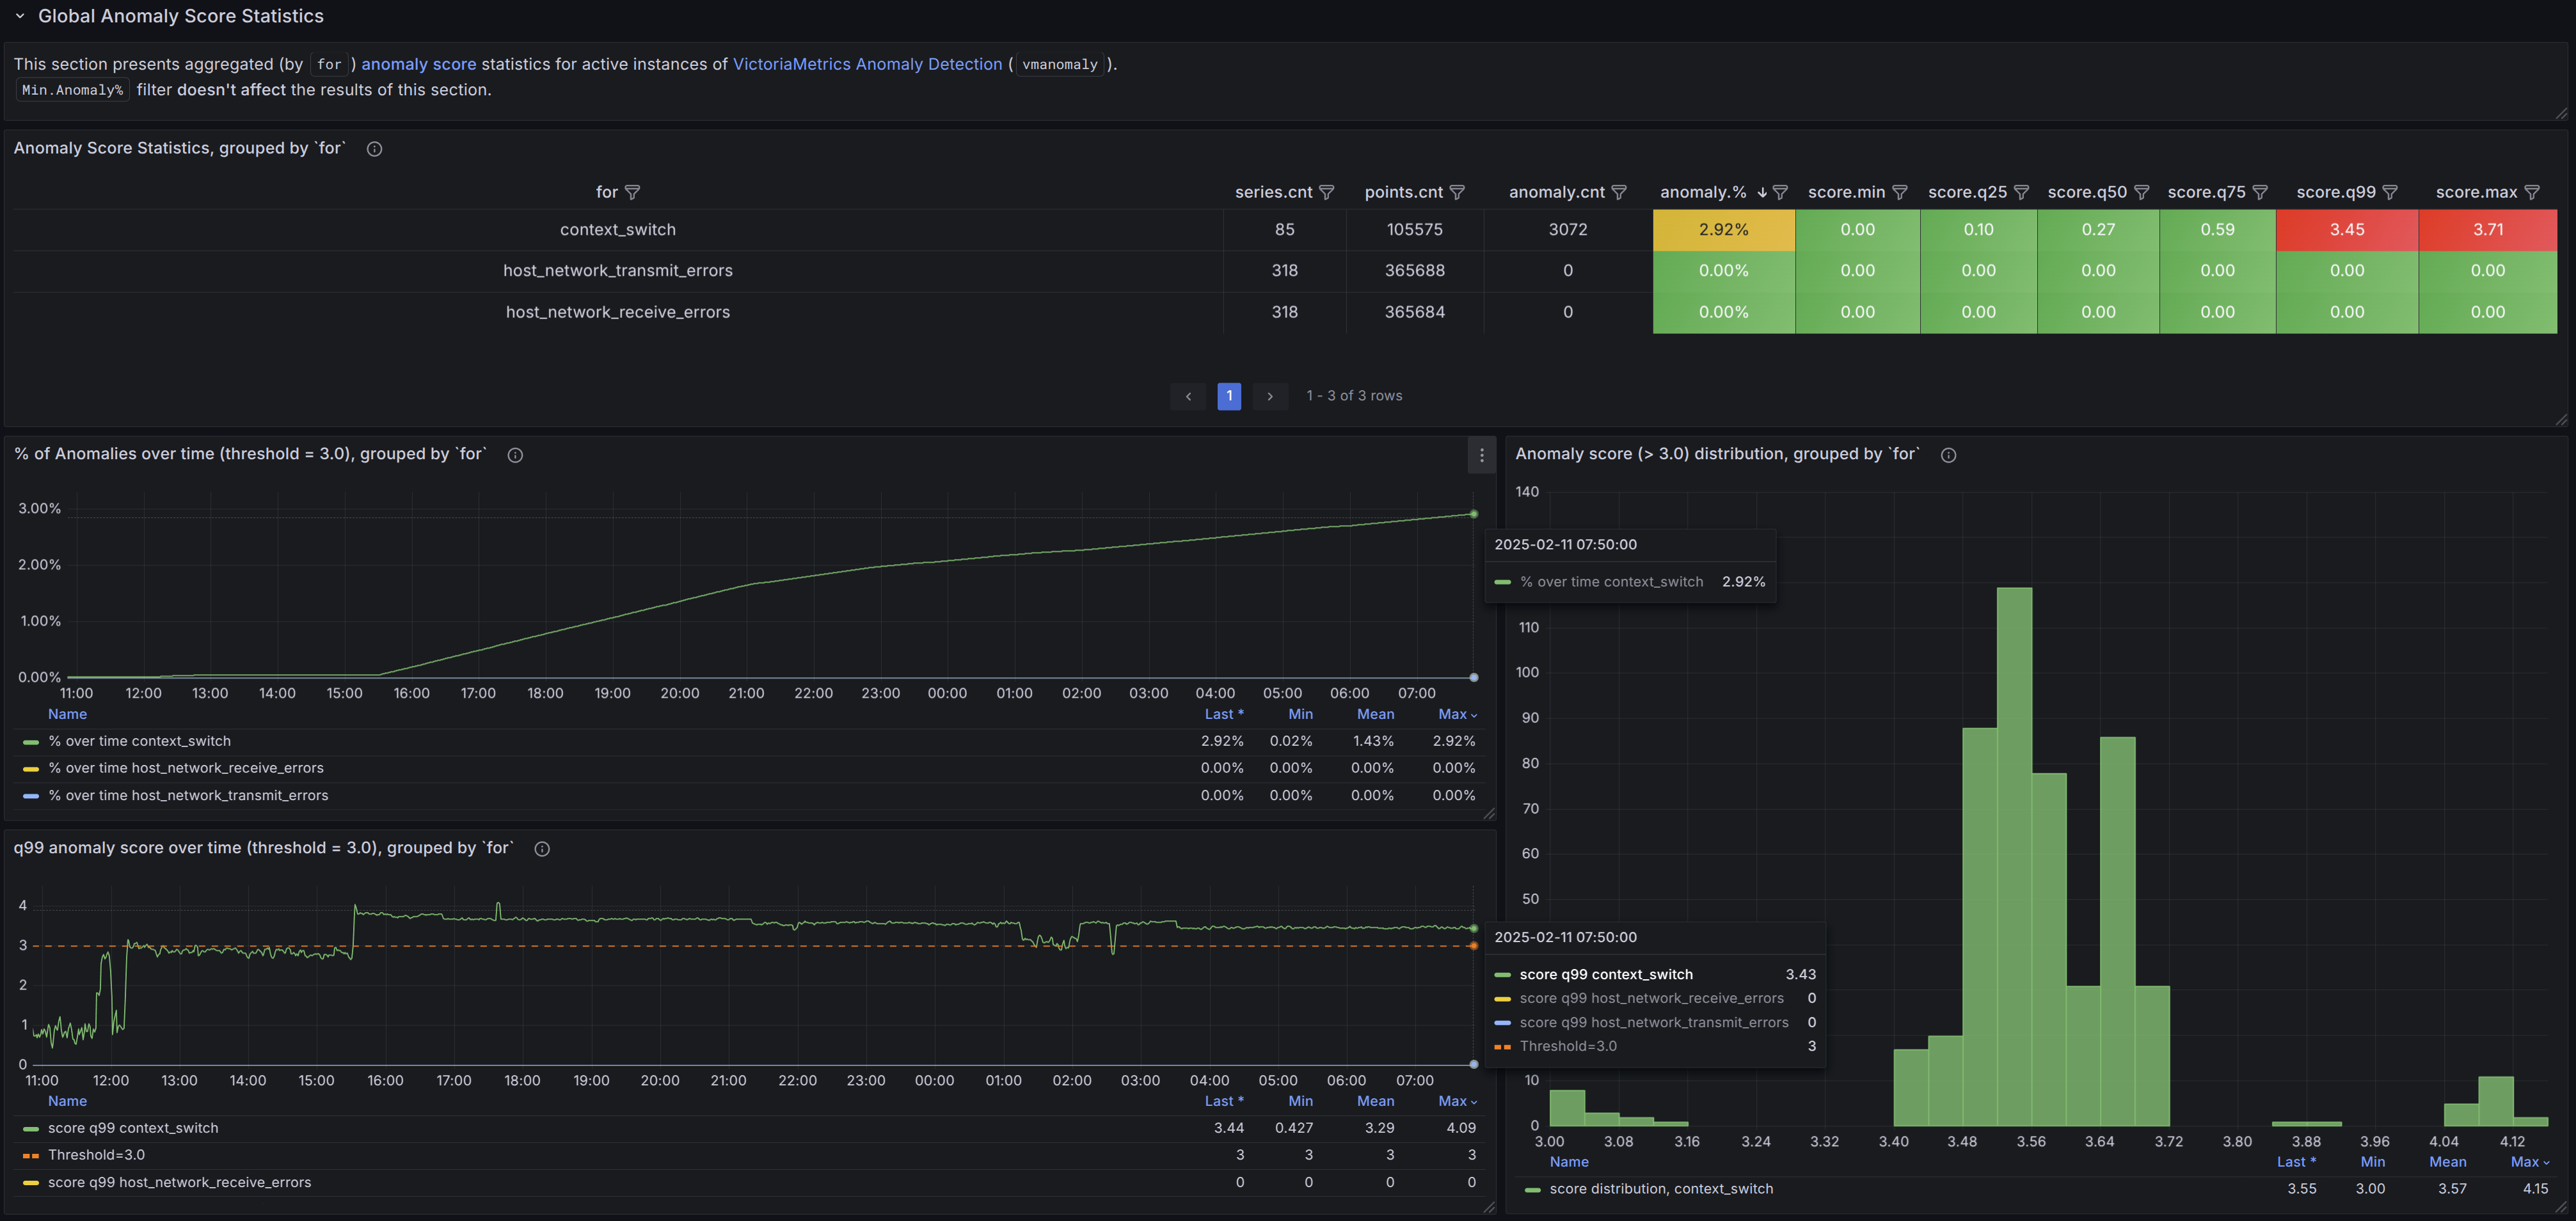
In addition to the existing self-monitoring dashboard for vmanomaly as a service, we released a Grafana dashboard for anomaly exploration with respective usage guidance. Now new deployments can have a pre-made dashboard to observe both global and per-metric anomaly statistics or act as a base for dashboard adaptation to specific needs.

vmanomaly Grafana dashboard overview

Public Playground

#

As vmanomaly is an enterprise-only product, we wanted to provide an easier way for users to try it out without having to get a license and setting up a full enterprise environment. Thus, we launched a public playground where users can experiment with vmanomaly using demo data, which is taken from our own playgrounds for metrics, logs and traces. respectively. This allows users to explore most of the features and capabilities of vmanomaly in a hands-on manner.
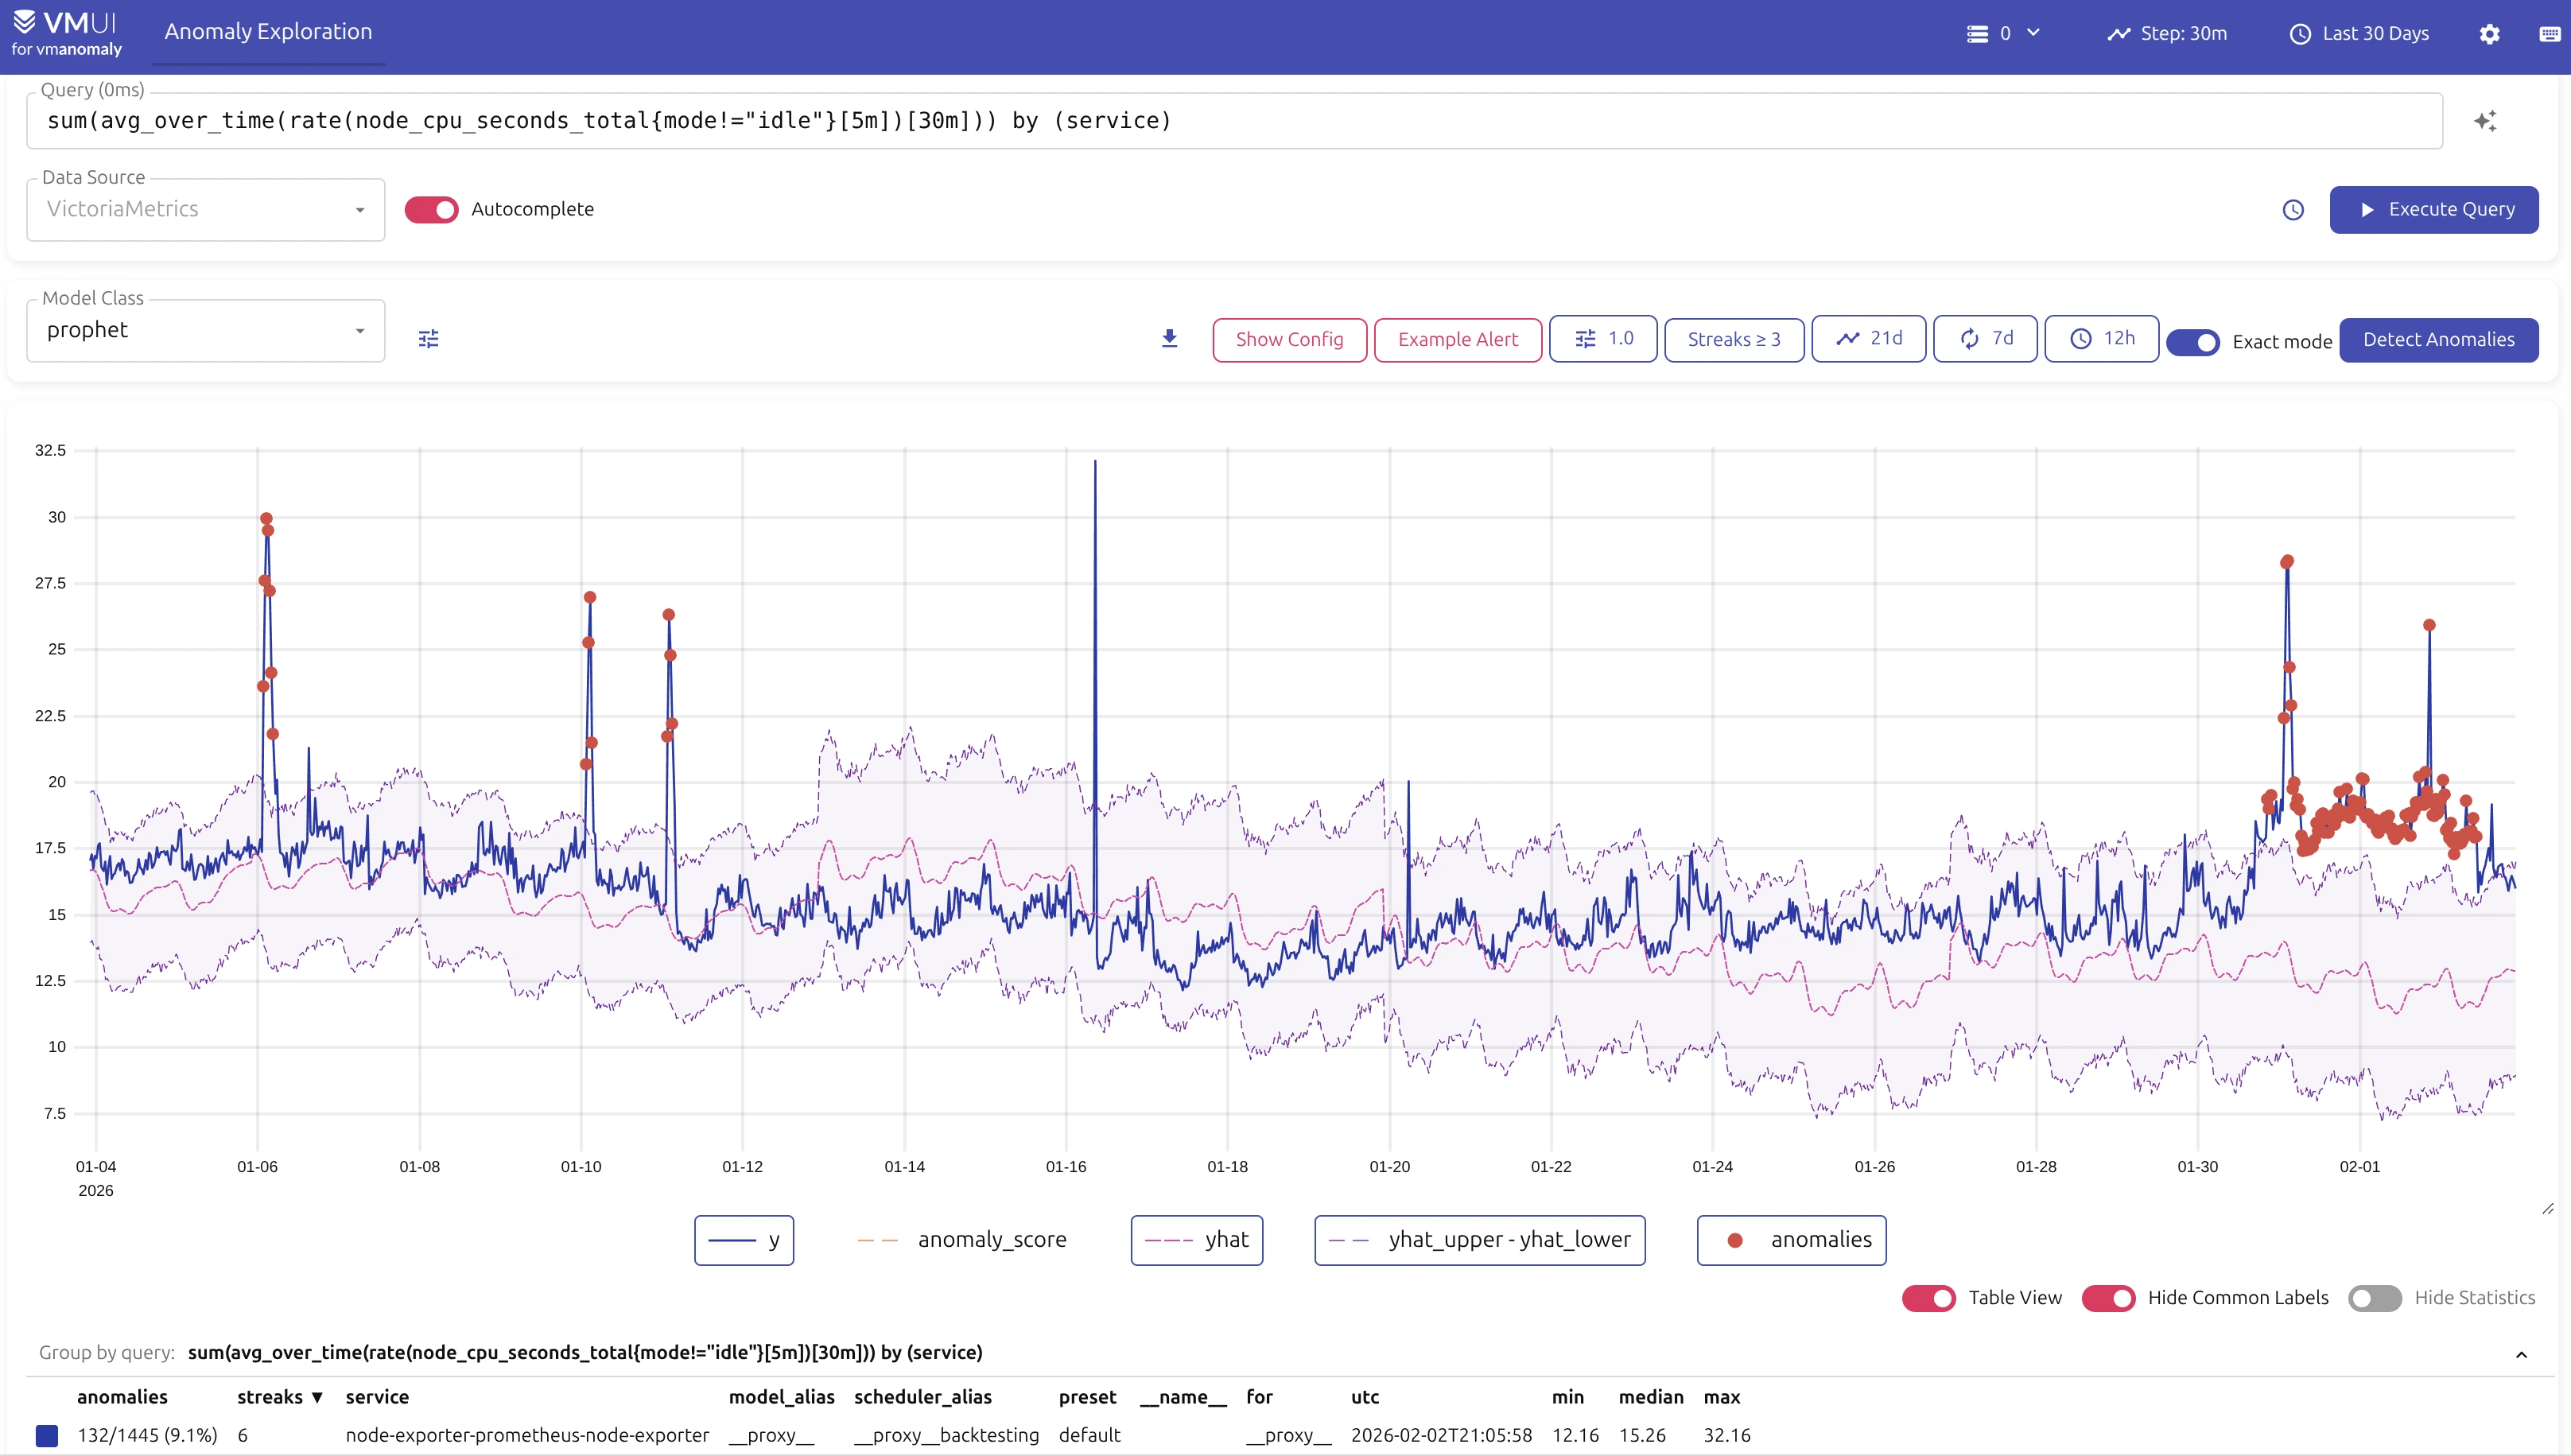
vmanomaly public playground

Playground links (differs in /metrics/, /logs/, /traces/ paths):

MCP Server

#

On the back of the successful integration of VictoriaMetrics with MCP, we released the MCP server for vmanomaly which provides AI-assisted interaction for users. It can help with various tasks related to vmanomaly, including but not limited to:

  • Configuration generation: Generate initial configuration files based on user requirements and best practices. Also, it can be used to fix issues in pasted configs with config validation tool.
  • Alerting rule suggestions: Suggest and validate alerting rules based on user-defined criteria.
  • Migration assistance: Analyze existing configurations and provide recommendations for migrating to newer versions of vmanomaly.
  • Service health checks: Diagnose common issues and suggest fixes based on metrics from vmanomaly instances.
  • Documentation and learning: Answer questions about vmanomaly features, usage, and best practices like incorporating domain knowledge, with full-text search over integrated official docs.
  • Version used: Find out which version of vmanomaly and its UI is being used in your setup by simply querying the MCP server.

Here is an example output from interaction with MCP server for config suggestions based on user requirements:
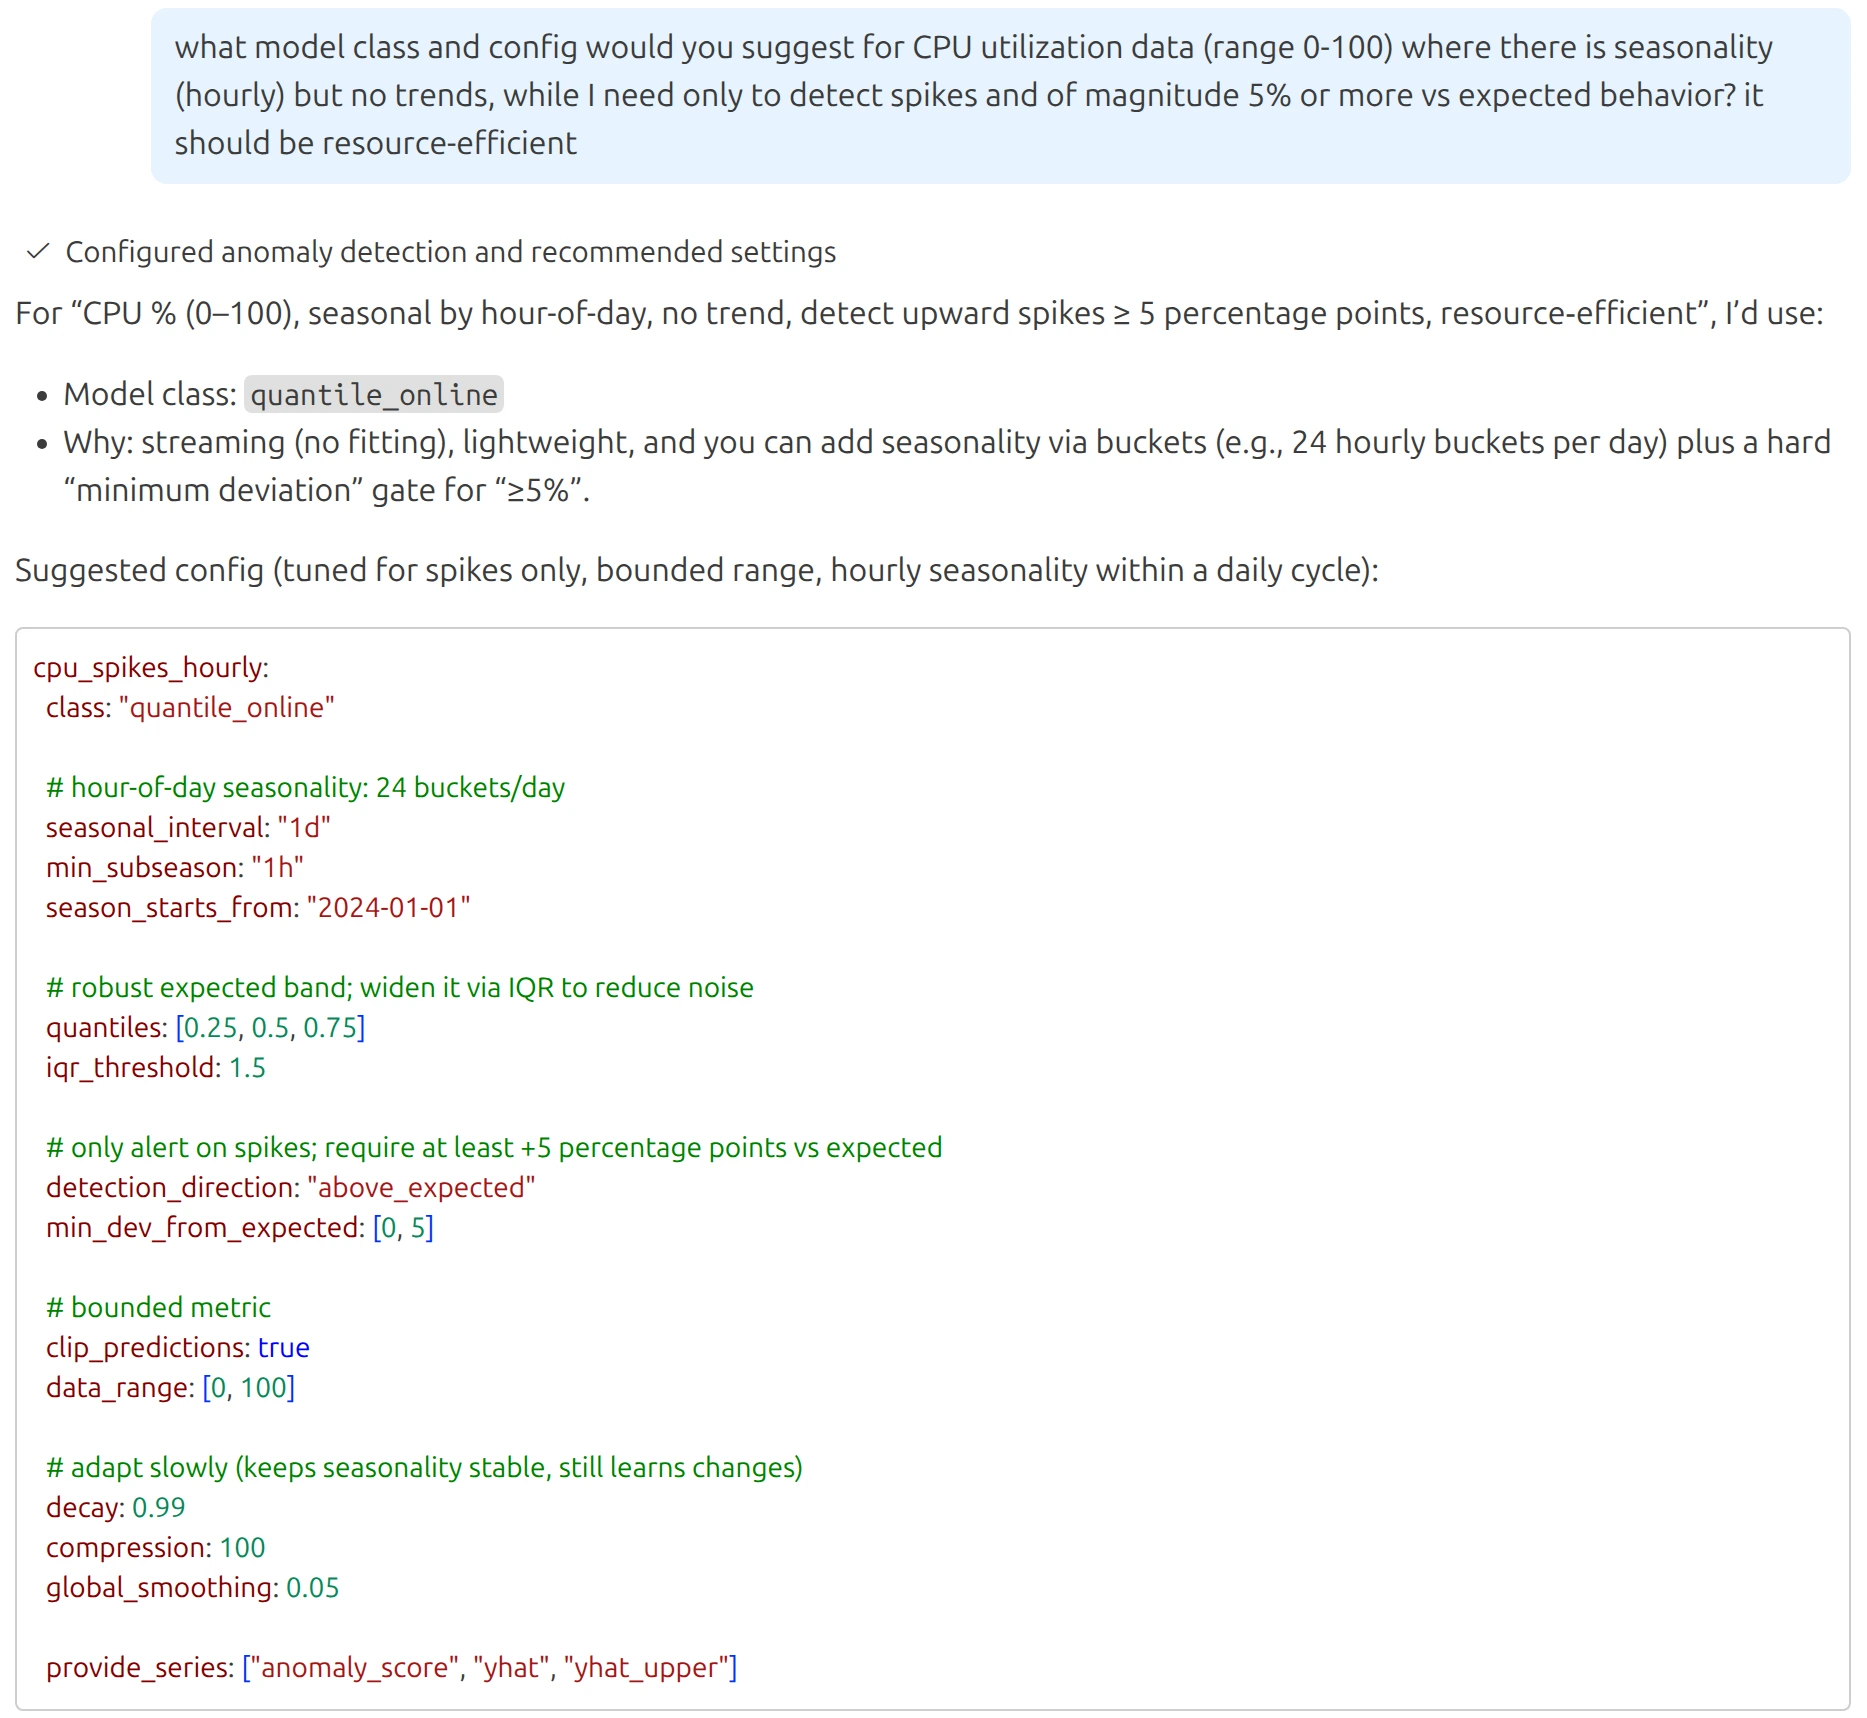
vmanomaly MCP server example interaction

Forecasting Mode

#

Well, now it is really the last point before the wrap-up and future plans - forecasting mode was added to complement existing anomaly detection models. It allows users to generate future data points at current timestamps based on historical behavior, which can be useful for capacity planning, trend analysis, and proactive monitoring, where alerting rules can be enriched with forecast metrics.

What’s Next?

#

We have a lot of plans for 2026, including but not limited to:

  • Chat-like interaction inside the UI with MCP server for AI-assisted configuration generation and management.
  • New anomaly detection models and improved existing ones for better accuracy and performance.
  • Simplifications in onboarding, management and maintenance of anomaly detection setups.
  • Dynamic presets with metric-subset discovery (e.g. Kubernetes, VictoriaMetrics, node-exporter) and smart AI-assisted artifact generation (configs, alerting rules, etc.)
  • Root-cause analysis for assisted causal incident drill downs.
  • Integration with VictoriaMetrics Cloud for seamless anomaly detection as a service experience.

Stay tuned!


I am Fred Navruzov and have previously worked as a Data Science Lead at Ukrainian and international companies such as Competera, Rozetka, and TiltingPoint. Since 2023, I have been leading the Anomaly Detection team at VictoriaMetrics.