





Monitoring and observability are critical components of modern IT infrastructures, enabling organizations to gain insights into the performance, health, and security of their systems. Agents play a crucial role in gathering and forwarding telemetry from various sources to observability platforms. In this article, we compared the performance and resource usage of Grafana Agent, Prometheus agent mode, and VictoriaMetrics vmagent during metrics collection to help readers make informed decisions when choosing an agent for their monitoring needs.
Agents are lightweight collectors and shippers of telemetry data. While Prometheus provides metrics collection and time series database capabilities in one binary, agents are supposed only to collect and forward metrics to the remote time series database. Agents are expected to use as few resources as possible to make them easier to deploy and scale.
Before getting into testing and comparing the agents, let’s take a look at each of them. We’ll briefly cover the history and features of Grafana Agent, Prometheus Agent Mode, and VictoriaMetrics vmagent.
vmagent was initially released in February 2020 as a part of v1.34.0 release of VictoriaMetrics. Before, VictoriaMetrics users had to use Prometheus to scrape metrics and forward them to VictoriaMetrics cluster installation. Since Prometheus is not only a scraper but also a time series database, it used too many resources for this purpose. This is why vmagent was designed to be a lightweight, easy-to-use, and efficient solution for collecting and forwarding metrics. vmagent is written from scratch, supports pull and push models for collection, and uses Prometheus remote write protocol for shipping metrics.
The first release of Grafana Agent dates back to March 2020. It was created with the same purpose as vmagent: to be a lightweight, easy-to-use, and efficient solution to collect and forward metrics to Grafana Cloud. It is based on Prometheus source code but strips out the unnecessary parts of the Prometheus as a database and only leaves the essential parts for metrics collection and forwarding. Grafana Agent WAL implementation is based on the Prometheus WAL, but it is optimized for the agent mode.
As of now, the Grafana Agent can gather metrics, logs, traces, and profiles.
Prometheus Agent Mode was announced in November 2021, the first release with support of agent mode is 2.23.0-beta.0. It was a new mode for Prometheus server which allows to collect and forward metrics to another metrics receiver without storing them to local storage.
Agent mode tunes the Prometheus server to be more efficient for the single purpose of collecting and forwarding metrics, disabling parts of the server not needed for this purpose. Notably, the storage is disabled in agent mode, and instead, it uses a customized TSDB WAL. This custom WAL, crucial for the agent mode’s efficiency, was donated by Grafana Labs after being thoroughly tested within the Grafana Agent.
In order to compare the performance and resource usage of Grafana Agent, Prometheus Agent Mode, and VictoriaMetrics' vmagent, we conducted a series of tests in a controlled environment. The tests were designed to measure the CPU usage, memory footprint, network bandwidth, and other relevant metrics under various scenarios. The results were analyzed to provide a comparative view of the agents’ performance and resource usage.
We’ve used our prometheus benchmark as a load generator for the tests. It is a tool that uses node_exporter to generate realistic load for Prometheus-like systems. Prometheus benchmark was configured to expose metrics for 5000 hosts with 1% of hosts changing every 10 minutes to emulate churn rate. All agents were configured to forward metrics to the separate remote destination, a single-server instance of VictoriaMetrics. Benchmarks were running for 12 hours in each scenario.
Here is a diagram describing the benchmark setup:
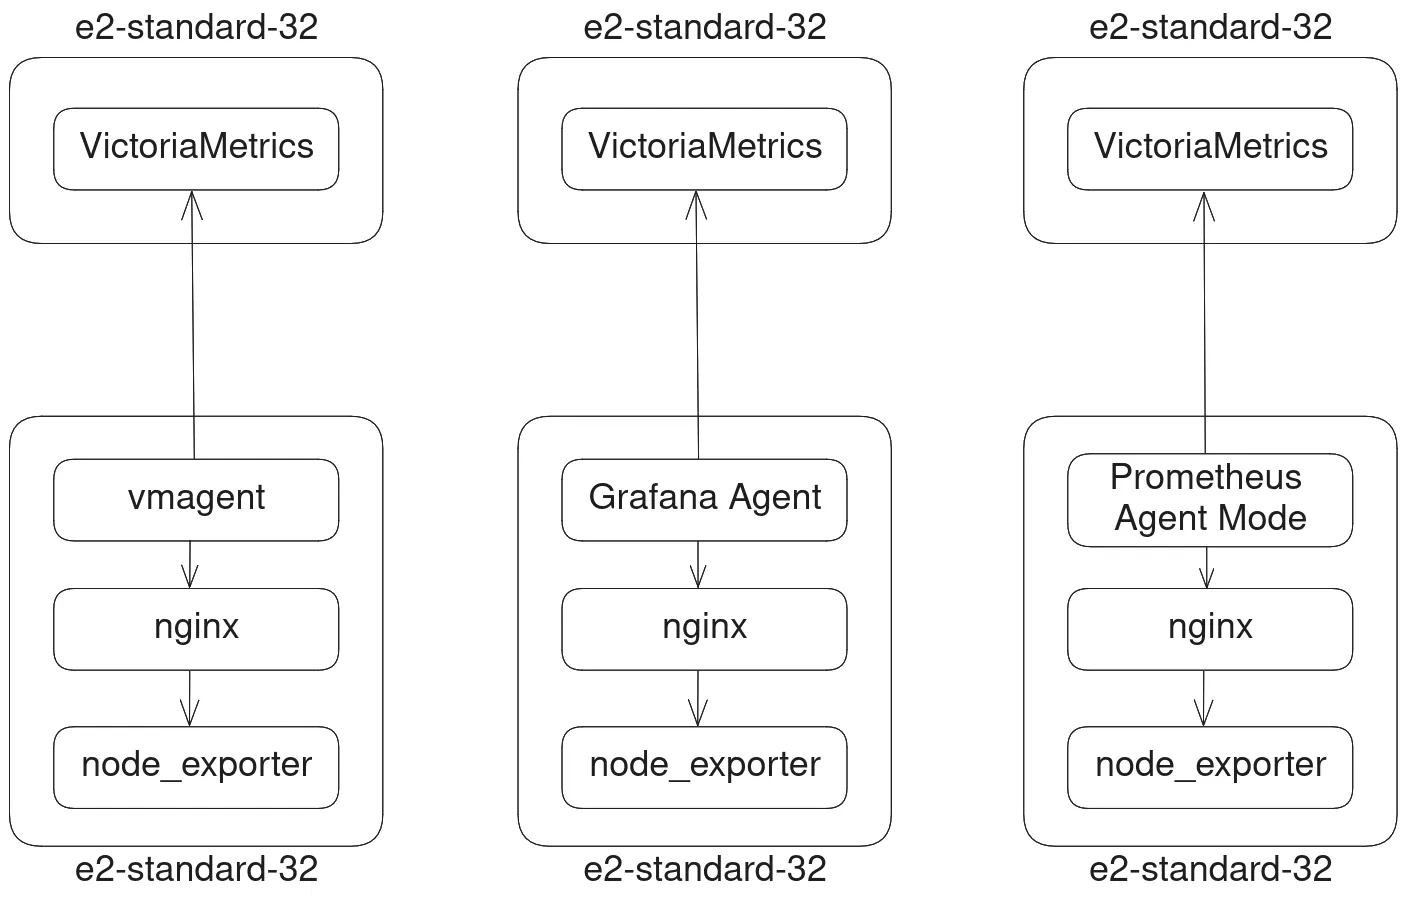 Diagram of the benchmark architecture.
Measurements that we would like to compare:
Versions of the components used in the tests:
Resource limits for the tests:
The following configuration options were provided to the agents:
storage.agent.retention.max-time = 2hstorage.agent.retention.min-time = 5mwal_truncate_frequency = 30mmax_wal_time = 2hmin_wal_time = 5mremoteWrite.maxDiskUsagePerURL = 50GiBWe have chosen two scenarios for the tests:
In the first case we’ve simulated a regular operation when the remote target was available.
Here are the graphs of resource usage for the first case:
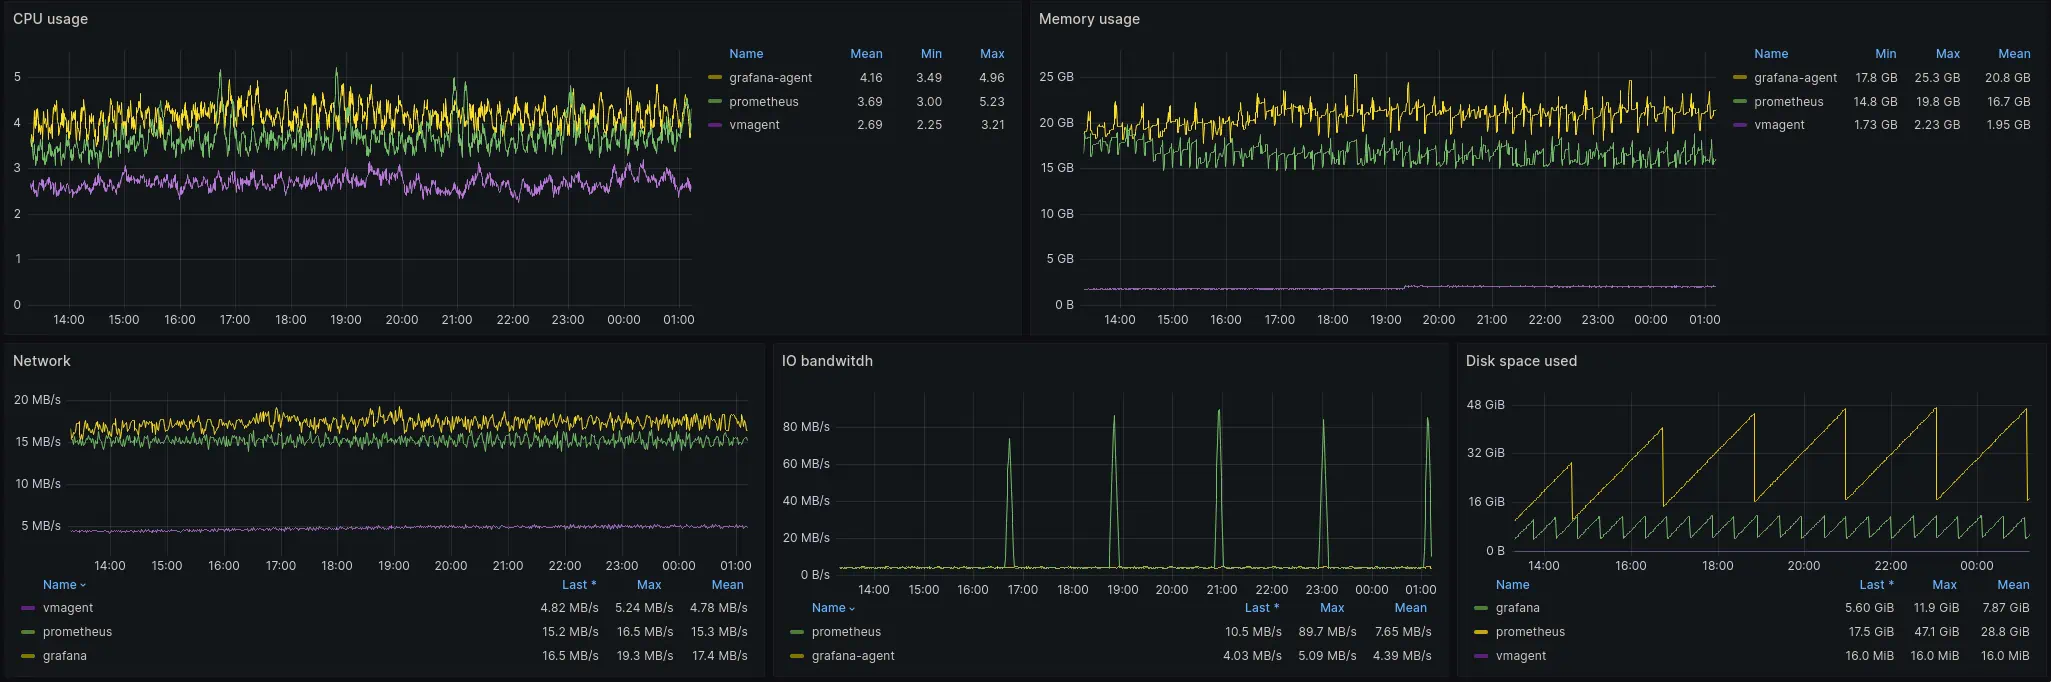 CPU, Memory, network and IO resources usage graphs
See the snapshot of the dashboard here.
Let’s check resource usage for each resource separately.
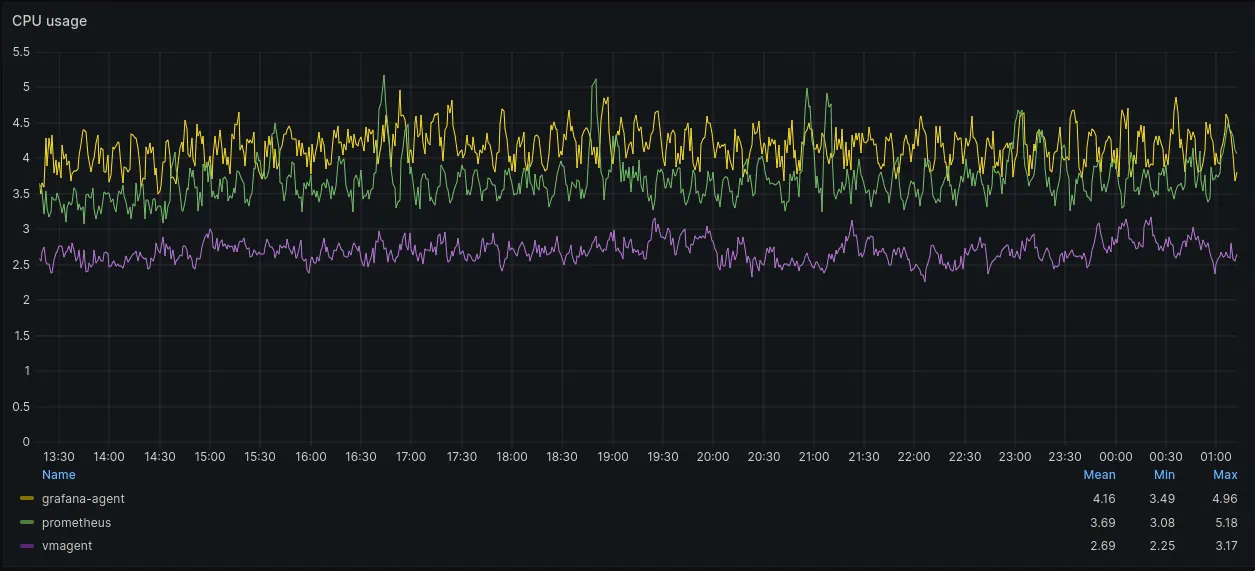 CPU usage graph
During normal operations CPU usage of agents was comparable. Mean CPU usage for vmagent was around 2.69 cores, Grafana Agent it was 4.16 cores and for Prometheus it was 3.69 cores.
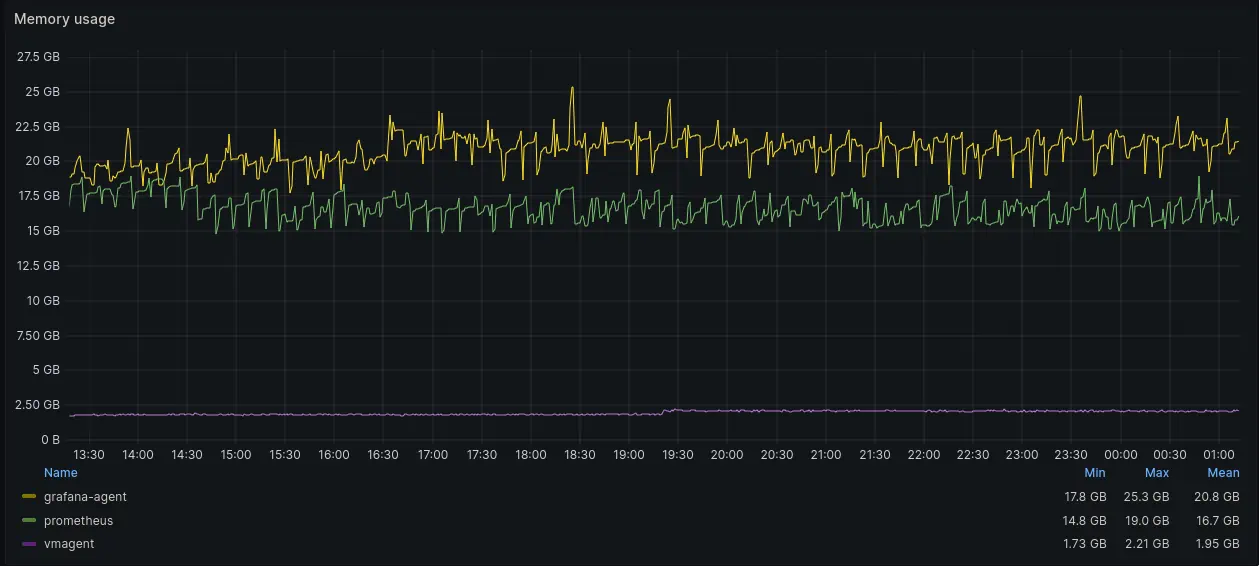 Memory usage (RSS) graph
Memory usage (RSS) of vmagent was significantly lower (see the purple line at the bottom) than memory usage of Grafana Agent or Prometheus Agent. Max memory usage for vmagent was around 2.2GB, while max memory usage for Grafana Agent was 25.3GB and for Prometheus Agent it was 19GB. It is likely, vmagent has significantly lower memory requirements due to support of stream parsing mode.
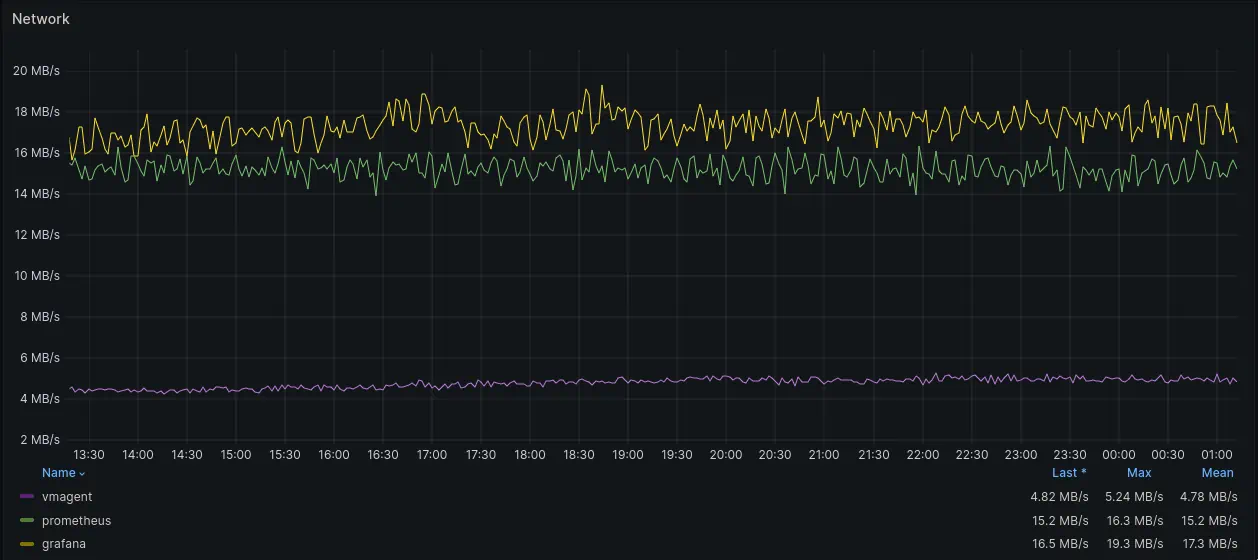 Network bandwidth usage graph
Network usage of Prometheus Agent was slightly higher than network usage of Grafana Agent, 15.2MB/s and 17.3MB/s respectively. vmagent network usage was several times lower (4.78MB/s on average) than network usage of Grafana Agent and Prometheus Agent.
vmagent uses an enhanced version of Prometheus remote write protocol - VictoriaMetrics remote write protocol. This protocol uses a different compression algorithm, which allows for a significant reduction in network usage - around 4 times less than Prometheus Agent and Grafana Agent. Currently, it is only supported by VictoriaMetrics. vmagent detects if the remote receiver is VictoriaMetrics and enables compression only in this case. This is especially useful in multi-AZ deployments where traffic costs between AZs can be a significant part of the operational costs.
Adding support for this protocol to other TSDBs and agents could reduce network usage for remote writing metrics across the monitoring stacks. Prometheus is already evaluating adding support of a different compression algorithm as a part of remote write protocol enhancements targeted for the next major release.
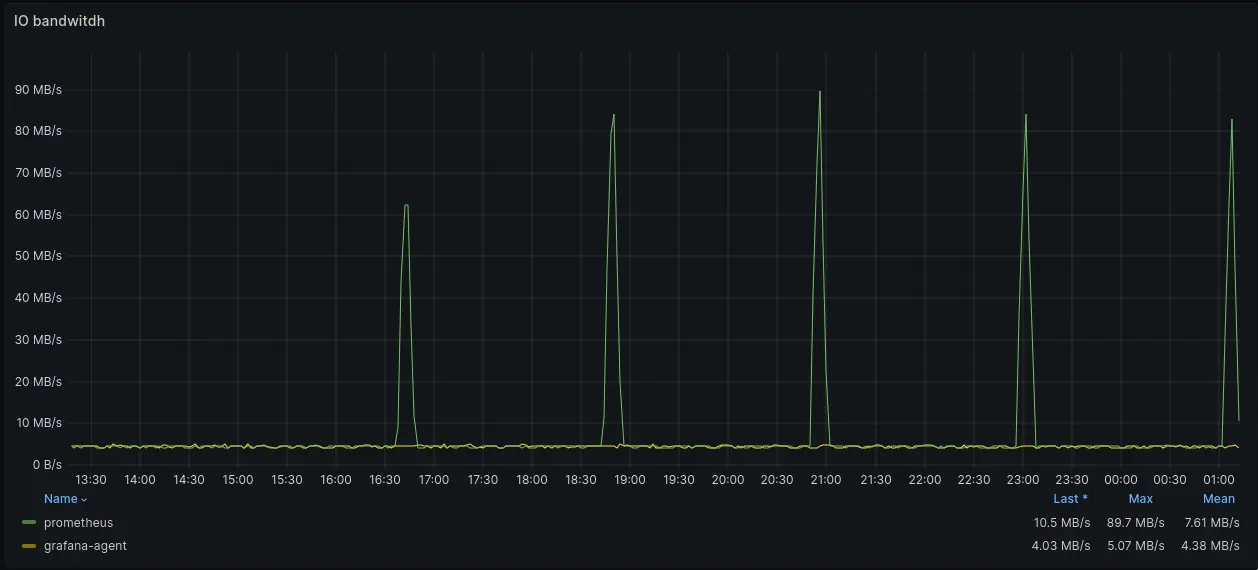 IO bandwidth usage graph
When it comes to disk bandwidth usage, vmagent wasn’t using disk at all. This is caused by queue implementation in vmagent which allows to buffer data in memory in case the destination database is able to keep up with the incoming data. In case the destination database is down or can’t keep up with the ingestion rate, vmagent will buffer data on disk.
Prometheus’ disk usage has noticeable spikes every 2 hours when it performs compaction and WAL truncation. Mean disk bandwidth usage of Prometheus Agent was 7.61MB/s with spikes up to 89.7MB/s.
Grafana Agent used 4.38MB/s on average. Apparently, Grafana Agent uses similar to vmagent optimization to not flush data on disk if remote receiver can keep up with load.
Here is a table with the mean values of resource usage for each agent:
| Agent | CPU (cores) | Memory (GB) | Network (MB/s) | Disk (MB/s) |
|---|---|---|---|---|
| vmagent | 2.69 | 2.2 | 4.78 | 0 |
| Prometheus Agent | 3.69 | 19 | 15.2 | 7.61 |
| Grafana Agent | 4.16 | 25.3 | 17.3 | 4.38 |
In this test we’ve simulated a situation when the destination database is unavailable. This is a common situation when the remote target is down for maintenance or due to network issues. Agents are expected to continue collecting metrics and buffering them until the remote target becomes available again.
Here are the graphs of resource usage for the first case:
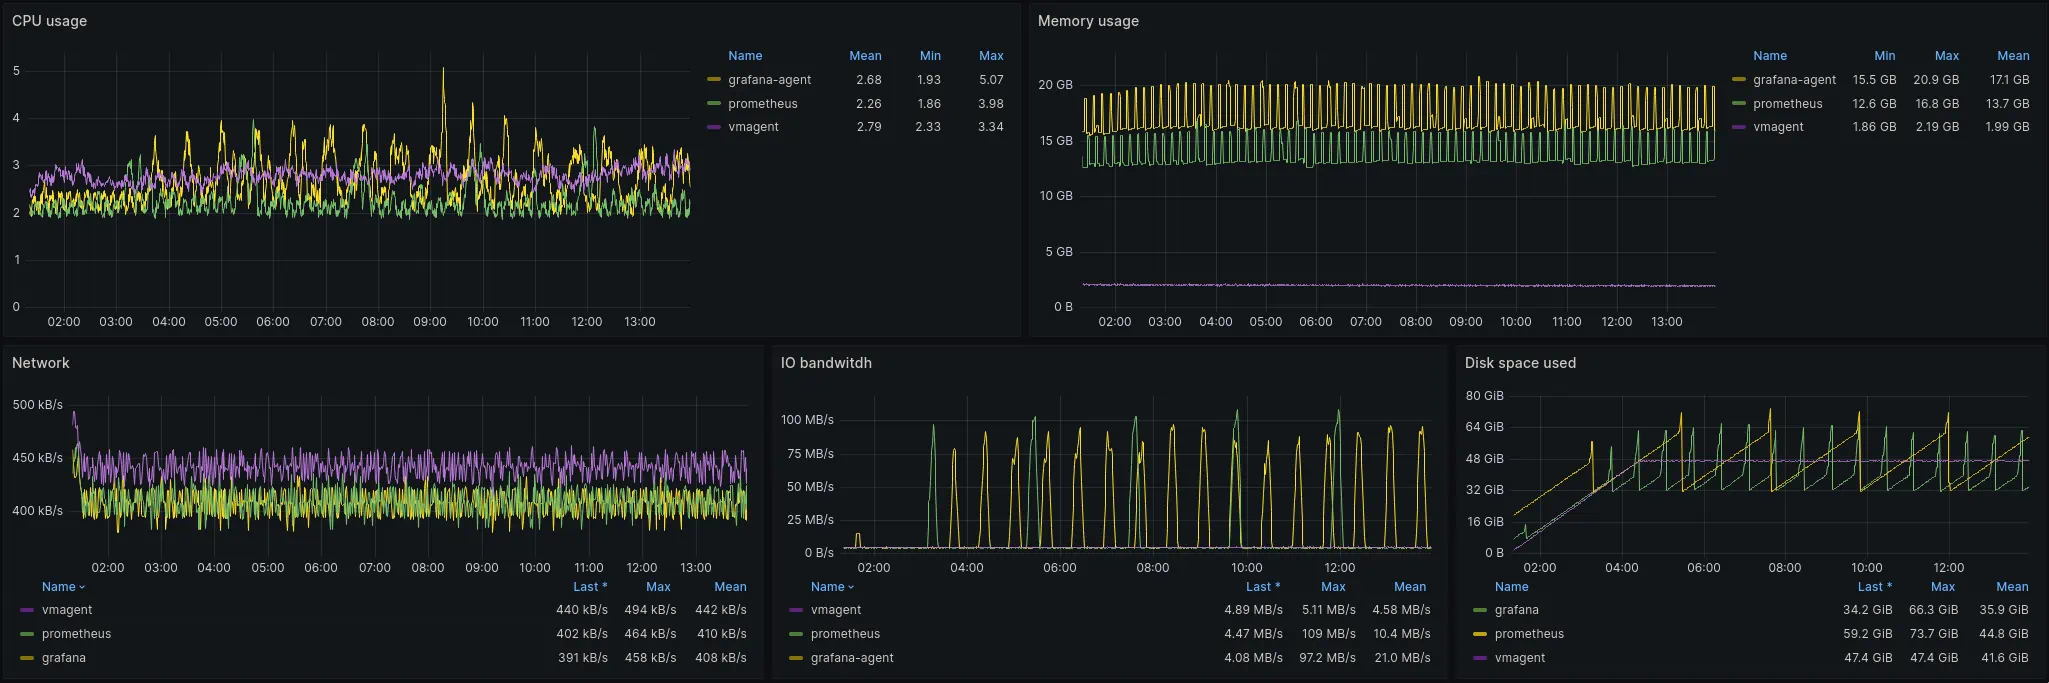 CPU, Memory, network and IO resources usage graphs
See a snapshot of the dashboard here.
Let’s check resource usage for each resource separately.
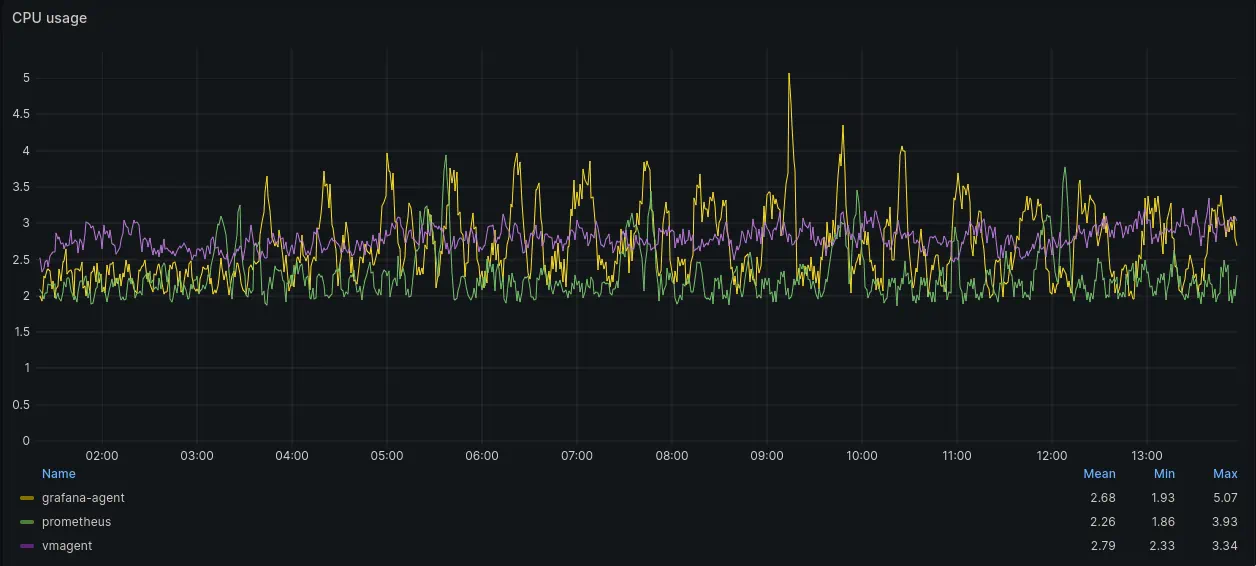 CPU usage graph
CPU usage of all three agents was similar. In fact, Prometheus and Grafana Agents has lower CPU usage in this test with unavailable remote receiver than in previous test when receiver was up&running.
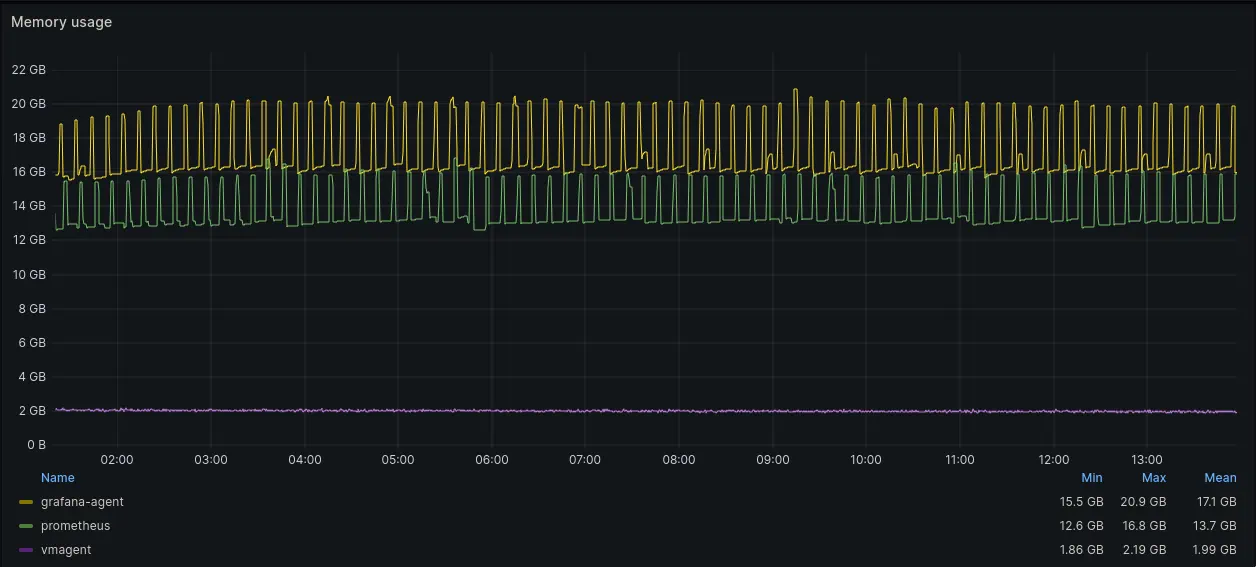 Memory usage graph
Mean memory usage (RSS) of Grafana Agent was 30% higher than memory usage of Prometheus agent. vmagent memory footprint was significantly lower and hasn’t changed since the previous test. It is notable that both Grafana Agent and Prometheus Agent memory usage fluctuated every 10 minutes, while vmagent memory usage was stable. These spikes correlate with the frequency of churn rate in the benchmark setup.
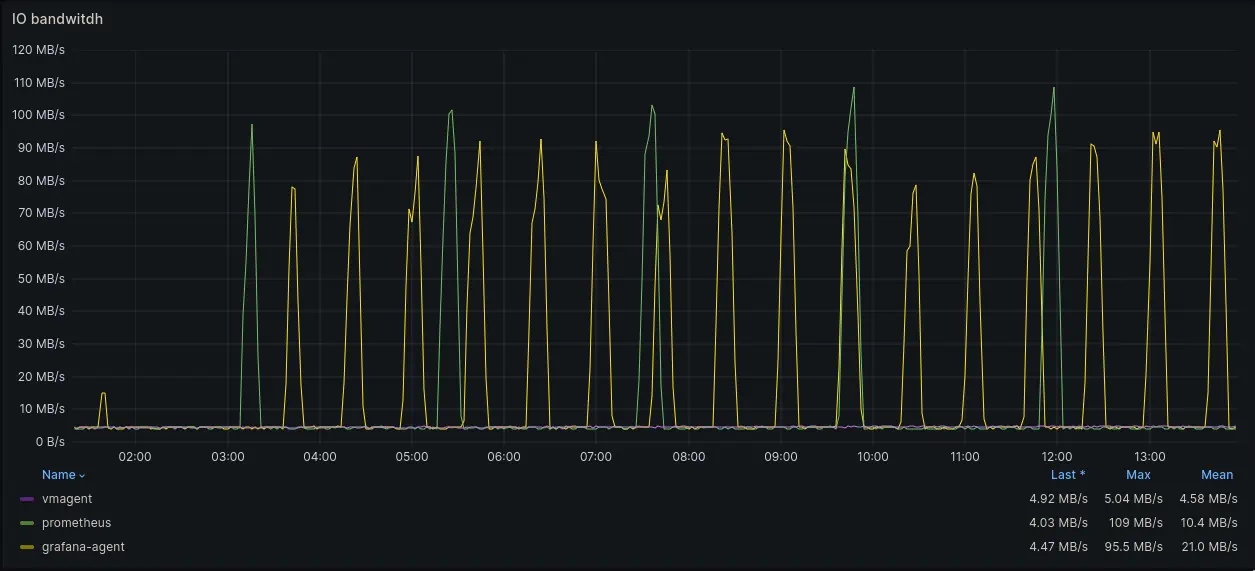 IO usage graphs
Mean disk bandwidth usage of agents was:
Different queue implementations in agents are causing different disk bandwidth usage patterns.
Grafana Agent allows to configure WAL truncation frequency. In our tests we’ve set it to 30 minutes. This allowed to reduce maximal disk usage because of more frequent truncation of WAL. However, it also caused more frequent disk usage spikes. Spikes were using up to 95.5MB/s of disk bandwidth.
Prometheus Agent does not allow to configure WAL truncation frequency. It truncates WAL every 2 hours by default which is noticeable on the graphs. Spikes were using up to 100.9MB/s of disk bandwidth.
vmagent’s persistentqueue package stores data in compressed blocks of 512MB size and removes oldest blocks once the
total size of blocks exceeds the configured limit. This allows to keep resource usage more linear.
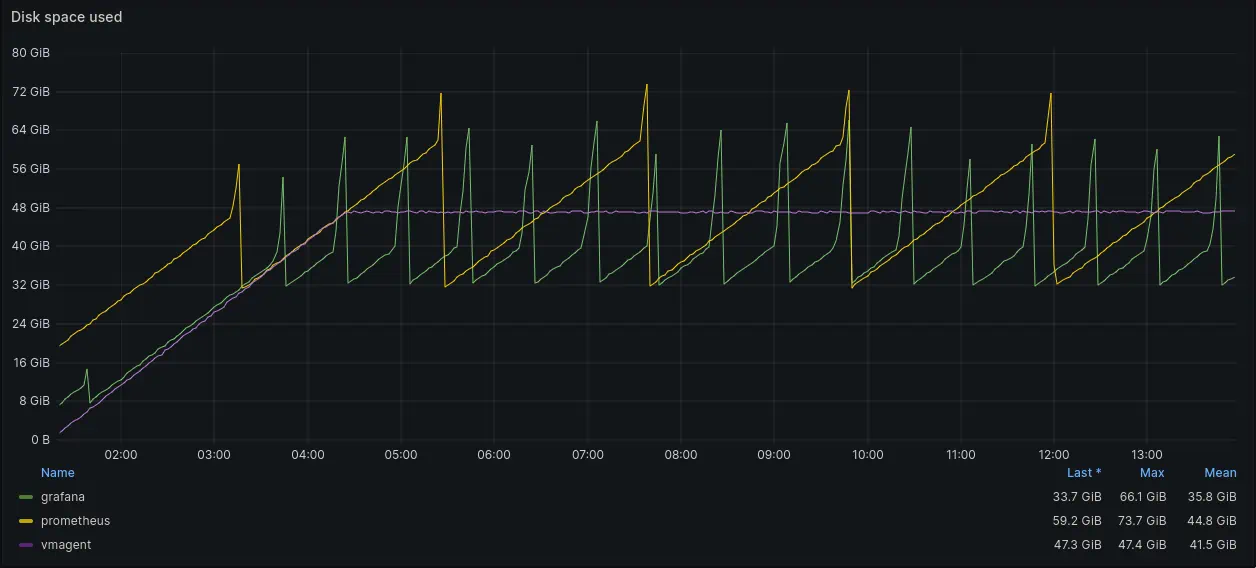 Disk space usage graph
Difference in queue implementation is also very well noticeable on the disk space usage graph. Grafana Agent and Prometheus Agent disk usage fluctuated when WAL truncation occurred. vmagent disk usage was stable and linear.
Here is a table with the mean values of resource usage for each agent:
| Agent | CPU (cores) | Memory (GB) | Network (KB/s) | Disk (MB/s) |
|---|---|---|---|---|
| vmagent | 2.68 | 1.99 | 442 | 4.58 |
| Prometheus Agent | 2.26 | 13.7 | 410 | 10.4 |
| Grafana Agent | 2.79 | 17.1 | 408 | 21.0 |
After comparing the performance and resource usage of agents we wanted to compare the performance and resource usage of using Prometheus and VictoriaMetrics TSDB and agent stacks. In this round we’ve used the benchmark setup with 5000 hosts emitting metrics, but data was written to Prometheus and VictoriaMetrics TSDBs. Remote receivers were only processing the ingestion load, no read queries.
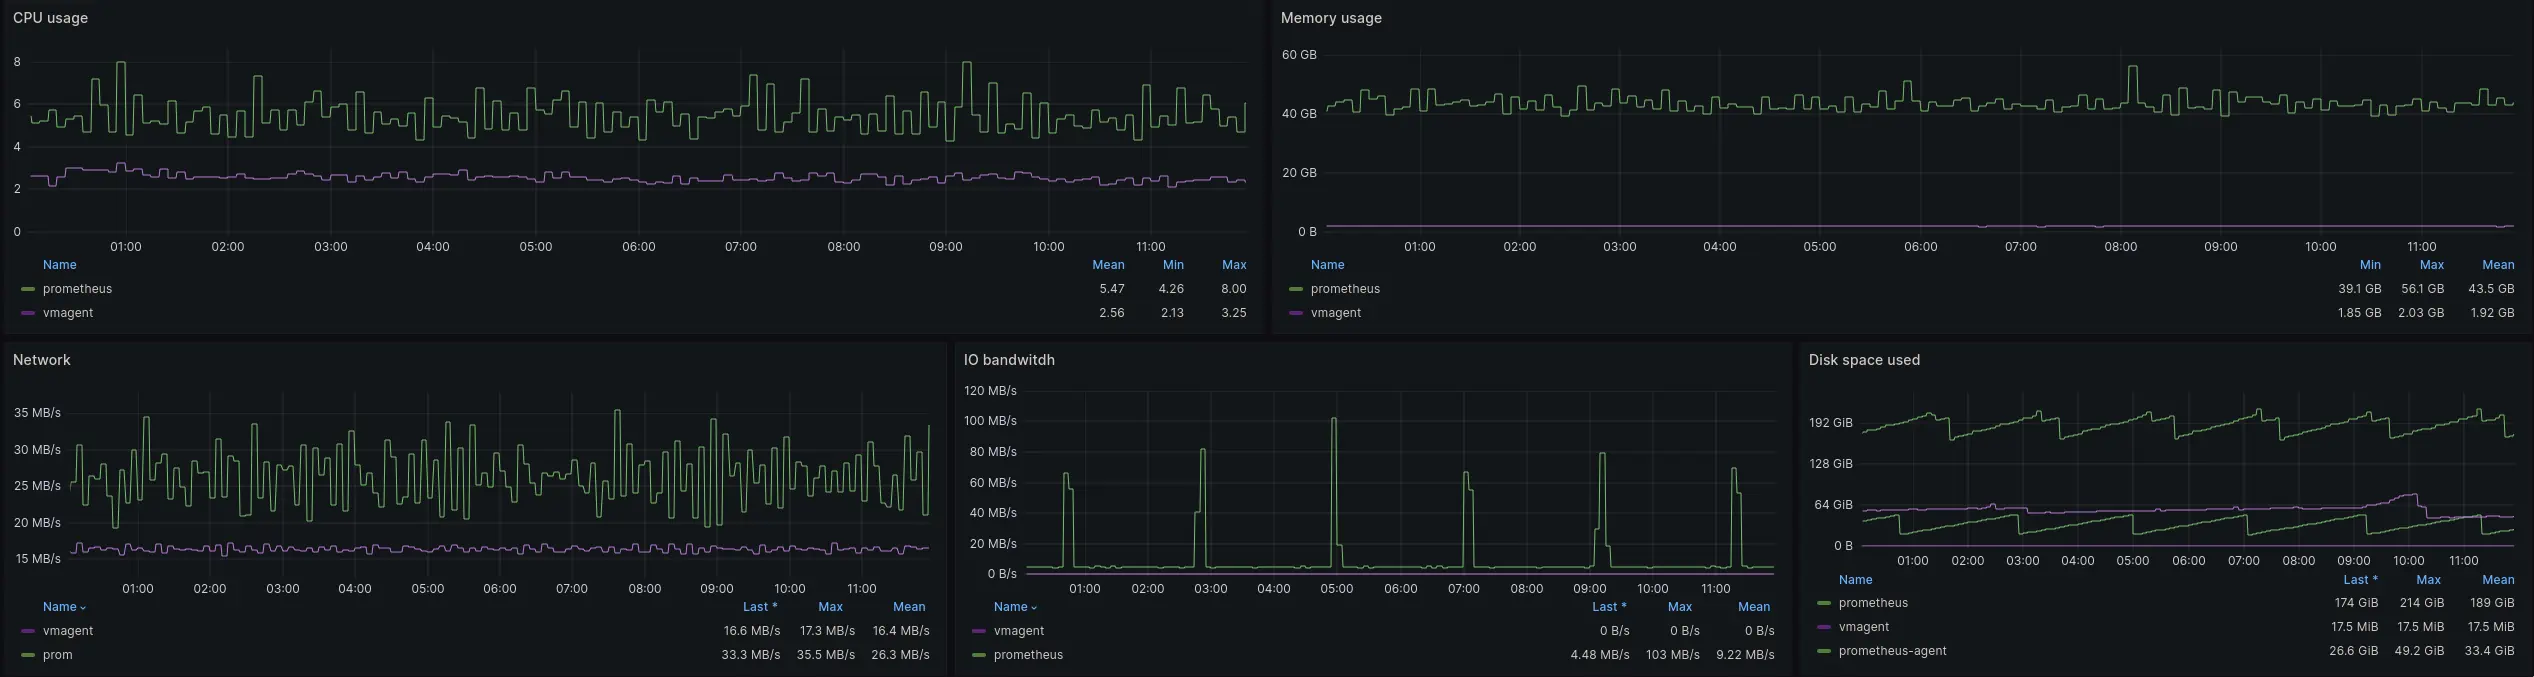 CPU, Memory, network and IO resources usage graphs for agents
Agents resource usage was similar to the result of previous tests. vmagent was using less CPU and memory compared to Prometheus agent.
Here is the resource usage of TSDBs:
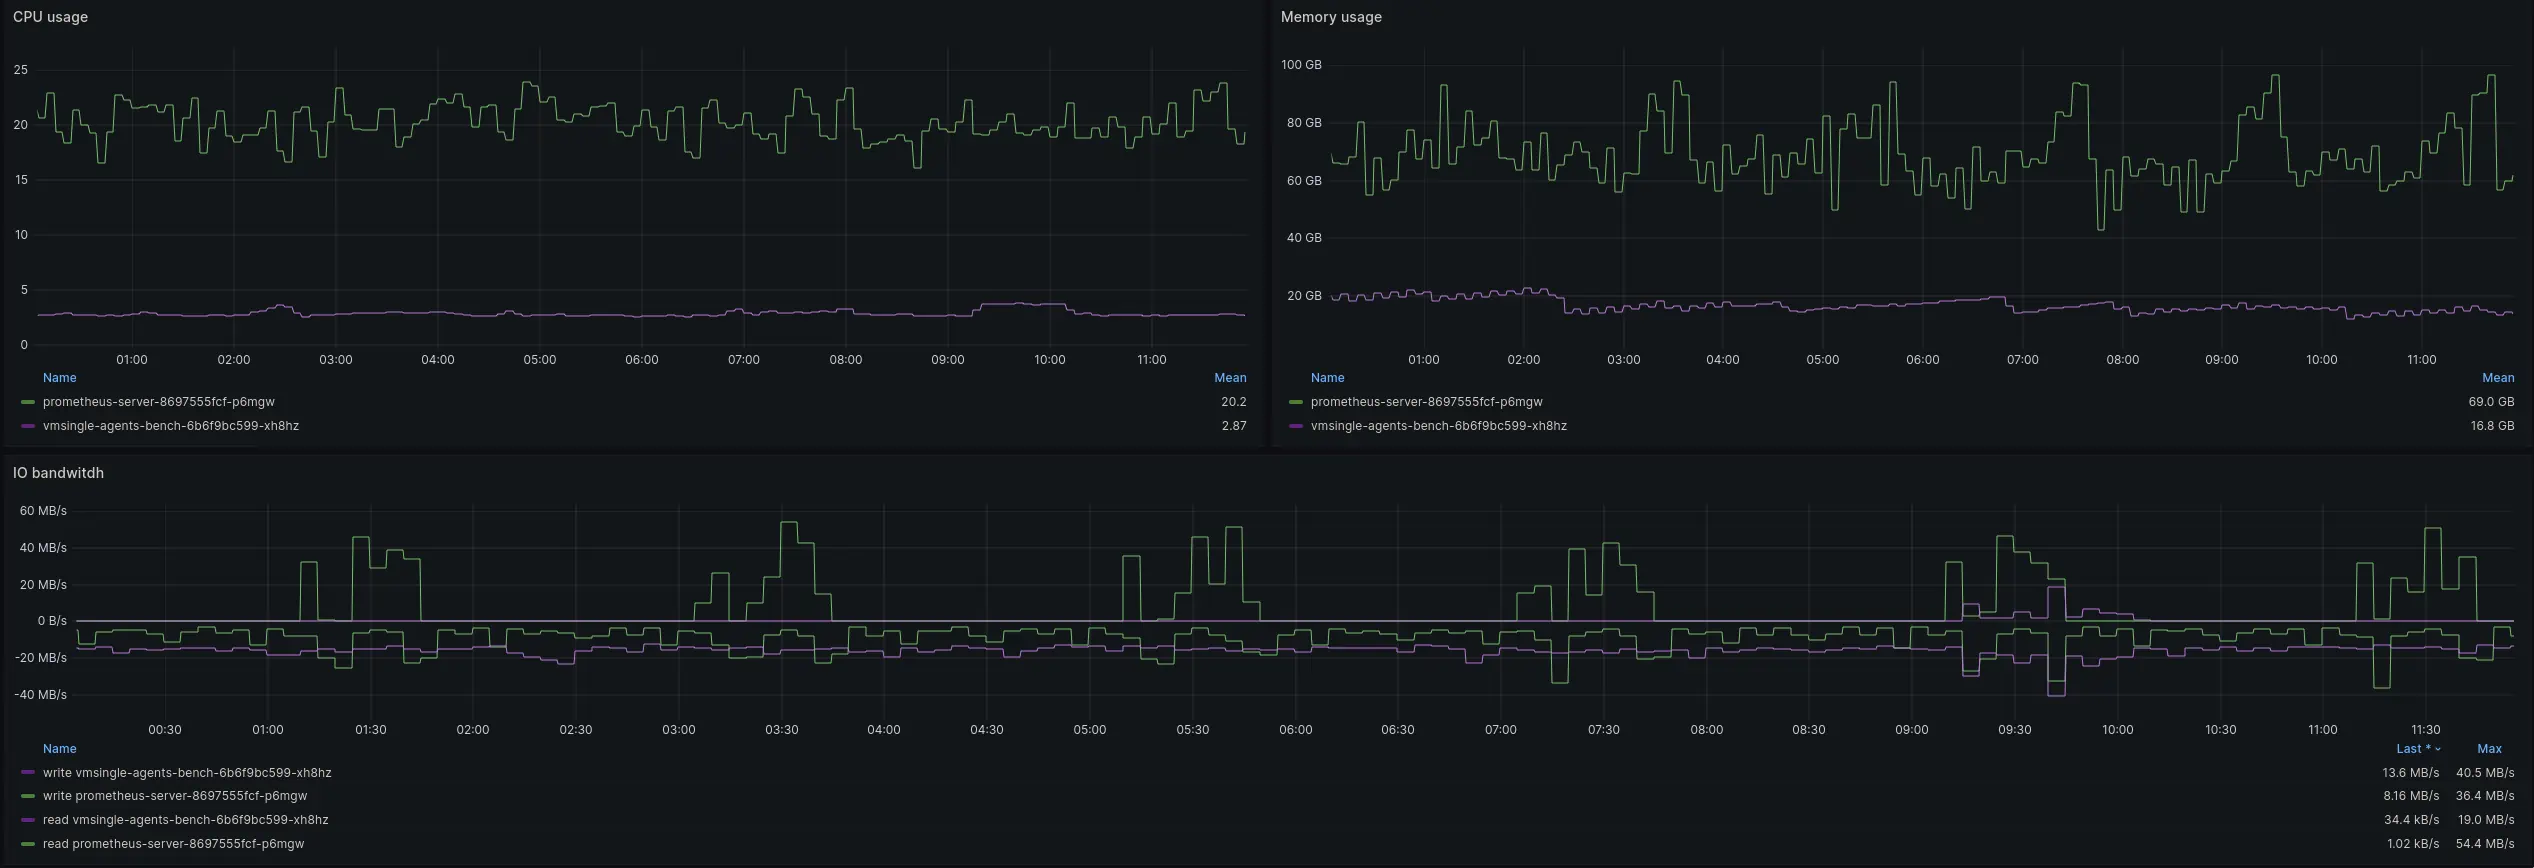 CPU, Memory, network and IO resources usage graphs for VictoriaMetrics and Prometheus receivers
Mean CPU usage of VictoriaMetrics was 7x times lower than CPU usage of Prometheus (2.87 and 20.2 cores respectively). Memory usage (RSS) of VictoriaMetrics was 4x times lower than memory usage of Prometheus (16.8GB and 69.0GB). It’s also noticeable that VictoriaMetrics resource usage pattern was more stable. Prometheus had noticeable spikes in resource usage which were caused by compaction and WAL truncation processes that happened once per two hours. VictoriaMetrics storage uses different storage engine which allows to smooth resource usage.
Using the right agent for your monitoring needs is crucial for the performance and resource usage of your monitoring stack. In this article, we compared the performance and resource usage of Grafana Agent, Prometheus Agent, and VictoriaMetrics vmagent.
Note that vmagent is compatible with any database that accepts the Prometheus remote write protocol. This means that you can use vmagent to immediately reduce the amount of resources required for scraping and remote writing metrics in your monitoring stack. Check out quick start guide and try it on your own workloads to compare the performance and resource usage of vmagent with your current setup.
此内容由惯性聚合(RSS阅读器)自动聚合整理,仅供阅读参考。 原文来自 — 版权归原作者所有。