

惯性聚合 高效追踪和阅读你感兴趣的博客、新闻、科技资讯
阅读原文 在惯性聚合中打开

推荐订阅源

Google Online Security Blog
freeCodeCamp Programming Tutorials: Python, JavaScript, Git & More
Stack Overflow Blog
Stack Overflow Blog
GbyAI
GbyAI
Microsoft Azure Blog
I
InfoQ
F
Fortinet All Blogs
N
Netflix TechBlog - Medium
Martin Fowler
Martin Fowler
腾讯CDC
C
CERT Recently Published Vulnerability Notes
博客园 - 聂微东
L
LINUX DO - 热门话题
Y
Y Combinator Blog
H
Hackread – Cybersecurity News, Data Breaches, AI and More
Threat Intelligence Blog | Flashpoint
OSCHINA 社区最新新闻
OSCHINA 社区最新新闻
钛媒体:引领未来商业与生活新知
钛媒体:引领未来商业与生活新知
Microsoft Security Blog
cs.CL updates on arXiv.org
WordPress大学
WordPress大学
C
Cisco Blogs
A
Arctic Wolf
Latest news
Latest news
Jina AI
Jina AI
P
Proofpoint News Feed
博客园 - 叶小钗
Vercel News
Vercel News
T
Threat Research - Cisco Blogs
博客园 - 三生石上(FineUI控件)
K
Kaspersky official blog
C
Check Point Blog
H
Heimdal Security Blog
博客园 - Franky
小众软件
小众软件
The Register - Security
Application and Cybersecurity Blog
Google DeepMind News
AWS News Blog
AWS News Blog
The Hacker News
The Hacker News
T
The Exploit Database - CXSecurity.com
aimingoo的专栏
aimingoo的专栏
Project Zero
Project Zero
G
GRAHAM CLULEY
爱范儿
爱范儿
奇客Solidot–传递最新科技情报
奇客Solidot–传递最新科技情报
Scott Helme
Scott Helme
让小产品的独立变现更简单 - ezindie.com
Exploit-DB.com RSS Feed
NISL@THU
NISL@THU

VictoriaMetrics: Simple & Reliable Monitoring for Everyone on VictoriaMetrics

Operator now has Long-Term Support (LTS) version Multi-tiered Observability: A Practical Way to Handle Diverse Workloads VictoriaMetrics April 2026 Ecosystem Updates Not All Telemetry Requires Premium Pricing VictoriaMetrics at KubeCon Amsterdam: Community Highlights What's new in VictoriaMetrics Anomaly Detection (Q1 2026) What's New in VictoriaMetrics Cloud Q1 2026? Logs, MCP Server, Better Alerting, and... a Secret Project VictoriaMetrics at KubeCon: Optimizing Tail Sampling in OpenTelemetry with Retroactive Sampling VictoriaMetrics March 2026 Ecosystem Updates Observability Lessons From OpenAI Benchmarking Kubernetes Log Collectors: vlagent, Vector, Fluent Bit, OpenTelemetry Collector, and more VictoriaMetrics February 2026 Ecosystem Updates VictoriaMetrics at FOSDEM, Cloud Native Days France, and CfgMgmtCamp Ghent VictoriaLogs in VictoriaMetrics Cloud: Fast, Cost-Effective Log Management is Here What’s new in VictoriaMetrics Anomaly Detection (2025) VictoriaMetrics January 2026 Ecosystem Updates VictoriaLogs Basics: What You Need to Know, with Examples & Visuals What's New in VictoriaMetrics Cloud Q4 2025? New tiers, more deployment options, IaC and alerting rules. Vibe coding tools observability with VictoriaMetrics Stack and OpenTelemetry How a US Software Provider Improved Traffic Alerting with VictoriaMetrics Anomaly Detection VictoriaMetrics 2025 Developer Experience: A Year in Review Spotify’s performance & control across large monitoring environments with VictoriaMetrics VictoriaMetrics Achieves Red Hat OpenShift Operator Certification Our latest updates across the VictoriaMetrics Observability ecosystem New Capacity Tiers in VictoriaMetrics Cloud Announcing 1B+ Downloads & Product Development With Logs, Traces, Metrics AI Agents Observability with OpenTelemetry and the VictoriaMetrics Stack Discarding gRPC-Go: The Story Behind OTLP/gRPC Support in VictoriaTraces What's New in VictoriaMetrics Cloud Q3 2025? From new region in Asia to proactive alerts How DreamHost Slashed Memory Usage by 80% and Scaled to 76 Million Time Series Upcoming Conferences & Meetups: Where to Meet Our Team VictoriaMetrics Long-Term Support (LTS): H2 2025 Update Creating a Sustainable Open Source Business Model - Introduction Full-Stack Observability with VictoriaMetrics in the OTel Demo Alerting Best Practices vmanomaly Deep Dive: Smarter Alerting with AI (Tech Talk Companion) VictoriaLogs Practical Ingestion Guide for Message, Time and Streams Monotonic and Wall Clock Time in the Go time package Hello Singapore! VictoriaMetrics Cloud Expands to Asia Pacific MCP Server Integration & Much More: What's New in VictoriaMetrics Cloud Q2 2025 FIPS 140-3 Compatible Builds for VictoriaMetrics Enterprise Components VictoriaLogs Unleashed: Cluster Version Now Available for Exceptional, Linear Scaling Integrations made easy with VictoriaMetrics Cloud Developer's Note: Research on Distributed Tracing, Comparing With Tempo and ClickHouse vmagent: Key Features Explained in Under 15 Minutes Go synctest: Solving Flaky Tests vmalert: Maximize Your Monitoring (Tech Talk Companion) Celebrating 14K Stars on GitHub: Spring Update vmalert: Maximize Your Monitoring VictoriaMetrics Connects with the Open Source Community at LinuxFest Northwest 2025 Graceful Shutdown in Go: Practical Patterns VictoriaLogs: Gaps, Gains & Growth Prometheus Monitoring: Functions, Subqueries, Operators, and Modifiers VictoriaMetrics Cloud: What's New in Q1 2025? Don’t default to microservices: You’ll thank us later! Container CPU Requests & Limits Explained with GOMAXPROCS Tuning gRPC in Go: Streaming RPCs, Interceptors, and Metadata From Chaos to Clarity with VictoriaLogs Prometheus Alerting 101: Rules, Recording Rules, and Alertmanager Heading to London: Meet Our Team at KubeCon Europe 2025 Inside vmselect: The Query Processing Engine of VictoriaMetrics Meet Our Team at Scale 22x Practical Protobuf - From Basic to Best Practices VictoriaLogs Status Update: Heading Towards the Cluster Version 24th of February 2025 Statement: VictoriaMetrics Stands with Ukraine! Prometheus Metrics Explained: Counters, Gauges, Histograms & Summaries Prometheus Monitoring: Instant Queries and Range Queries Explained 300%+ Growth in 2024: Join Our Team in 2025! FOSDEM 2025 recap How Protobuf Works—The Art of Data Encoding OpenTelemetry, Prometheus, and More: Which Is Better for Metrics Collection and Propagation? How vmstorage Handles Query Requests From vmselect How vmstorage's IndexDB Works VictoriaMetrics Tech Talk Stream: A Deep Dive into Blackbox Monitoring How HTTP/2 Works and How to Enable It in Go VictoriaMetrics Cloud: What's New in Q4 2024? How vmstorage Processes Data: Retention, Merging, Deduplication,... How vmstorage Handles Data Ingestion From vminsert When Metrics Meet vminsert: A Data-Delivery Story From net/rpc to gRPC in Go Applications Piros | VictoriaMetrics Partner Allenta | VictoriaMetrics Partner CloudRaft | VictoriaMetrics Partner Sensedia & VictoriaMetrics: API-compatible Efficient Storage Scalable Prometheus: Why DSV Chose VictoriaMetrics Sensor Factory | VictoriaMetrics Partner Erythix | VictoriaMetrics Partner Groove X & VictoriaMetrics: Faster Device Health Monitoring Scaled & Performant Monitoring at Spotify with VictoriaMetrics Grammarly & VictoriaMetrics: 10× Lower Costs & Direct Access Zelarsoft | VictoriaMetrics Partner DFKI & VictoriaMetrics: Efficient Long-Term Metric Storage Niubits | VictoriaMetrics Partner Megazone Cloud | VictoriaMetrics Partner Cogito Software | VictoriaMetrics Partner Bajau | VictoriaMetrics Partner Find Out Why Dig Security Chose VictoriaMetrics! Ness | VictoriaMetrics Partner Alpha Data | VictoriaMetrics Partner SIOS Technology | VictoriaMetrics Partner
How to Choose a Scalable Open Source Time Series Database: The Cost of Scale
Jean-Jerome Schmidt-Soisson / Roman Khavronenko · 2022-05-16 · via VictoriaMetrics: Simple & Reliable Monitoring for Everyone on VictoriaMetrics

When looking for a highly scalable time series database, there are a number of criteria to investigate and evaluate.

First up, it’s always a good idea to consider open source software. It’s more likely to have gone through comprehensive troubleshooting, it’s typically more reliable as it has more timely and widespread peer-review, it better guarantees technology independence, it’s easier to find engineers who are familiar with it and it has great security. Organizations can use open source software for as long as they want including in the form of their choice.

So now you’ve decided on an open source time series database, what are the key criteria to look at to further refine your search?

  • Multi-tenancy
  • Horizontal and vertical scalability
  • High availability
  • Cost effectiveness

It’s also important to look at the following time series-specific functionalities and whether they are supported by the solution you’re evaluating:

  • Thorough and honest documentation that states exactly what happens in reality
  • Integrations with popular ingestion protocols (such as Prometheus or Graphite)
  • Ability to visualize time series (integration with Grafana or own UI)
  • Alerting support
  • Downsampling of historical data for more efficient storage

Architecture

#

From an architectural perspective, it is recommended that the following concepts and questions be considered (this is a non-exhaustive list but what we recommend based on our experience):

  • Is object storage the best option?
  • Is a local file system preferable, especially if you’re looking for query speed performance?
  • Can the solution you’re evaluating be used as a single binary, in cluster mode, or both?
  • How many “moving parts” does it contain?

Open Source & Licensing

#

We always recommend open source over proprietary or otherwise not fully open technology. It’s important to look not only at a solutions’ code and features but also how its licensing is structured.

  • Is the solution based on original code?
  • What type of license does it come with?
    • Is it an Apache 2 license for example?
    • Or, is it an AGPLv3 license, which implies restrictions on use?

There are many other licenses in the market and AGPLv3 is not the worst. It allows using software for commercial purposes, but requires open sourcing any modifications made to it. This license does not affect small companies or startups, but protects against building a business based on it, because it usually requires some code changes for better integrations.

These are important questions to investigate and find answers for up front so that you don’t find yourself locked-in or restricted by licensing requirements that you hadn’t anticipated.

The cost of scale

#

In terms of measurement when it comes to choosing a most scalable time series database it’s important to do due diligence and fully test for key indicators such as:

  • Bottlenecks in query or ingestion performance
  • Scaling factor
    • The best characteristic is linear scaling which means if you double resources then the capability of the system is also doubled.
      • Unfortunately, this is rare in distributed systems. Most of the systems have a coefficient of the scaling, which means if you double resources you get only only 30% of additional capability.
  • Compression efficiency
  • Resource usage

Resource usage can be a determining factor both from a system as well as from a budgetary perspective.

As some of you will know from experience: great scale can quickly lead to great cost!

So some of the questions to always ask are:

  • What is the cost of the scale?

And

  • What do the unit economics look like?

Knowing the answers to these questions will help you to make not just the most relevant technical decision, but also the most cost-effective one.

More on our thoughts with regards to cost (of scale) and cost in general is documented in this blog post.

Object Storage vs Local File System

#

While object storage in the cloud is the new approach and file system is the traditional one, object storage became an option only recently, with the rise of AWS which can make it quite cheap.

However, there are pros and cons to both.

Some object storage pros:

  • It is infinite
  • You pay only for what you use, no need to resize the storage
  • It is durable, as cloud providers promise
  • It is cheap for storing data
    • Actually, it could be more expensive than local storage in some scenarios, but in general, for storing time series data it is usually cheaper. Slower but cheaper.

Some object storage cons:

  • It has significantly higher latency than a local filesystem
  • The network bandwidth could become a bottleneck

Some local file system pros:

  • Provides the best options for really good read performance
  • Does super-fast, almost instant, backups
    • This is only possible on local filesystems, because they support “hard links”, so no data copying is done
  • Allows for mutating (merging) of data aggressively to achieve better compression on disk
  • No hidden costs on storage

Some local file system cons:

So what is probably the most scalable open source time series database?

#

This blog post isn’t entirely innocent of course, and we do have a take on the question.

With VictoriaMetrics we focus on performance, simplicity and reliability, which allows us to achieve both high scalability and availability. We believe that the local file system set up provides the best options for outstanding read and write performance.

We also always make sure that VictoriaMetrics has few moving components and no extra dependencies in order to make it as easy to operate as possible.

This was one of the key reasons why VictoriaMetrics was developed in the first place: to remove the complexity that exists in other solutions to make monitoring as accessible as possible to everyone who needs it.

What makes VictoriaMetrics particularly scalable and available?

#

  • Each service may scale independently
  • Each service may run on hardware optimized for the service needs
  • Heavy inserts don’t interfere with heavy selects
  • Better vmstorage durability because it offloads complex querying logic to vmselect
  • Built-in replication
  • Per-tenant rate-limiting

VictoriaMetrics’ cluster version is a great option for ingestion rates over a million data points per second and this is what its architecture looks like:
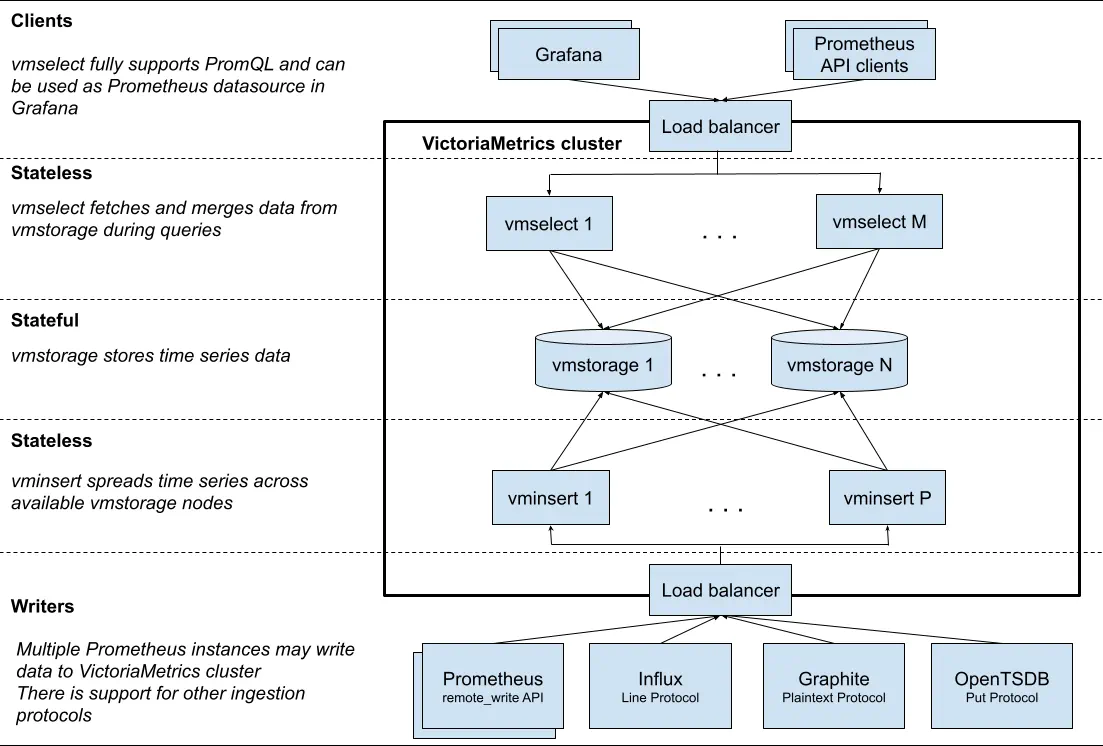
Cluster performance and capacity can be scaled up in two ways:

  • By adding more resources (CPU, RAM, disk IO, disk space, network bandwidth) to existing nodes in the cluster (aka vertical scalability).
  • By adding more nodes to the cluster (aka horizontal scalability).

General recommendations for cluster scalability:

  • Adding more CPU and RAM to existing vmselect nodes improves the performance for heavy queries, which process a big number of time series with a big number of raw samples.
  • Adding more vmstorage nodes increases the number of active time series the cluster can handle. This also increases query performance over time series with high churn rate. The cluster stability is also improved with the number of vmstorage nodes, since active vmstorage nodes need to handle lower additional workload when some of vmstorage nodes become unavailable.
  • Adding more CPU and RAM to existing vmstorage nodes increases the number of active time series the cluster can handle. It is preferred to add more vmstorage nodes over adding more CPU and RAM to existing vmstorage nodes, since higher number of vmstorage nodes increases cluster stability and improves query performance over time series with high churn rate.
  • Adding more vminsert nodes increases the maximum possible data ingestion speed, since the ingested data may be split among a bigger number of vminsert nodes.
  • Adding more vmselect nodes increases the maximum possible queries rate, since the incoming concurrent requests may be split among a bigger number of vmselect nodes.

The Cost of VictoriaMetrics Scale

#

The key to (cost-)efficiency is simplicity and transparency.

The less magic happens under the hood and the lower number of components is used, the better efficiency will be.

It’s not only about efficient usage of hardware resources, but also about the amount of effort engineers need to make in order to understand and maintain the software. Which, sometimes, costs a lot more than hardware.

VictoriaMetrics documentation contains clear tips for the scaling of cluster components. The Capacity planning section also contains general recommendations and performance expectations based on the amount of provided resources and workload volume.

We always pay extra attention to performance reports from our users and do everything we can to make VictoriaMetrics even better. All the performance improvements we publish are based on real-world scenarios, which we learn from and optimize together with our users.

Finally, we’re always very keen to collaborate, learn from our customers and users, their setups and specific cases.

That is, probably, the main reason why VictoriaMetrics remains on the high level of (cost-)efficiency and scalability.

Please do contact us if you’d like to discuss your own monitoring set up with us!