





This VictoriaLogs article serves as a quick way to grasp the core concepts of not only VictoriaLogs but also common logging systems. It covers only the most important information from the documentation, along with common cases identified after troubleshooting many real-world scenarios.
If you’re just getting started with VictoriaLogs, this is a great place to begin. For more in-depth or advanced details, refer to the official documentation.
VictoriaLogs can receive both structured logs and unstructured logs. Let’s say you’re sending these unstructured logs:
127.0.0.1 - frank [28/Jul/2025:10:12:07 +0000] "GET /apache.gif HTTP/1.0" 200 2326

Jul 28 10:12:04 web-01 sshd[987]: Accepted publickey for root from 192.0.2.7 port 51122 ssh2

2025-07-28 10:15:09,123 ERROR main MyApp - java.lang.NullPointerException: Foo.bar(Foo.java:42)
None of these lines have been broken into an obvious set of key-value pairs, so in logging terms, they are “unstructured.”
VictoriaLogs turns the first log (127.0.0.1 - frank...) into structured logs that look like this:
{
  "_msg": "127.0.0.1 - frank [28/Jul/2025:10:12:07 +0000] \"GET /apache.gif HTTP/1.0\" 200 2326",
  "_time": "2025-07-28T10:12:07Z"
}
The logging system has three important concepts: message, time, and stream. We’ve just covered two of these concepts.
Every log entry must include at least the _msg field, which contains a human-readable string describing the event. VictoriaLogs natively supports this field, and it works out of the box:
msg._msg field for quick troubleshooting, instead of the full log line, which can be long and hard to read.You can expand the log to view the full JSON. All other fields attached to the message are metadata that help users interpret the event. If the _time field is not specified in the log message, VictoriaLogs will use the log ingestion time instead.
A stream in VictoriaLogs is the logical “bucket” that contains all the logs that are related to each other. Consider a payment service log:
{
  "service": "payments",
  "_time": "2025-07-28T10:20:14Z",
  "_msg": "received transfer request id=12345"
}
You would choose the service field as the stream field. So every log coming from a service will be put into one bucket (log stream). Why does the database do this?
Because it writes logs of a stream together on disk and compresses them into blocks:
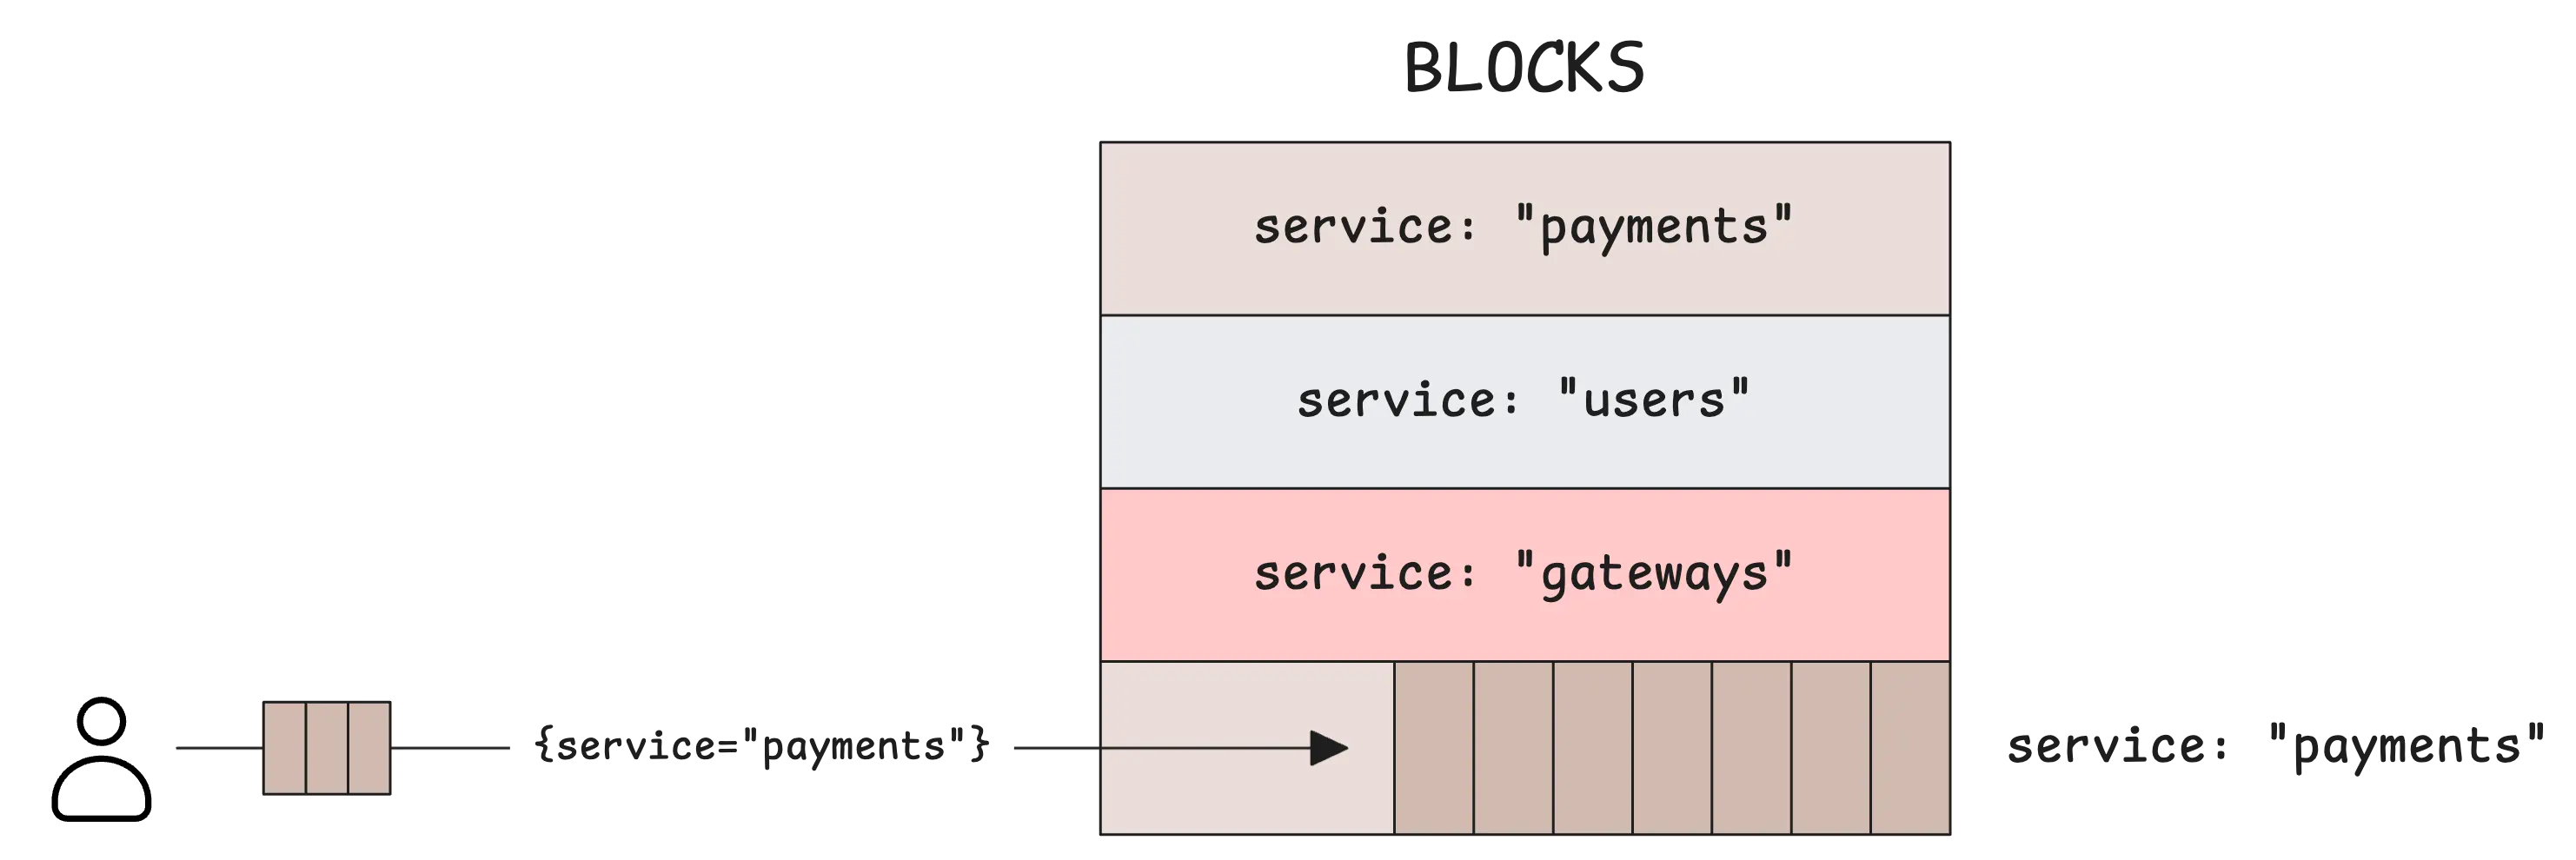
When querying, it lets the system skip whole blocks that do not belong to the needed streams. VictoriaLogs reads the block header and immediately determines that the log stream you’re querying doesn’t match the block’s contents, so it can skip entire blocks:
When you query using the service stream field, the results will be very fast. You can use the LogsQL stream filter to find logs for the payment service or gateway service:
$ _time:1h {service="payments"} level:="error" "paid"

$ _time:1h {service="gateway"} level:="warn" "timeout"
These two queries examine all block headers from the past hour (_time:1h), but only open blocks that contain the stream {service="payments"} or {service="gateway"}.
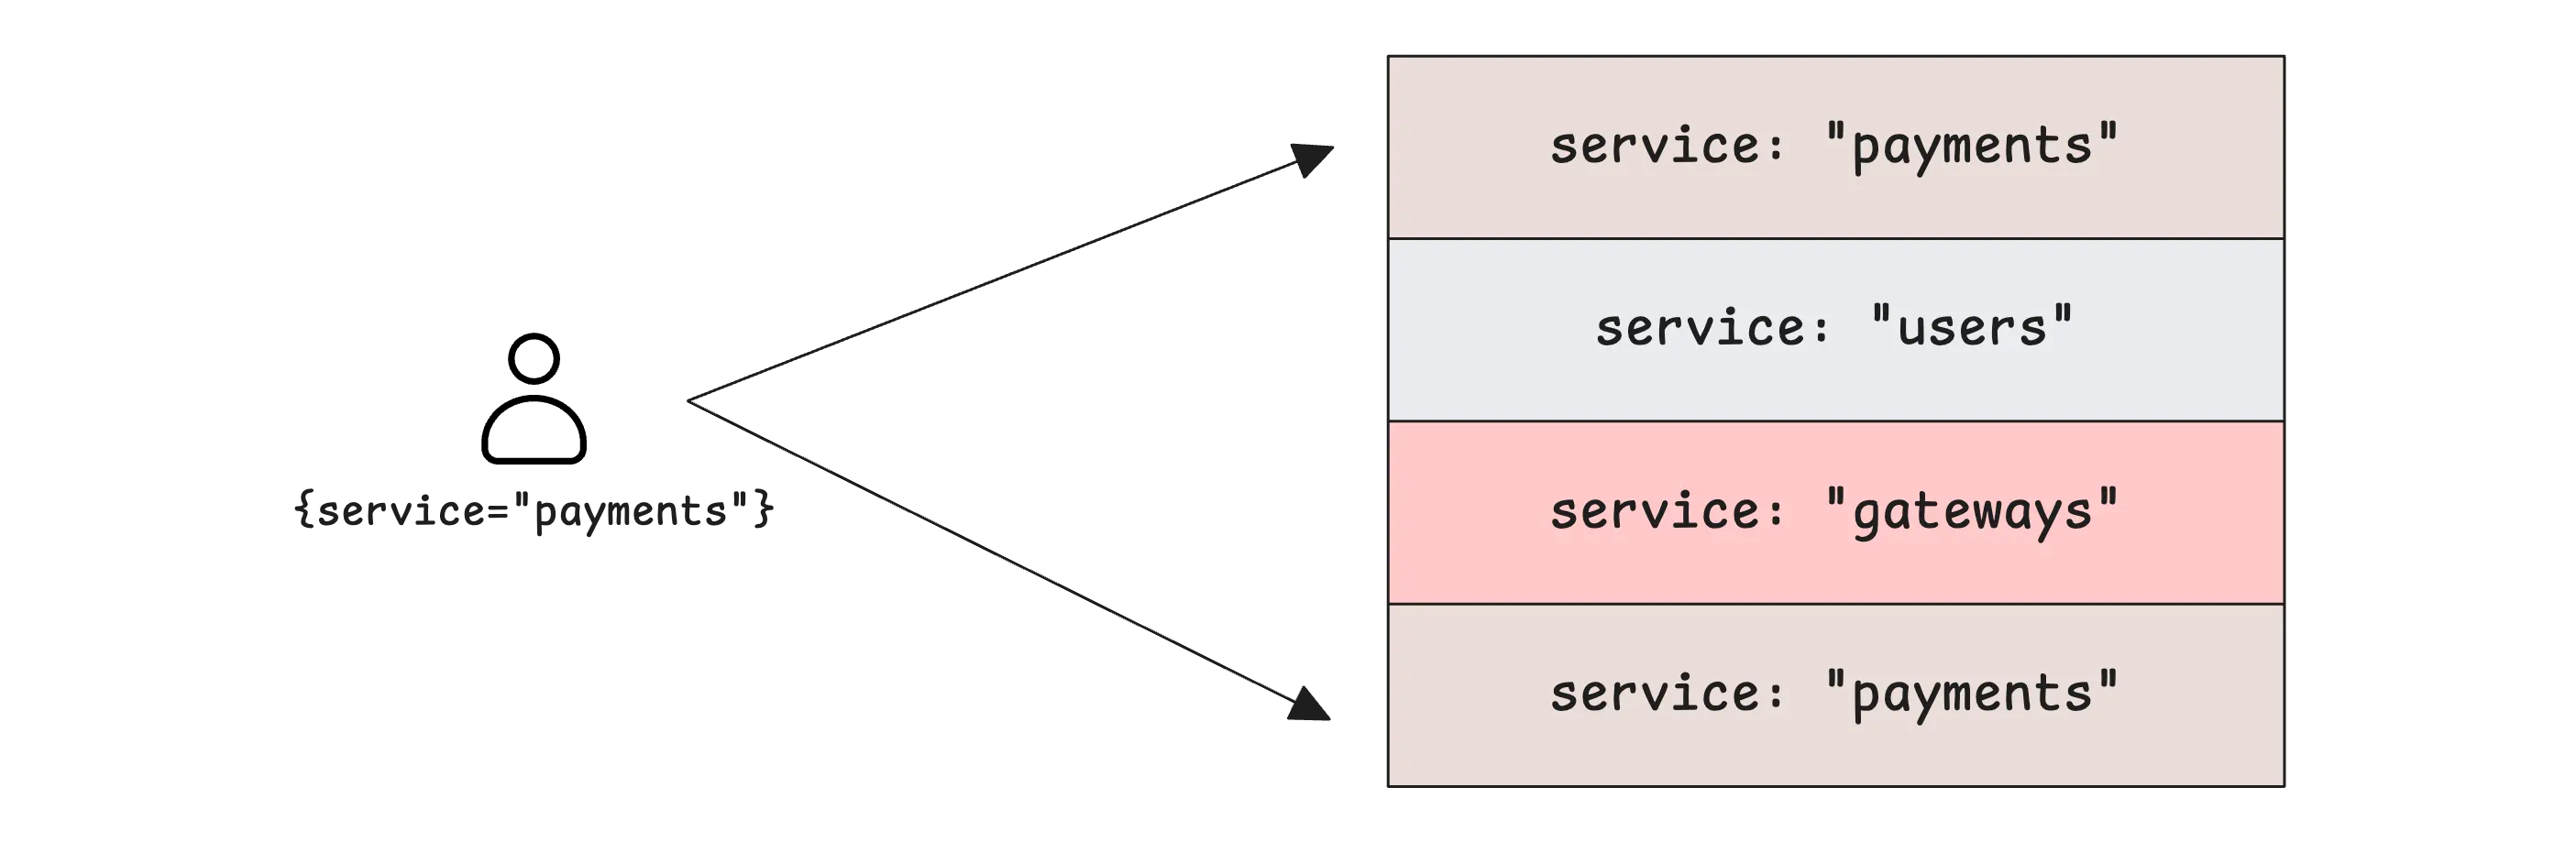
They then scan those blocks to find the relevant logs according to other filters in the query.
When choosing stream fields, include the fields you most often use to filter your logs, such as app, instance, or namespace, as long as their values don’t change too often. This works well for most cases, but there are also some edge cases that need to be considered.
If we go with only service as the stream field and you have 10 thousand logs of payments service per second, that single-field choice soon reveals its first weakness.
In an hour, there are 36 million logs of payments service, and querying through those 36 million logs for 1 hour to find the correct one is a CPU-intensive task and slow.
The logs from the “payments” stream will overwhelm the other streams in the database blocks:
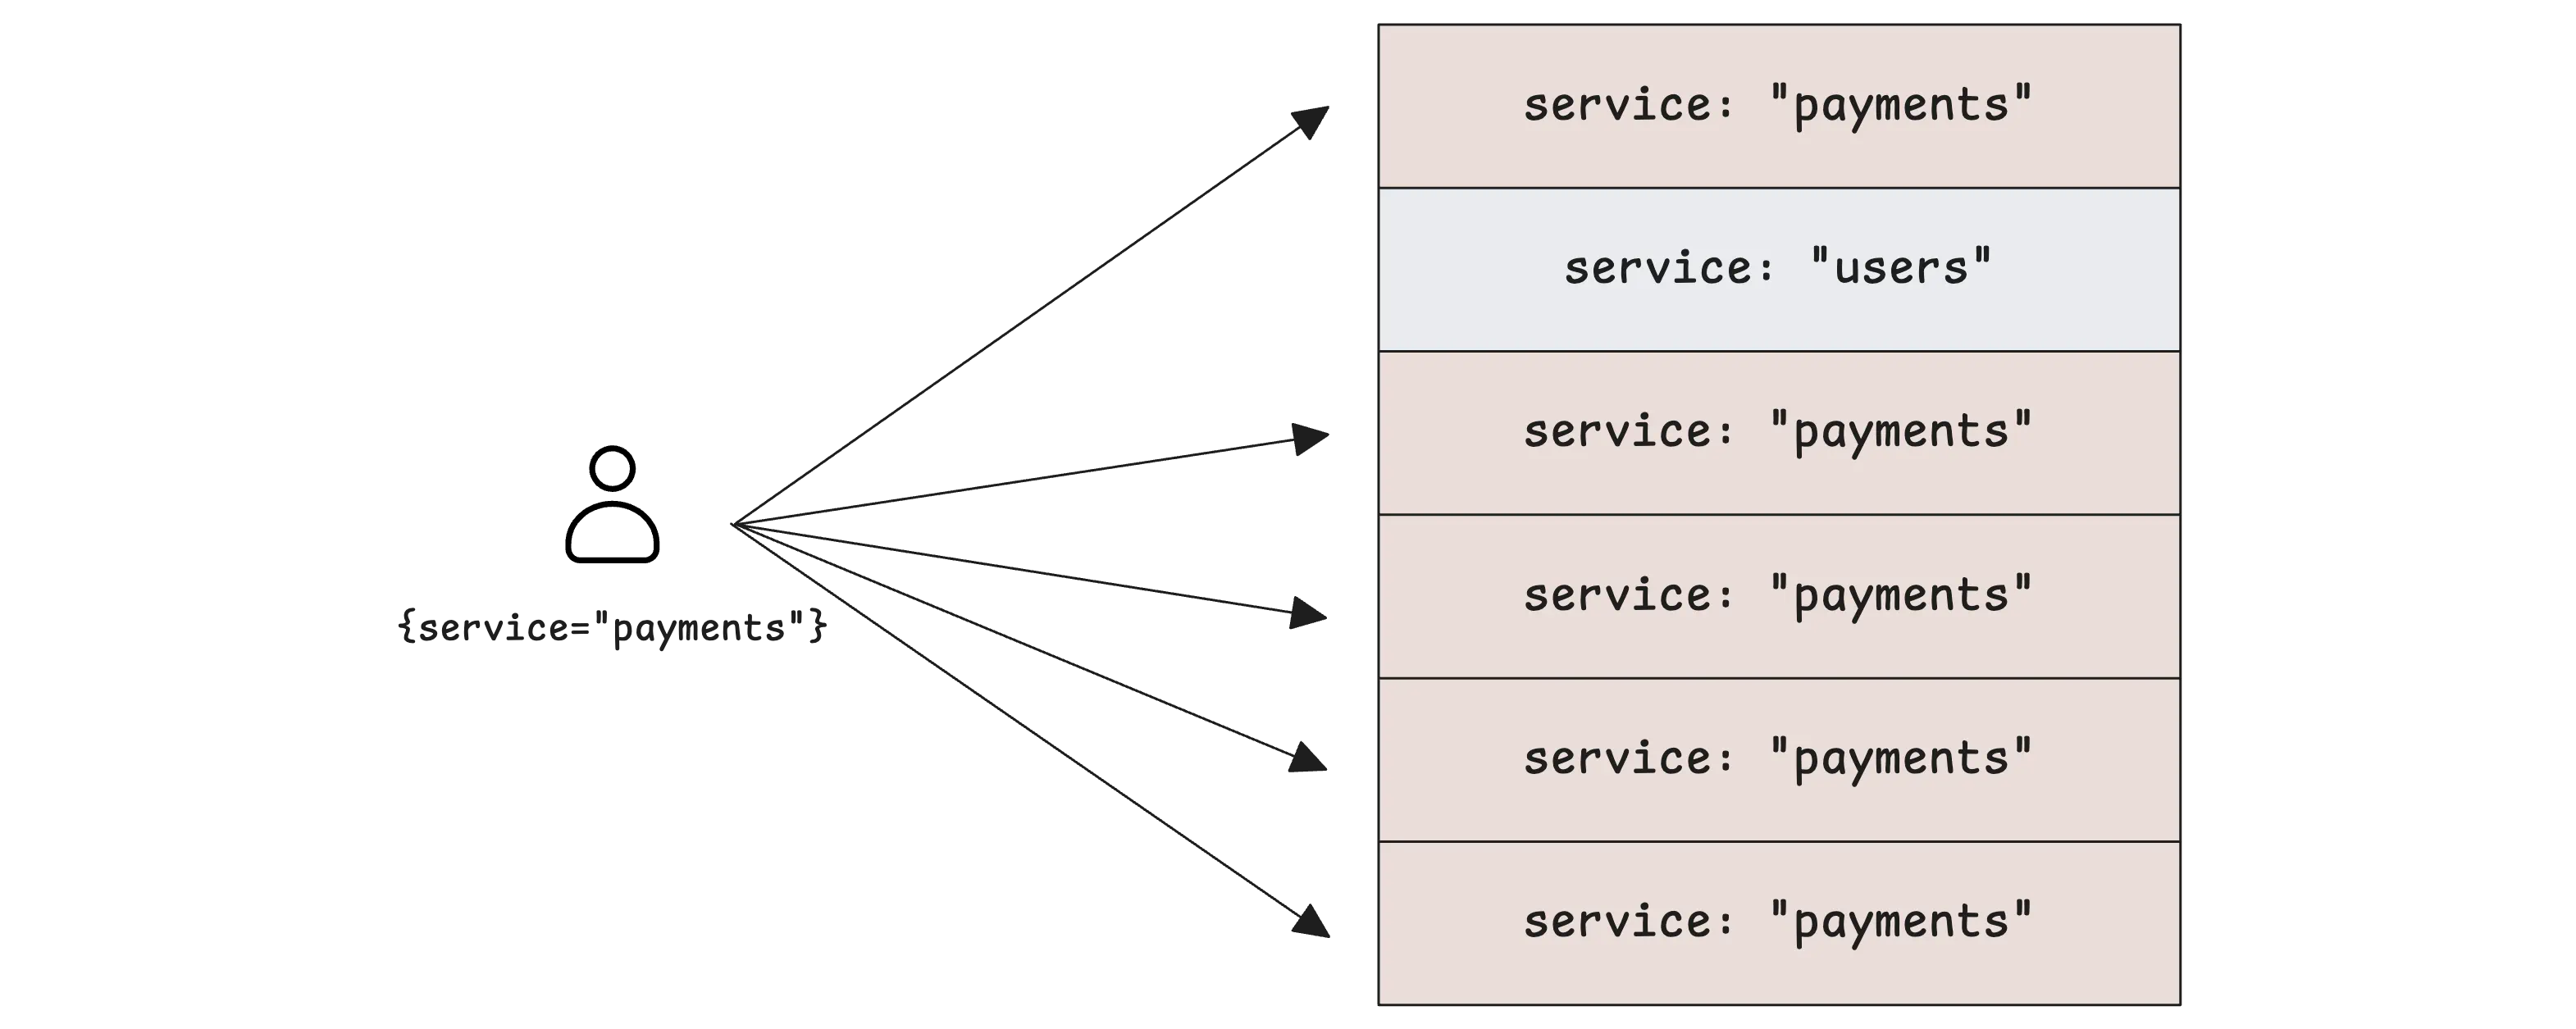
This is the “fat stream” problem. The solution is to split it by adding more stream fields. For example, adding pod to the stream field, the query will look like:
$ _time:1h {service="payments", pod="payments-6c7df89kx"} level:="error" "paid"
Now, only blocks containing stream {service="payments", pod="payments-6c7df89kx"} will be scanned, significantly reducing scanning time.
If you understand your service, you can choose more “operation”-related fields for the stream such as feature:
$ _time:1h {service="payments", feature="refund"} level:="error"
But wait a second, trying to fix the “fat stream” problem by adding more fields carelessly may create the second and far more dangerous problem: high cardinality.
Assume you’re adding a user_id field to the log stream for every user:
$ _time:1h {service="payments", user_id="johndoe"} level:="error"
Each distinct combination of those fine-grained values in the {} stream spawns a brand-new stream, so a busy payments service that handles millions of users per hour quickly explodes into millions of micro-streams (micro-blocks).
To find the {service="payments", user_id="johndoe"} logs, it needs to iterate through all those millions of block headers, then scan the eligible blocks:
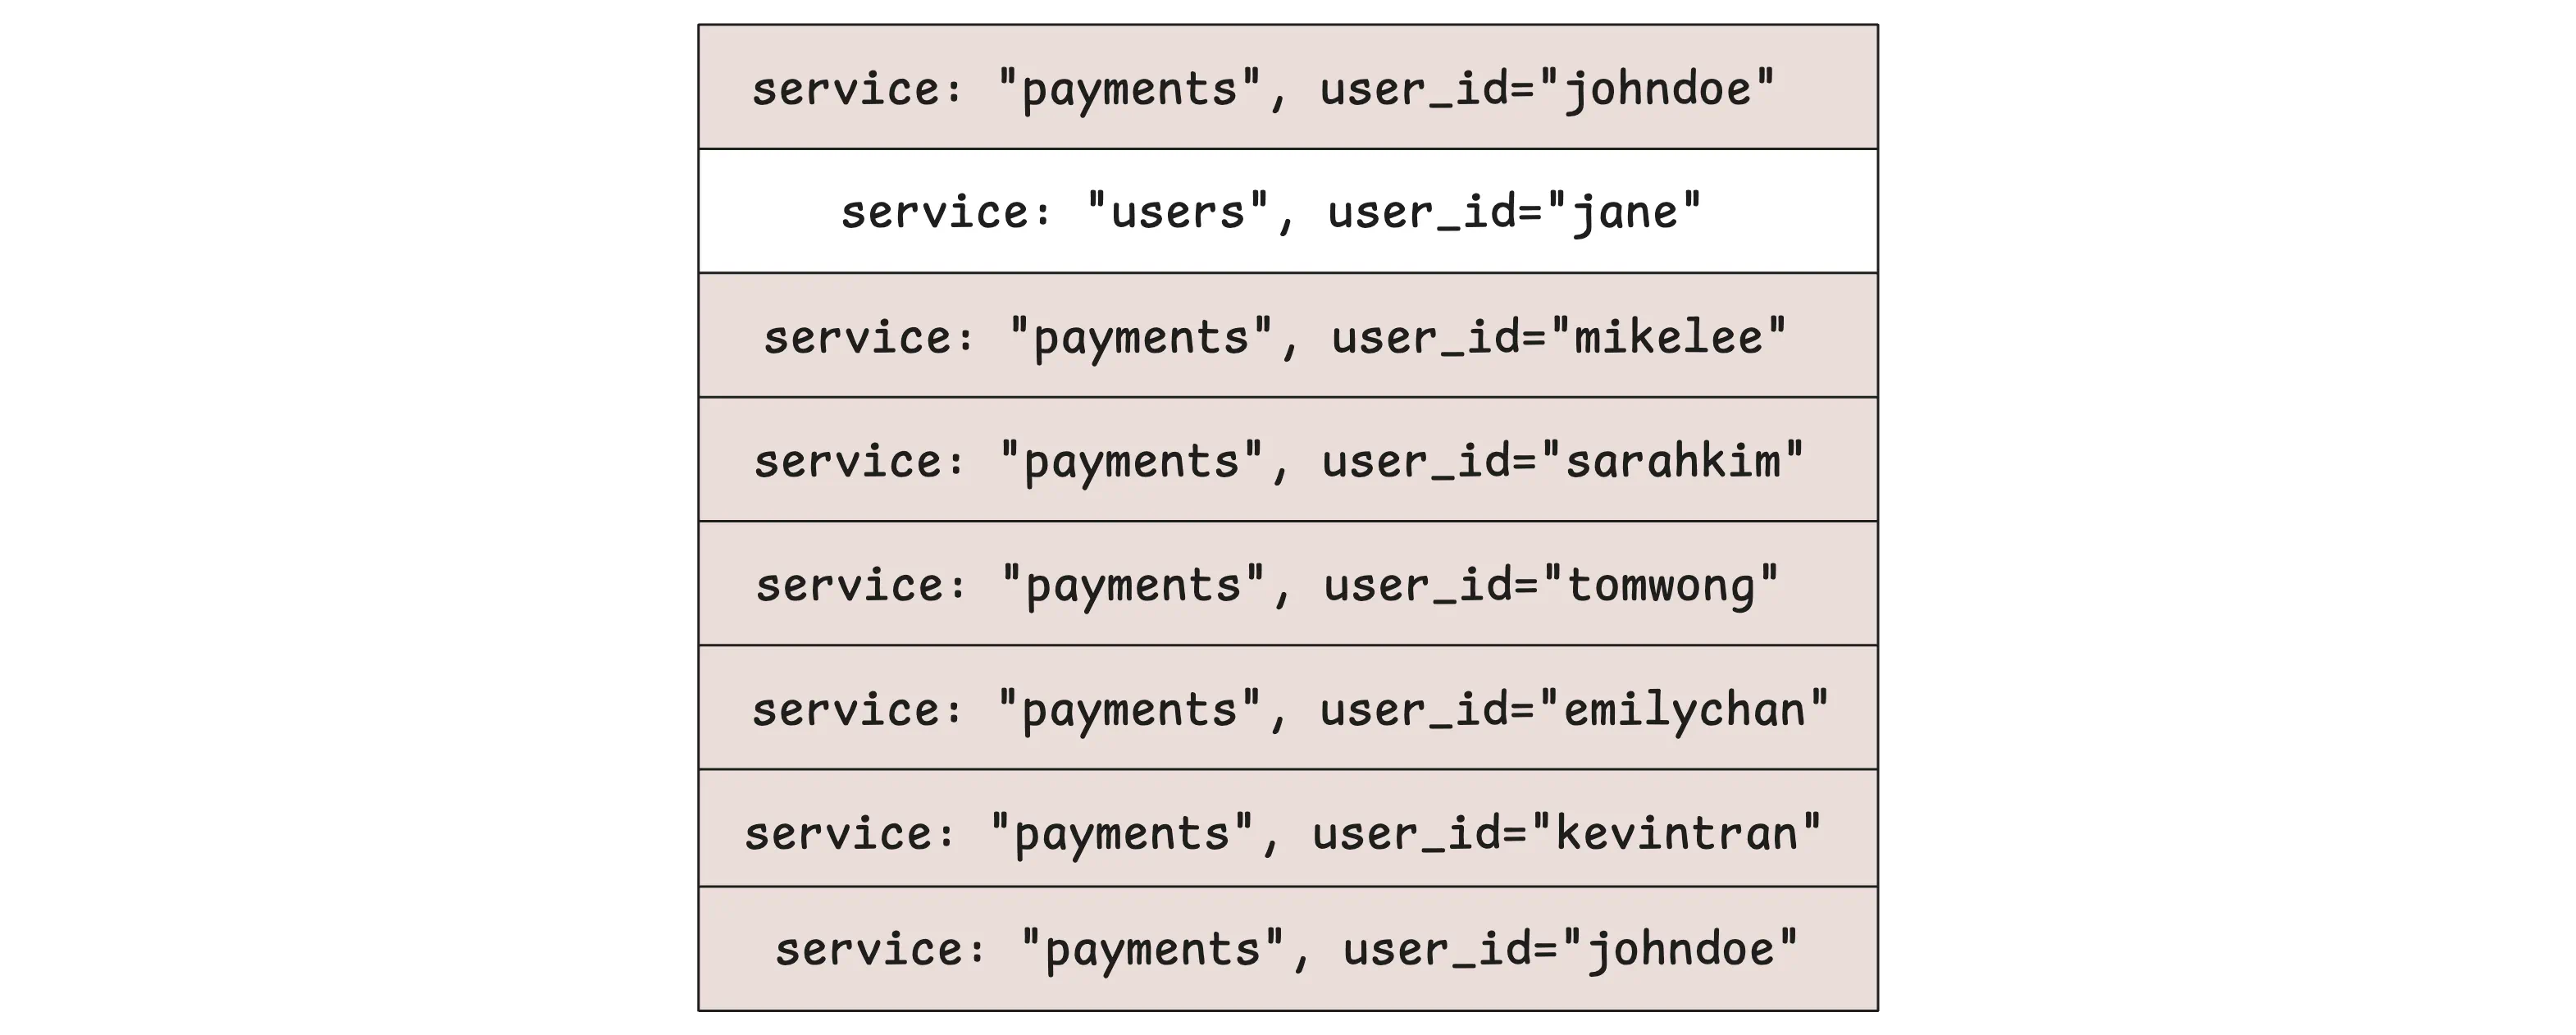
In the worst case, each eligible block contains a few logs for each user.
To conclude, the sweet spot lies between those two extremes: choose identifiers that remain constant for the lifetime of a single producer instance, yet are coarse enough to prevent the stream increase rate from becoming too unpredictable.
There is a second, more silent variant of high cardinality: a workload where the field names themselves are endlessly changing.
The problem isn’t the number of field names, since VictoriaLogs handles wide events with hundreds of fields efficiently. The real issue is that the field names are too volatile and grow dynamically at a high rate. A common pattern we’ve seen in many user scenarios is placing user IDs, product IDs, span IDs, trace IDs, etc., in log field names.
Consider a large-scale retail platform that lets every regional marketing team attach live performance counters to each individual product and name those counters however they like:
{
    "_msg": "page viewed",
    "user_id": "u-347912",
    "campaign": "summersizzle",
    "sku_00000001.clicks": 1,
    "sku_00000001.hover_ms": 83,
    "sku_00000002.clicks": 0,
    "sku_00000002.hover_ms": 12,
    ...
    "sku_00100000.clicks": 3,
    "sku_00100000.hover_ms": 57
}
This would greatly increase the number of unique field names in the database. Since VictoriaLogs indexes every field, this leads to poor performance for both querying and ingestion, as it results in inefficient data storage on disk.
It’s recommended to break down the log like this:
{
  "_msg": "perf",
  "user_id": "u-347912",
  "campaign": "summersizzle",
  "sku": "00000001",
  "clicks": 1,
  "hover_ms": 83
}
The key concepts of VictoriaLogs are even more important than all the fine-tuning flags you can set on VictoriaLogs nodes. Having good stream and log patterns is already a big win.
VictoriaLogs always requires every log entry to have a message field (_msg):
{
  "_msg": "page viewed",
  "user_id": "u-347912",
  ...
}
If your log already has a field named _msg, VictoriaLogs will automatically recognize it as the message field. However, there is a common question that always comes up: “Why does my log look like this?”
{
  "_msg": "missing _msg field; see https://docs.victoriametrics.com/victorialogs/keyconcepts/#message-field",
  "user_id": "u-347912"
}
By default, if your logs don’t have an _msg field and you also don’t specify which field is the message field, VictoriaLogs will use a default value as you saw in the snippet above.
To give VictoriaLogs a hint which fields to use as _msg, when sending logs to VictoriaLogs in an HTTP request, you can specify a query parameter:
POST /insert/jsonline?_msg_field=message,log,text
Or with an HTTP header:
VL-Msg-Field: message,log,text
VictoriaLogs expects every log entry to have a timestamp, which is referred to as the _time field.
By default, VictoriaLogs looks for a field called _time in your log line. If your logs use a different field, such as @timestamp, event_time, or created_at, you can tell VictoriaLogs to use those fields for timestamps. Similar to the _msg field, you do this either by including a query parameter:
POST /insert/jsonline?_time_field=@timestamp,event_time,created_at
Or by setting the VL-Time-Field HTTP header:
VL-Time-Field: @timestamp,event_time,created_at
You can list several field names, and VictoriaLogs will use the first one it finds with a value.
If the _time field is missing, or if it equals 0, or if it equals -, then the data ingestion time is used as the log entry timestamp.
VictoriaLogs supports a broad range of timestamp formats. The most typical is ISO8601 or RFC3339, such as "2023-06-20T15:32:10Z", but you can also use other variants, with or without fractional seconds, with or without explicit timezones.
You can also provide a number (Unix timestamp), it will automatically detect whether it’s in seconds, milliseconds, microseconds, or nanoseconds by looking at its length. The value 1686026893 is interpreted as seconds, 1686026893735 as milliseconds, and so on up to full nanosecond precision.
If your timestamp string doesn’t include a timezone, VictoriaLogs assumes the server’s local timezone.
Unlike the message and time fields, stream fields are not automatically detected.
If you send a log with a _stream field but do not specify which fields are stream fields, VictoriaLogs will treat _stream as just another regular field. To use stream fields, you must set them up explicitly in one of two ways:
By query parameter:
POST /insert/jsonline?_stream_fields=_stream,app_name,environment
Or by HTTP header:
POST /insert/jsonline
VL-Stream-Fields: _stream,app_name,environment
If you skip this step, VictoriaLogs simply ignores whatever fields you might have thought would define a stream, and no special grouping or stream indexing happens. It doesn’t throw any error, but this can lead to less efficient storage, slower queries, and missed opportunities for organizing your logs in a way that matches your applications’ logical structure.
In practice, this means that if you don’t specify any stream fields, all your logs are considered to belong to one big stream.
There is a third way when using other protocols such as syslog.
// Syslog automatically uses these as stream fields:
streamFields = []string{
    "hostname",
    "app_name",
    "proc_id",
}
Every log entry is automatically assigned two special fields that relate to streams: _stream_id and _stream:
_stream_id is a unique identifier created by hashing together the selected stream fields, making sure that all logs with the same values for those fields share the same stream ID. This ID is unique per tenant and is not meant to be human-readable._stream is a label string that represents the stream in a Prometheus-like format, showing the set of field/value pairs that define the stream.{
"_stream_id": "0000000000000000c56bebb8b0c9bda967541bf348deb44c",
"_stream": "{kubernetes.container_name=\"oauth2-proxy\",kubernetes.pod_name=\"vmlogs-single-victoria-logs-single-server-0\",kubernetes.pod_namespace=\"vmlogs\",stream=\"stdout\"}"
...
}
_stream and _stream_id are exposed because they give us a fast, reliable way to work with “log streams” — all the log lines that come from one logical source (a container, host, function, etc.).
Now you can filter an exact source with a single filter:
_stream_id:0000000000000000c56bebb8b0c9bda967541bf348deb44c
Instead of repeating every label:
{kubernetes.container_name="oauth2-proxy",kubernetes.pod_name="vmlogs-single-victoria-logs-single-server-0",kubernetes.pod_namespace="vmlogs",stream="stdout"} error
Furthermore, seeing the explicit _stream field helps you verify that your _stream_fields=... ingestion setting produced the labels you expected, and lets you know exactly which bucket the log belongs to.
When you tell VictoriaLogs which fields make up a stream, for example _stream_fields=namespace,pod,container, each incoming log line is examined for those three names.
If the line carries all of them, their values are combined to form the stream label set:
{namespace="...",pod="...",container="..."}
and the entry is stored under that stream.
If a log arrives without the container field, the remaining two are still taken and the line is saved to a different stream that now looks like:
{namespace="...",pod="..."}
A line that has only namespace ends up in yet another stream:
Because each unique combination is treated as a separate stream, leaving fields out or allowing them to be blank can quickly multiply the number of streams you create.
In short, VictoriaLogs quietly drops any missing or empty fields from the list you provided and builds the stream from whatever is left.
Normal fields in VictoriaLogs are the user-defined fields in your log entries, such as level, user_id, service, or any other custom keys you send.
When a log is accepted, VictoriaLogs just adds every field in the order it arrives. The row is then stored exactly as given, so if you have 2 fields with the same name, they WON’T be deduplicated:
{
  "level": "info",
  "user_id": "alice",
  "user_id": "bob",
  "_msg": "paid"
}
VictoriaLogs also doesn’t remove empty logs. All log changes and dropping should be handled by the log collector or distributor. Allowing each VictoriaLogs instance to do its own changes would only add confusion. In other words, it’s best to address these issues at the source layer, not at the destination (storage) layer.
Compression in VictoriaLogs is the process of reducing the physical size of stored log data on disk. To measure how effective the compression of your log system is, look at compression ratio metrics.
It compares the volume of ingestion logs vs the logs stored on disk:
ratio = vl_uncompressed_data_size_bytes / vl_compressed_data_size_bytes
One of the biggest factors affecting compression efficiency is the field’s values. The more unique the values, the worse the compression ratio.
Besides this principle, VictoriaLogs is really efficient in compression for these field types:
level (e.g. DEBUG, INFO, WARN, ERROR).255.255.255.0).5s, 100ms, 2h30m).1GB, 512MB, 100KB).That’s why it’s better to break your message field, which contains a lot of fields:
{
  "_msg": "User u123 performed LOGIN action at 2024-01-15T10:30:00Z with status SUCCESS in 50ms from 192.168.1.5, used 10MB"
}
into
{
  "_msg": "User performed login",
  "user_id": "u123", // constant or low cardinality
  "action": "LOGIN", // ≤ 8 values
  "status": "SUCCESS", // ≤ 8 values
  "timestamp": "2024-01-15T10:30:00Z", // ISO8601 timestamp
  "duration": "50ms", // duration
  "ip": "192.168.1.5", // IPv4 address
  "file_size": "10MB" // file size
}
This is much more efficient for both data ingestion and querying.
A good practice for normal fields is only adding “query-needed” fields and avoiding too many fields. A common mistake in Go is having this line of code:
log.Info().Any("product", product).String("user_id", userID).Msg("paid")
This is not a good idea because of the product field. Usually, it will contain a lot of fields that are not related, but because of how convenient it is, we still do it and it bloats the log size:
{
  "level": "info",
  "user_id": "alice",
  "product": {
    "id": 123,
    "name": "Super Widget",
    "category": "widgets",
    "attributes": {
      "color": "red",
      "size": "large"
    },
    "price": 2999
  },
  "_msg": "paid"
}
Imagine hundreds of services with tens of thousands of models at high ingestion rates. Instead, try to be selective:
log.Info().
  Any("product_id", product.id).
  Int("price", price).
  String("user_id", userID).
  Msg("paid")
Even though VictoriaLogs is really efficient for storing and querying hundreds of fields per log, as long as the field names are bounded, it’s still not a good idea to abuse logs by adding too many fields, which increases the time troubleshooting by looking at too much redundant information.
However, let’s say your use case still needs a nested struct and it’s required for searching, VictoriaLogs will flatten them behind the scenes:
{
  "level": "info",
  "user_id": "alice",
  "product.id": "123",
  "product.name": "Super Widget",
  "product.category": "widgets",
  "product.attributes.color": "red",
  "product.attributes.size": "large",
  "product.price": "2999",
  "_msg": "paid"
}
This needs to be handled carefully because field names in VictoriaLogs have a hard limit of 128 bytes. Instead of flattening nested objects, VictoriaLogs converts the entire nested object to a JSON string and uses the parent prefix as the field name.
Here’s an example:
{
  "very.deeply.nested.object.with.many.levels.of.nesting.that.exceeds.the.limit": "value"
}
Being converted to
{
  "very.deeply.nested.object.with.many.levels.of.nesting.that.exceeds.the": "{\"limit\":\"value\"}"
}
This ensures no field name ever exceeds the configured maximum length, and no data is lost - it’s just represented as a stringified sub-object.
We’re VictoriaMetrics, a team providing open-source, highly scalable and cost-efficient solutions for monitoring, logging, and tracing, trusted by users worldwide to reduce their observability costs. Check out our VictoriaMetrics, VictoriaLogs, VictoriaTraces for more details.
此内容由惯性聚合(RSS阅读器)自动聚合整理,仅供阅读参考。 原文来自 — 版权归原作者所有。