


惯性聚合 高效追踪和阅读你感兴趣的博客、新闻、科技资讯
阅读原文 在惯性聚合中打开

推荐订阅源

K
Kaspersky official blog
云风的 BLOG
云风的 BLOG
IT之家
IT之家
T
The Blog of Author Tim Ferriss
C
Check Point Blog
N
Netflix TechBlog - Medium
宝玉的分享
宝玉的分享
T
Tailwind CSS Blog
G
Google Developers Blog
让小产品的独立变现更简单 - ezindie.com
F
Fortinet All Blogs
D
DataBreaches.Net
The Register - Security
L
LINUX DO - 最新话题
W
WeLiveSecurity
奇客Solidot–传递最新科技情报
奇客Solidot–传递最新科技情报
V2EX - 技术
V2EX - 技术
CTFtime.org: upcoming CTF events
小众软件
小众软件
F
Full Disclosure
K
KPMG report finds enterprise disconnect between AI and its ROI | CIO
I
InfoQ
S
Secure Thoughts
TaoSecurity Blog
TaoSecurity Blog
MyScale Blog
MyScale Blog
AI
AI
Recent Announcements
cs.CV updates on arXiv.org
Hugging Face - Blog
Hugging Face - Blog
Recent Commits to openclaw:main
Cyber Security Advisories - MS-ISAC
C
CXSECURITY Database RSS Feed - CXSecurity.com
V
Vulnerabilities – Threatpost
NISL@THU
NISL@THU
SecWiki News
SecWiki News
Cisco Talos Blog
Cisco Talos Blog
H
Heimdal Security Blog
Y
Y Combinator Blog
N
News | PayPal Newsroom
P
Privacy International News Feed
美团技术团队
Attack and Defense Labs
D
Docker
PCI Perspectives
PCI Perspectives
Webroot Blog
Webroot Blog
A
About on SuperTechFans
A
Arctic Wolf
Threat Intelligence Blog | Flashpoint
MongoDB | Blog
MongoDB | Blog
T
Threat Research - Cisco Blogs

VictoriaMetrics: Simple & Reliable Monitoring for Everyone on VictoriaMetrics

Operator now has Long-Term Support (LTS) version Multi-tiered Observability: A Practical Way to Handle Diverse Workloads VictoriaMetrics April 2026 Ecosystem Updates Not All Telemetry Requires Premium Pricing VictoriaMetrics at KubeCon Amsterdam: Community Highlights What's new in VictoriaMetrics Anomaly Detection (Q1 2026) What's New in VictoriaMetrics Cloud Q1 2026? Logs, MCP Server, Better Alerting, and... a Secret Project VictoriaMetrics at KubeCon: Optimizing Tail Sampling in OpenTelemetry with Retroactive Sampling VictoriaMetrics March 2026 Ecosystem Updates Observability Lessons From OpenAI Benchmarking Kubernetes Log Collectors: vlagent, Vector, Fluent Bit, OpenTelemetry Collector, and more VictoriaMetrics February 2026 Ecosystem Updates VictoriaMetrics at FOSDEM, Cloud Native Days France, and CfgMgmtCamp Ghent VictoriaLogs in VictoriaMetrics Cloud: Fast, Cost-Effective Log Management is Here What’s new in VictoriaMetrics Anomaly Detection (2025) VictoriaMetrics January 2026 Ecosystem Updates VictoriaLogs Basics: What You Need to Know, with Examples & Visuals What's New in VictoriaMetrics Cloud Q4 2025? New tiers, more deployment options, IaC and alerting rules. Vibe coding tools observability with VictoriaMetrics Stack and OpenTelemetry How a US Software Provider Improved Traffic Alerting with VictoriaMetrics Anomaly Detection VictoriaMetrics 2025 Developer Experience: A Year in Review Spotify’s performance & control across large monitoring environments with VictoriaMetrics VictoriaMetrics Achieves Red Hat OpenShift Operator Certification Our latest updates across the VictoriaMetrics Observability ecosystem New Capacity Tiers in VictoriaMetrics Cloud Announcing 1B+ Downloads & Product Development With Logs, Traces, Metrics AI Agents Observability with OpenTelemetry and the VictoriaMetrics Stack Discarding gRPC-Go: The Story Behind OTLP/gRPC Support in VictoriaTraces What's New in VictoriaMetrics Cloud Q3 2025? From new region in Asia to proactive alerts How DreamHost Slashed Memory Usage by 80% and Scaled to 76 Million Time Series Upcoming Conferences & Meetups: Where to Meet Our Team VictoriaMetrics Long-Term Support (LTS): H2 2025 Update Creating a Sustainable Open Source Business Model - Introduction Full-Stack Observability with VictoriaMetrics in the OTel Demo Alerting Best Practices vmanomaly Deep Dive: Smarter Alerting with AI (Tech Talk Companion) VictoriaLogs Practical Ingestion Guide for Message, Time and Streams Monotonic and Wall Clock Time in the Go time package Hello Singapore! VictoriaMetrics Cloud Expands to Asia Pacific MCP Server Integration & Much More: What's New in VictoriaMetrics Cloud Q2 2025 FIPS 140-3 Compatible Builds for VictoriaMetrics Enterprise Components VictoriaLogs Unleashed: Cluster Version Now Available for Exceptional, Linear Scaling Integrations made easy with VictoriaMetrics Cloud Developer's Note: Research on Distributed Tracing, Comparing With Tempo and ClickHouse vmagent: Key Features Explained in Under 15 Minutes Go synctest: Solving Flaky Tests vmalert: Maximize Your Monitoring (Tech Talk Companion) Celebrating 14K Stars on GitHub: Spring Update vmalert: Maximize Your Monitoring VictoriaMetrics Connects with the Open Source Community at LinuxFest Northwest 2025 Graceful Shutdown in Go: Practical Patterns VictoriaLogs: Gaps, Gains & Growth Prometheus Monitoring: Functions, Subqueries, Operators, and Modifiers VictoriaMetrics Cloud: What's New in Q1 2025? Don’t default to microservices: You’ll thank us later! Container CPU Requests & Limits Explained with GOMAXPROCS Tuning gRPC in Go: Streaming RPCs, Interceptors, and Metadata From Chaos to Clarity with VictoriaLogs Prometheus Alerting 101: Rules, Recording Rules, and Alertmanager Heading to London: Meet Our Team at KubeCon Europe 2025 Inside vmselect: The Query Processing Engine of VictoriaMetrics Meet Our Team at Scale 22x Practical Protobuf - From Basic to Best Practices VictoriaLogs Status Update: Heading Towards the Cluster Version 24th of February 2025 Statement: VictoriaMetrics Stands with Ukraine! Prometheus Metrics Explained: Counters, Gauges, Histograms & Summaries Prometheus Monitoring: Instant Queries and Range Queries Explained 300%+ Growth in 2024: Join Our Team in 2025! FOSDEM 2025 recap How Protobuf Works—The Art of Data Encoding OpenTelemetry, Prometheus, and More: Which Is Better for Metrics Collection and Propagation? How vmstorage Handles Query Requests From vmselect How vmstorage's IndexDB Works VictoriaMetrics Tech Talk Stream: A Deep Dive into Blackbox Monitoring How HTTP/2 Works and How to Enable It in Go VictoriaMetrics Cloud: What's New in Q4 2024? How vmstorage Processes Data: Retention, Merging, Deduplication,... How vmstorage Handles Data Ingestion From vminsert When Metrics Meet vminsert: A Data-Delivery Story From net/rpc to gRPC in Go Applications Piros | VictoriaMetrics Partner Allenta | VictoriaMetrics Partner CloudRaft | VictoriaMetrics Partner Sensedia & VictoriaMetrics: API-compatible Efficient Storage Scalable Prometheus: Why DSV Chose VictoriaMetrics Sensor Factory | VictoriaMetrics Partner Erythix | VictoriaMetrics Partner Groove X & VictoriaMetrics: Faster Device Health Monitoring Scaled & Performant Monitoring at Spotify with VictoriaMetrics Grammarly & VictoriaMetrics: 10× Lower Costs & Direct Access Zelarsoft | VictoriaMetrics Partner DFKI & VictoriaMetrics: Efficient Long-Term Metric Storage Niubits | VictoriaMetrics Partner Megazone Cloud | VictoriaMetrics Partner Cogito Software | VictoriaMetrics Partner Bajau | VictoriaMetrics Partner Find Out Why Dig Security Chose VictoriaMetrics! Ness | VictoriaMetrics Partner Alpha Data | VictoriaMetrics Partner SIOS Technology | VictoriaMetrics Partner
Performance optimization techniques in time series databases: Limiting concurrency
Roman Khavronenko / Aliaksandr Valialkin · 2023-11-24 · via VictoriaMetrics: Simple & Reliable Monitoring for Everyone on VictoriaMetrics

This blog post is also available as a recorded talk with slides.

Table of Contents

Performance optimization techniques in time series databases:


Monitoring is about reflecting services state in time. The services we monitor, in most cases, exist for a significant amount of time, and we collect their metrics at fixed intervals. Thanks to this, the ingestion rate (writes) to a time series database can be stable and predictable.
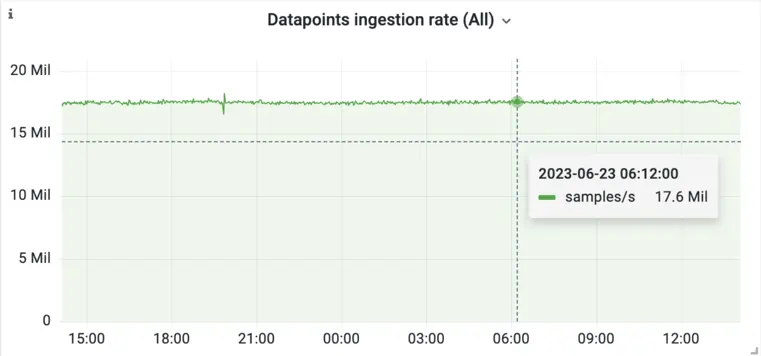
An example of stable ingestion rate of metrics samples in VictoriaMetrics database. An example of stable ingestion rate of metrics samples in VictoriaMetrics database.

But with Kubernetes many services run in auto-scaling mode, when the number of their replicas can change depending on demand. So does the number of targets that vmagent or VictoriaMetrics Single Server needs to scrape generating fluctuations in the ingestion pattern.
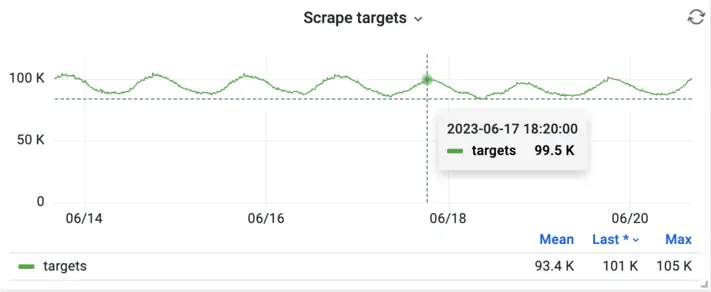
Daily fluctuations in the number of scrape targets for an application. Daily fluctuations in the number of scrape targets for an application.

Alongside more predictable fluctuations, sometimes a times series database needs to be able to cope with huge spikes in ingestion load. Examples include if someone deploys a new application with new metric names, or if there’s a bug that generates a large number of incorrect metric names.
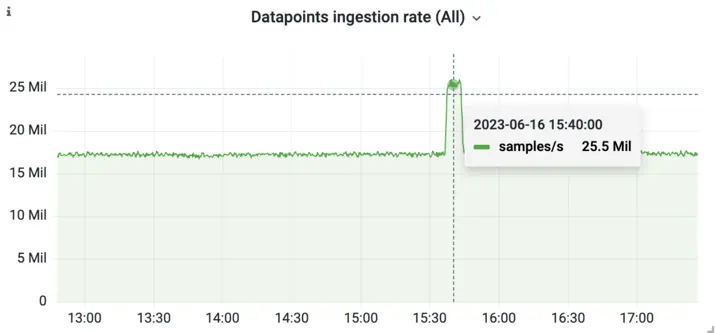
An example spike in the ingestion rate for an application. An example spike in the ingestion rate for an application.

When spikes occur, we need to make sure that increase in workload doesn’t crash the database. Spikes often coincide with the times that you need your monitoring the most. Rollouts of new applications and diagnosing bugs both benefit from reliable monitoring.

One technique VictoriaMetrics uses to ensure reliability in these cases is to limit concurrency. Limiting concurrency brings benefits for both CPU and memory usage:

  • CPU - The machine(s) running VictoriaMetrics only have a finite number of cores. By limiting concurrency, you reduce contention between threads and context switching. Context switching between threads is expensive, and when spikes occur, you want your CPUs to work as efficiently as possible.
  • Memory - Each running thread adds to the memory overhead of your application. By reducing the number of concurrent threads, you reduce the memory usage.

That said, limiting concurrency is not without its downsides. The biggest issue is that it introduces complexity to your application which could lead to accidental deadlocks or inefficient resource utilization.

For example, a thread could be waiting on I/O from storage or the network. I/O is unpredictable and often comes with large delays. By limiting the number of threads that can run concurrently, you increase the risk of under-utilizing the CPU while waiting on I/O. This is why it’s important to only limit concurrency for CPU-intensive workloads that doesn’t depend on I/O.

There are multiple ways of implementing limited concurrency. Below are two examples.

Worker pool implementation

#

The canonical way to limit the amount of concurrency in your application is to spawn a limited number of worker threads and share a channel between them for dispatching work. The code might look something like the below:

// Limit concurrency with number of available CPUs
var concurrencyLimit = runtime.NumCPU()

func main() {
    workCh := make(chan work, concurrencyLimit)
    for i := 0; i < concurrencyLimit; i++ {
        go func() {
            for {
                processData(<-workCh)
            }
        }()
    }
  putWorkToCh(workCh)
}

The code above first finds out the number of CPUs the machine has using Go’s runtime library. It then spawns a number of worker threads equal to the number of CPUs, and each runs the processData function. It also creates a shared channel to distribute work among them, workCh.

This approach works well but comes with a few downsides:

  • Complicated implementation - This approach requires implementing start and stop procedures for workers.
  • Additional synchronization - If the units of work are small, then the overhead of distributing work through a channel is relatively large.

This approach provides a good solution for limited concurrency, and might work well for your application. That said, it’s worth comparing it to a token-based implementation as described below.

Token-based implementation

#

An alternative approach is to implement a gate that workers need to pass before they can run. One implementation of this approach is to create a channel with a limited buffer size and make workers attempt to put a dummy value into that channel, a token, before running. Workers will then take a dummy value from the channel once they are finished. Since the channel has a limited buffer size, only a limited number of workers can run at once. Take a look at the code snippet below:

var concurrencyLimitCh = make(chan struct{}, runtime.NumCPU())

// This function is CPU-bound and may allocate a lot of memory.
// We limit the number of concurrent calls to limit memory
// usage under high load without sacrificing the performance.
func processData(src, dst []byte) error {
    concurrencyLimitCh <- struct{}{}
    defer func() {
        <-concurrencyLimitCh
    }()
    // heavy processing...

The code above creates a channel called concurrencyLimitCh that has as many slots as there are CPUs on the machine. The processData function does some CPU-heavy processing, and so before running, it requests a token from concurrencyLimitCh by placing a dummy value in the channel. It might be easier to visualize what’s happening as a series of steps:

  1. processData attempts to place an empty struct in concurrencyLimitCh. This acts as its permission token and will block until a slot becomes available.
  2. processData does its CPU-intensive work.
  3. processData defers taking an item from concurrencyLimitCh until after it has finished its work. Taking an item from the channel frees up a slot, and lets another worker run.

This approach guarantees that no more than len(concurrencyLimitCh) workers are running at the same time, since each worker has to secure a slot before it does any intensive work.

This is much simpler than running separate workers, because you don’t need start and stop routines for each worker. Your application can spawn a worker goroutine whenever a unit of work comes in and concurrencyLimitCh does the hard work of guaranteeing that no more than some maximum number of workers are running at once.

Summary

#

Limiting concurrency can help to bound resource usage and protect your application from crashing during load spikes. It ensures that your application processes load without interruptions in an optimal manner instead of wasting resources on context switches.

This approach works best for CPU-bound operations, and doesn’t apply as well to I/O-bound operations since they involve waiting on external resources.

Stay tuned for the new blog post in this series!