






Summary: This post breaks down the managed service for Prometheus pricing, comparing the cost of ingesting and storing metrics on Amazon Managed Service for Prometheus vs Google Cloud Managed Service for Prometheus and VictoriaMetrics. The result: AWS comes in at ~$13K/month, Google much higher, while VictoriaMetrics offers dramatically lower and more predictable pricing.
Observability has become a critical part of many companies and their business.
So did requirements for the systems which collect and store business-critical metrics.
Monitoring systems need to be reliable, scalable, fast, and preferably cost-effective. Such features of any monitoring system never come for free or out of the box – you need people, a team of professionals who can build and manage it.
This is exactly what managed solutions provide – reducing the operational burden and complexity of monitoring systems and providing enterprise-grade guarantees at the same time. There are many solutions that provide similar services, but the question is: what is the cost of such a service?
In this post, we’ll compare the cost of using managed services for Prometheus, which de-facto became a standard for modern monitoring.
We’ll have to see what would be the cost of serving the same workload at Amazon Managed Service for Prometheus, Google Cloud Managed Service for Prometheus and VictoriaMetrics Cloud.
For defining the workload we’ll take average numbers of 1k hosts, 1k unique time series each
with 5s resolution (scrape interval in Prometheus terms) stored for at least 1 month.
Let’s do some simple maths to have common ground:
1 month is 730 hours
1,000 hosts x 1,000 metrics per node
  x 3600 seconds in an hour
  x 730 hours in a month
  / 5 seconds collection interval
= 525,600,000,000 total monthly samples
Average ingestion speed = 200,000 samples/s
Usually, the workload is not only about ingestion of data, but also about querying. The querying part is far more tricky than ingestion because it depends on how exactly people use the ingested data, how complex the queries are, at which time ranges. We’ll get back to this question in the summary.
The full description of AWS pricing on Managed Service for Prometheus and a calculator can be found here. AWS will charge customers for every ingested metric sample and the disk space it uses when stored.
AWS uses Cortex project under the hood, so expectations of the disk space used are about 1-2 bytes per sample. The cost of ingesting and storing the mentioned workload would be the following:
First 2 billion samples  $0.90 / 10M
Next 250 billion samples $0.35 / 10M
Over 252 billion samples $0.16 / 10M
2,000,000,000   x $0.0000000900 = $180.00
250,000,000,000 x $0.0000000350 = $8750.00
273,600,000,000 x $0.0000000160 = $4377.60

Monthly metrics ingested total costs:
$180.00 + $8750.00 + $4377.60 = $13307.60

Storage: $0.03/GB-Mo
525,600,000,000 samples x 1 byte = 525,600,000,000 bytes

Monthly storage costs: 525.6 GB x $0.03 per GB = $15.7

Total: $13307.60 + $15.7 = $13323.3
The total cost of storing samples for an average ingestion speed of 200k samples/s would be $13k per month. Reducing the resolution of data to 1 minute would cut the cost to $1.6k per month.
Google’s monitoring pricing is also based on the number of samples ingested plus the amount of bytes ingested. So the cost estimation would be the following:
First 50 billion samples $0.20 / 1M
Next 200 billion samples $0.16 / 1M
Over 250 billion samples $0.12 / 1M
50,000,000,000  x $0.000000200 = $10000.00
200,000,000,000 x $0.000000160 = $32000.00
275,600,000,000 x $0.000000120 = $33072.00

Monthly metrics ingested total costs:
$10000.00 + $32000.00 + $33072.00 = $75072.00
I didn’t include cost estimation for data ingested, because according to my calculations (and to Google’s calculator) the price was ridiculously high. I believe I made a mistake or my understanding of the pricing table was incorrect. Please, let me know in the comments what your estimations for data pricing on this are.
The cost of storing samples for an average ingestion speed of 200k samples/s would be $75k per month. Reducing the resolution of data to 1 minute would cut the cost to $8.7k per month. To be fair, Google won’t charge for Google Cloud metrics. It also has a discount for sparse metrics (histograms) with empty buckets, which they promise may cut the cost by 20-40%. Taking this into account, the cost may be cut to $45k for 5s resolution or to $5.2k for 1m resolution per month.
In February 2022 we announced availability of VictoriaMetrics Cloud and provided an estimation of the workload it could handle on the smallest instance. In VictoriaMetrics Cloud there are no charges for samples or cardinality, ingress traffic is also free. The customer only pays for three things: compute resources (vCPU and memory), storage capacity and egress traffic.
In the availability of VictoriaMetrics Cloud announcement, we used a workload very similar to what we use here. Actually, it was a bit higher: 211k samples/s and about 1.1 million unique time series. VictoriaMetrics easily handles this workload (plus read load) on the t3.medium AWS instance, so the cost would be the following:
Compute: $0.25/h for t3.medium instance

Monthly compute costs:
730 * $0.25 = $182.5/month for t3.medium

Storage: $0.002/h for 10GB
525,600,000,000 samples x 0.9 bytes = 473,040,000,000.00 bytes
For 1 month retention in VM we need to have enough space
for +1 retention unit, so we multiply it by 2
= 440 GB * 2 = 880 GB =~ 1TB

Monthly storage costs:
730 * (1000/10) * $0.002 = $146/month for 1TB disk

Monthly metrics ingested total costs:
$182.50 + $146.00 = $328.50
The resulting price for VictoriaMetrics Cloud is 40 times lower than Amazon Managed Service for Prometheus price, and 228 times lower than Google Cloud Managed Service for Prometheus price for the same workload.
I agree that this comparison is not actually “apples to apples”. In VictoriaMetrics Cloud you pay for compute resources regardless of the existing workload - it would cost you about $200 per month for 10k samples/s and 100k samples/s. While in Amazon Managed Service for Prometheus and Google Cloud Managed Service for Prometheus you pay only for what you actually write into it. On the other hand, the cost estimation for VictoriaMetrics Cloud is super predictable and transparent.
In this comparison, we skipped the price of read queries because they are very specific to usage scenarios. Some companies are using metrics only for checking Grafana dashboards a couple of times a day, some run quite expensive recording rules for SLO calculations over a month period. I suggest readers estimate the cost of the read load independently. For the ingestion cost estimation, I suggest using calculators provided by Google and AWS or using the spreadsheet I built for this post. According to these calculations, the relation between samples ingestion rate and the cost (not including storage costs) would the following:
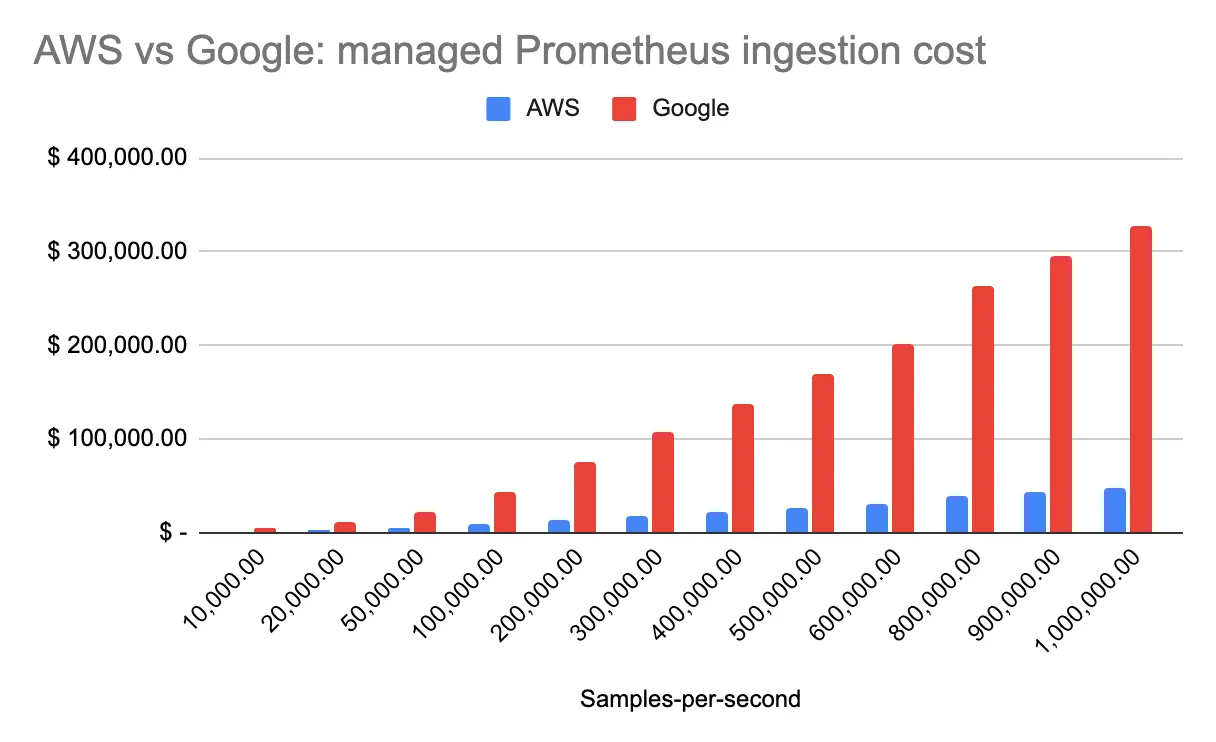 Managed Prometheus pricing comparison based on ingestion rate for AWS and Google
In VictoriaMetrics Cloud the ingestion rate of 1 million samples/s can be handled by m5.8xlarge instance for roughly $6k per month, while for AWS and Google’s managed Prometheus services it would cost $47k (x7) and $327k (x54) respectively. I believe, VictoriaMetrics Cloud is a great choice for medium and high workloads.
Besides all the features provided by VictoriaMetrics itself, the service also provides easy-to-configure-and-run monitoring solution without extra complexity and maintenance burden. As a welcome pack, we provide $200 bonus for newly registered accounts. This is enough for running a VictoriaMetrics instance with 2vCPU and 4GB of RAM for free for a month!
AWS and Google both use usage-based pricing, but their billing models differ across ingestion, storage, and query/read activity. At VictoriaMetrics, we recommend checking current provider pricing pages because costs can change quickly and depend heavily on workload size and usage patterns.
Yes. Query/read activity, network transfer, retention, scrape frequency, and high-cardinality metrics can all affect the final bill. In our article, we treat pricing estimates as workload examples, not fixed totals. Teams should validate costs against their own architecture and usage.
Yes. AWS and Google differ in architecture, regional availability, retention, integrations, SLAs, and support options. At VictoriaMetrics, we recommend reviewing each provider’s official documentation and support terms before choosing a managed Prometheus service for production workloads.
Managed Prometheus pricing is usually driven by samples ingested, data stored, retention period, and query or read volume. At VictoriaMetrics, we recommend modeling costs around scrape interval, active series count, cardinality, and dashboard or alerting frequency. For the latest info on our cloud-based tiers, check out this blog post: https://victoriametrics.com/blog/new-tiers-in-victoriametrics-cloud-2025/
It reduces infrastructure work, but it does not remove all operational responsibility. Teams still need to manage metric volume, cardinality, scrape intervals, dashboards, alerts, access, and costs. At VictoriaMetrics, we see managed services as reducing overhead, not eliminating it.
此内容由惯性聚合(RSS阅读器)自动聚合整理,仅供阅读参考。 原文来自 — 版权归原作者所有。