







Tired of being glued to your dashboards, constantly searching for signs of trouble? With today’s massive data volumes, manually sifting through metrics and logs simply doesn’t scale. This is where effective alerting comes in. It is the cornerstone of a solid observability strategy, allowing your team to shift from anxiously watching for problems to proactively resolving issues—often before they impact users.
Following up on our recent VictoriaMetrics Tech Talk, “vmalert - Maximize Your Monitoring” we will dive deeper into
vmalert, the powerful tool that makes this proactive approach possible. We will also walk you through setting up alerts in VictoriaMetrics Cloud, demonstrating our passion for delivering Simplicity, Reliability, and Efficiency for all your monitoring adventures."
Effective alerting is a cornerstone of any solid observability strategy, unless you can let someone else worry about it, and in that case why are you reading this? It’s what allows us to shift from anxiously watching dashboards to proactively resolving issues, often before they impact users.
Let’s face it, we’re drowning in data! Metrics, logs, and traces pour in, holding a potential treasure trove of information. But manually sifting through it all or being glued to dashboards just doesn’t scale. As Mathias, our Solutions Engineer, aptly put it during the talk, while dashboards are fantastic for visualization, alerts empower you to “detach from work a little bit and only get notified if something bad is happening.” Jose Gomez-Selles, Product Lead for VictoriaMetrics Cloud, echoed this, highlighting that alerting is practically a pillar of observability itself because, frankly, “you don’t want to be checking the current situation all the time.
So, what is vmalert? It’s the dedicated ruler component within the VictoriaMetrics ecosystem. Think of it as a smart cron job scheduler built specifically for your monitoring queries. It has two main gigs:
These rules run specified queries at set intervals and save the results as brand-new time series right back into VictoriaMetrics.
One of the coolest things about vmalert is its flexibility: it can query metrics from VictoriaMetrics itself, any Prometheus-compatible remote read URL, and even VictoriaLogs.
This is incredibly handy for creating metrics from logs. For example, you can set up recording rules to parse Nginx or Apache access logs, calculate error rates, and store those as metrics. This is super efficient because storing aggregated time series is often way more cost-effective than holding onto massive amounts of raw log data for ages.
Instead of just storing query results, alerting rules evaluate queries to check the health and status of your systems and services. The basic idea is: if a query returns data, it means an alert condition has been met.
Alerts go through a few states:
OK: The condition isn’t met (the query returns no data).
Pending: The alert expression has found something (e.g., a threshold is breached), but it hasn’t stayed that way for the configured for duration. This state is bypassed if the for parameter is not in the alert. So urgent alerts like a strange login will fire an alert immediately.
Firing: Both the value threshold and the for duration have been satisfied. Now, vmalert sends a notification to a configured Alertmanager instance. That for parameter in your alert definition is your best friend for preventing “flapping” alerts (alerts that bounce between firing and resolving), which can quickly lead to alert fatigue – and nobody wants that!
As demonstrated in the tech talk, if you’re running your own VictoriaMetrics setup, you’ll configure vmalert using rule files, usually in YAML. For more information, our docs, and community are here to help.
Here’s a classic example for black box monitoring, to alert if a website goes down:
groups:
 - name: Blackbox Alerts Stream
   interval: 1m
   type: prometheus
   rules:
     - alert: HTTP Blackbox Failing Stream
       expr: 'http_response_result_code{check_type="normal"} > 0'
       for: 2m
       annotations:
         summary: '{{ $labels.server }} is not healthy'
         description: '{{ $labels.server }} is not responding properly from {{ $labels.host }}'
 - name: Blackbox SLO
   interval: 5m
   type: prometheus
   rules:
     - record: http:avg:latency:5m
       expr: 'avg(http_response_response_time[5m]) by (server)'
For a more complex example of alerting rules, We publish the alerts that we use to monitor our own Victoriametrics deployments on GitHub. These are also the same rules that power our monitoring of monitor service we provide to our customers.
Alert Definition Deep Dive:
alert: The name that shows up for your alert.
expr: The PromQL expression vmalert uses to check the condition.
for: How long the condition must stay true before the alert actually fires.
labels: Custom labels you can add. Super useful for routing alerts and telling them apart.
annotations: More detailed, human-friendly info like summary and description. These even support Go templating for dynamic messages
Hot Reloading: vmalert can be set up to automatically reload rule files when they change. This means you can update your alerts on the fly without restarting the service – pretty slick!
Checking Alert Status:
vmalert has its own UI (often accessed through vmselect or vmsingle) where you can inspect your rule groups and see what state they’re in.
You can also view these alerts in Grafana by adding VictoriaMetrics as a Prometheus data source.
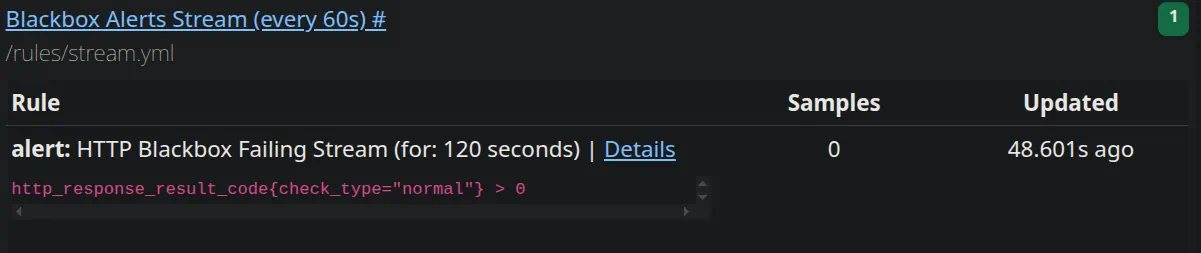
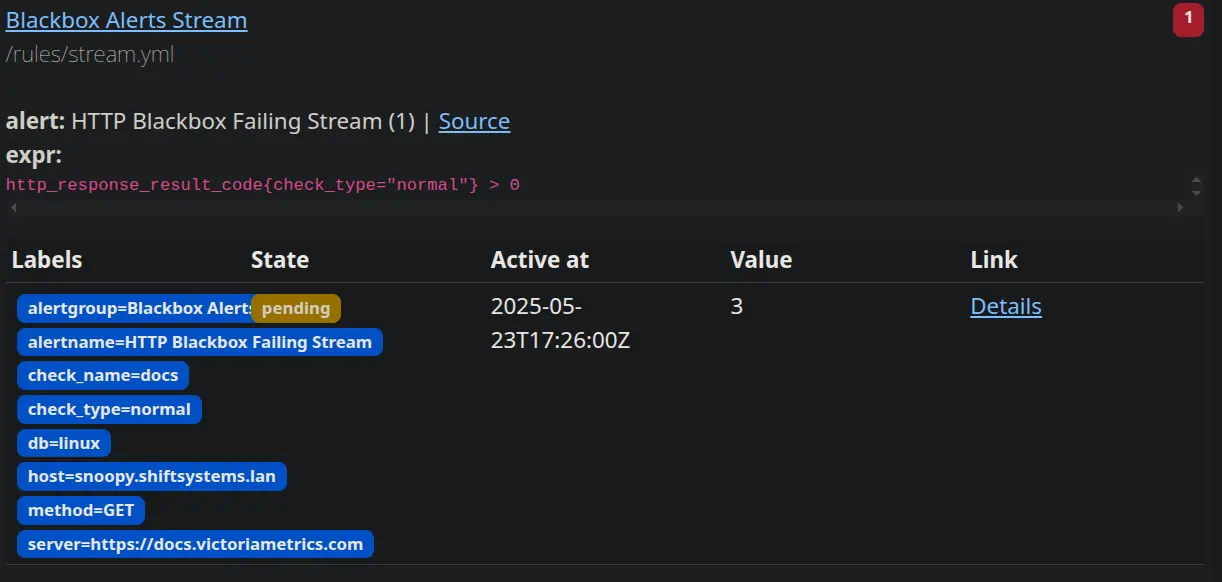
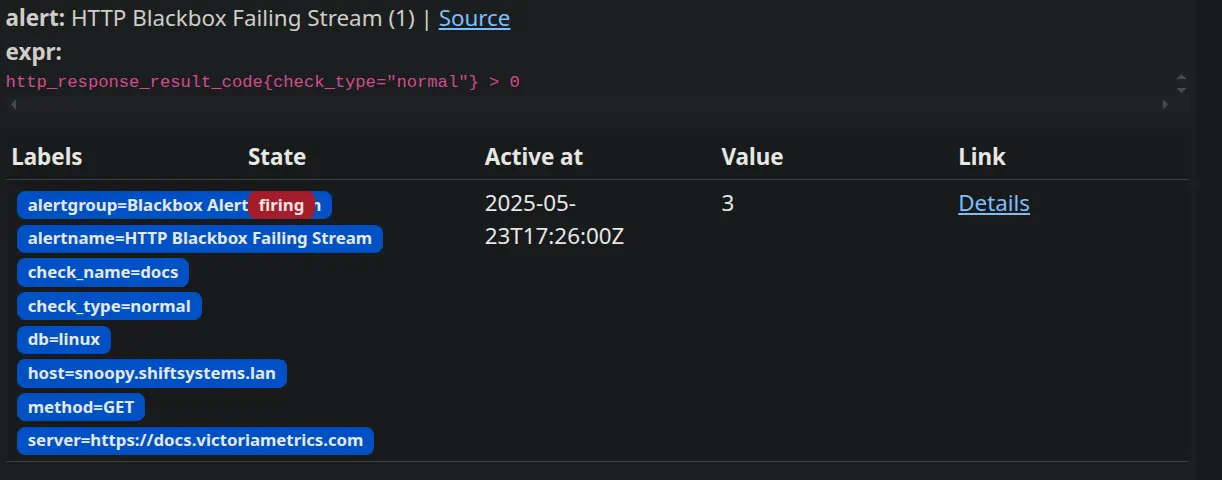

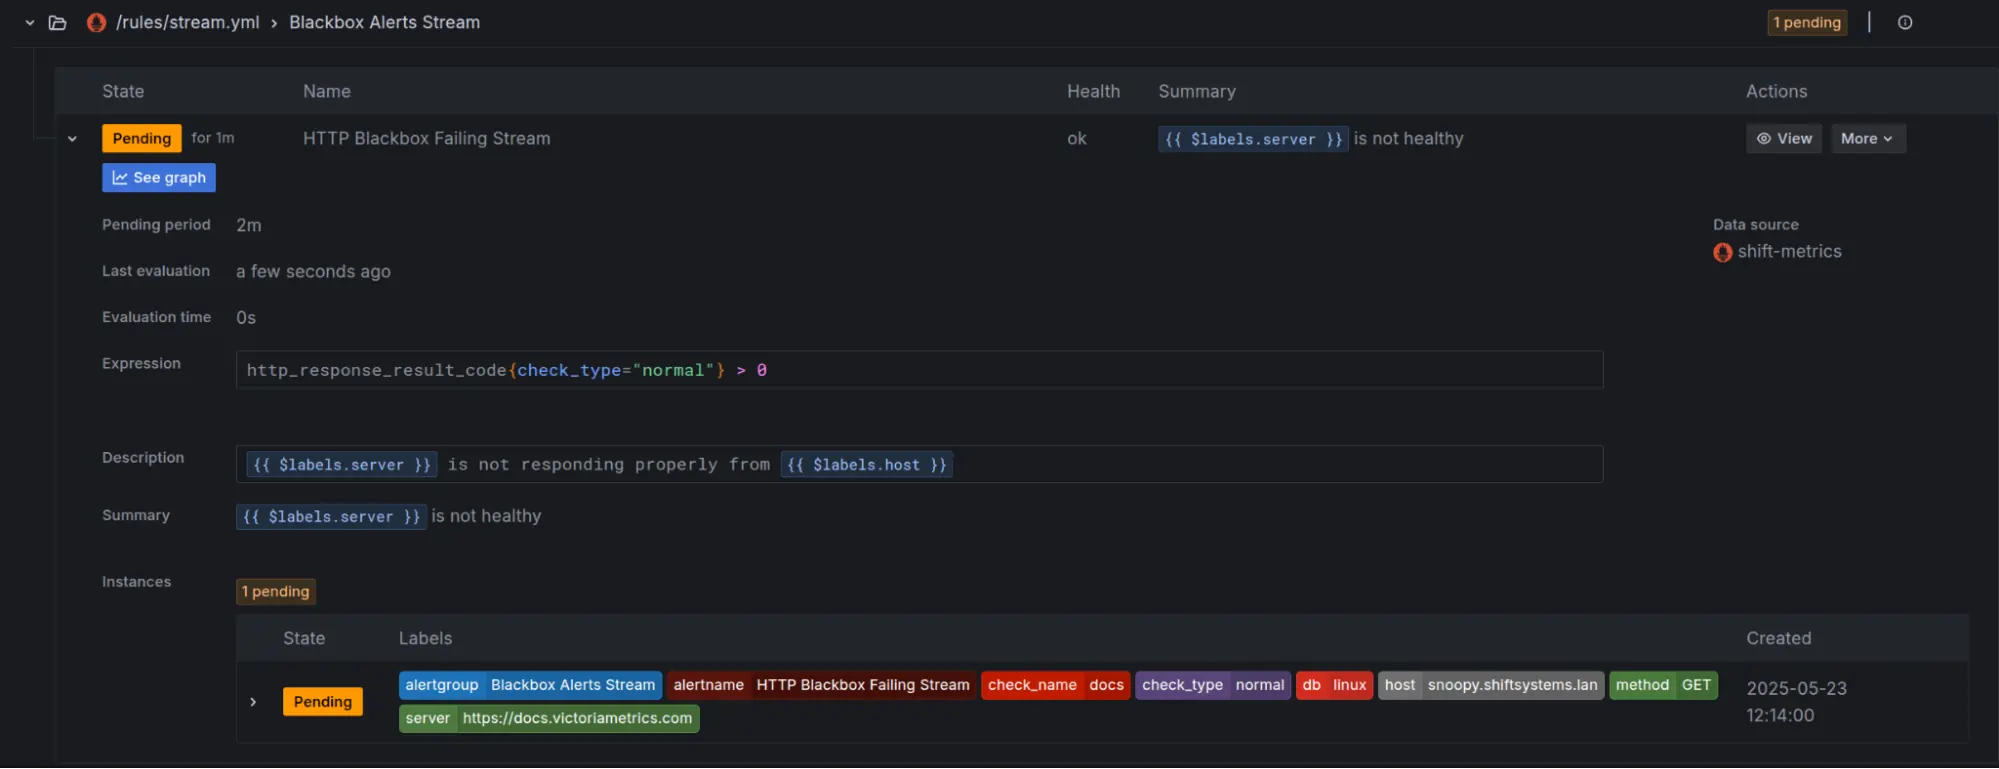
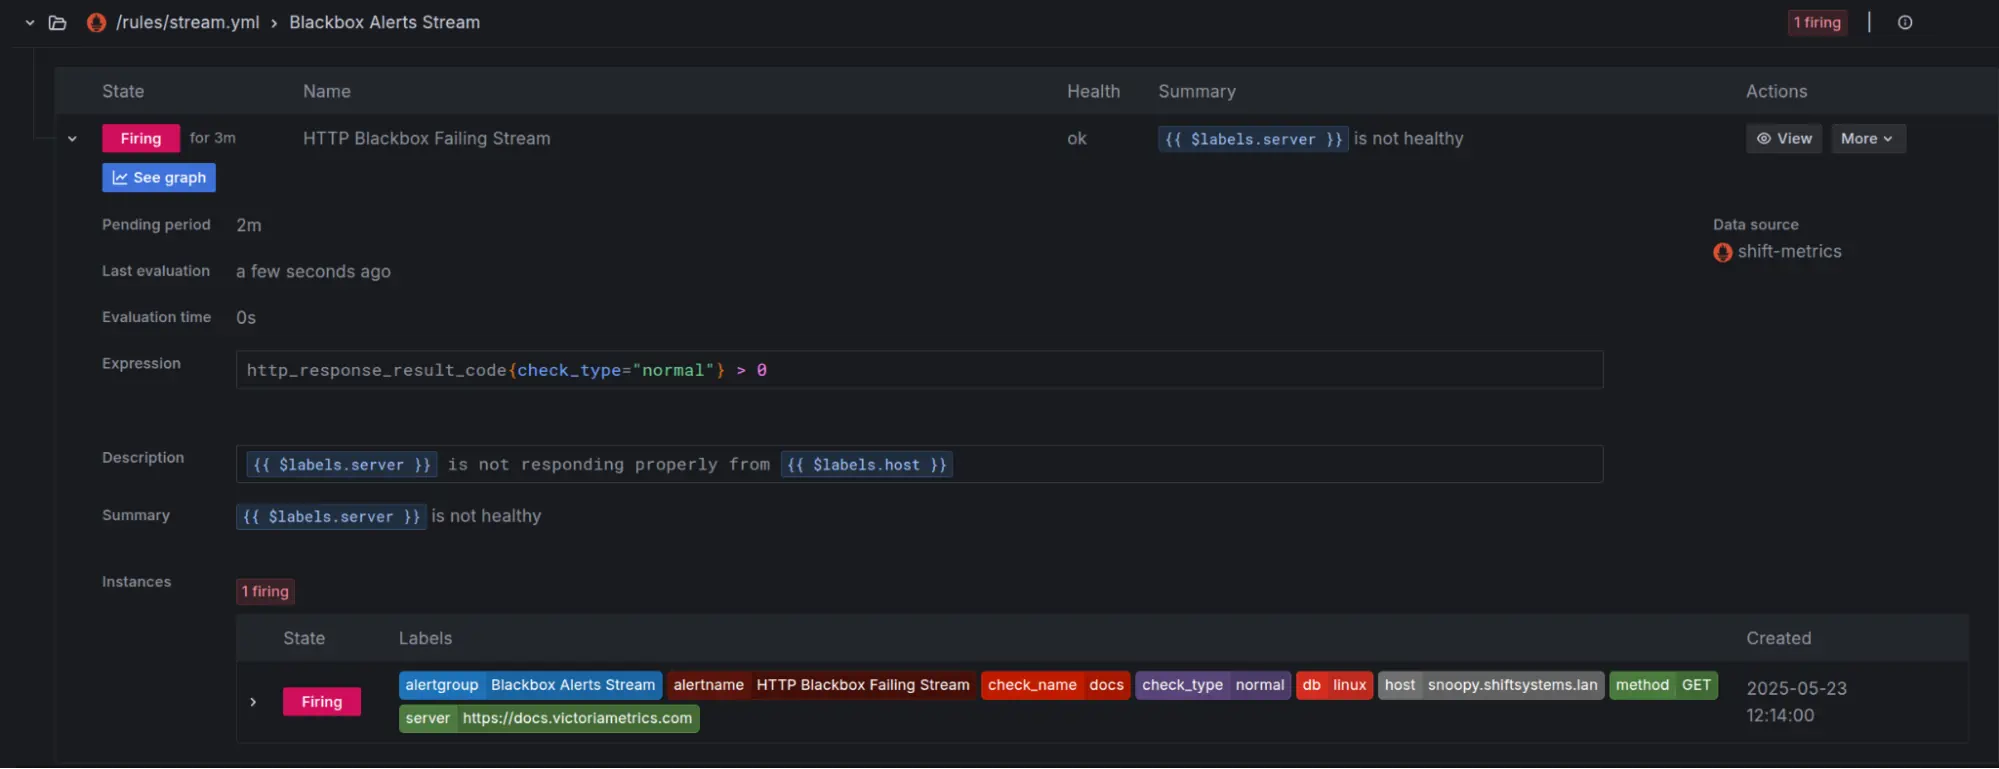
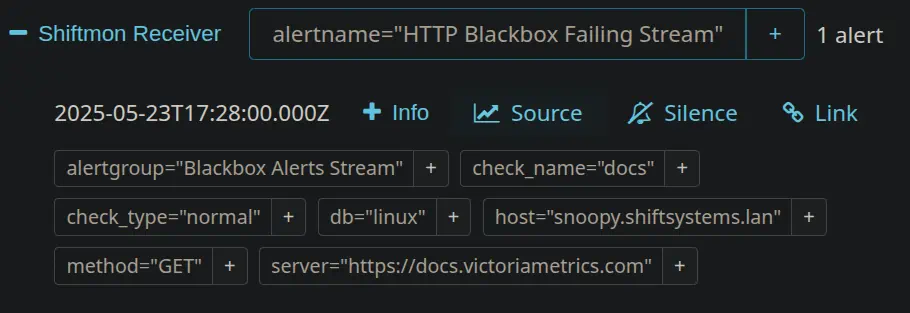
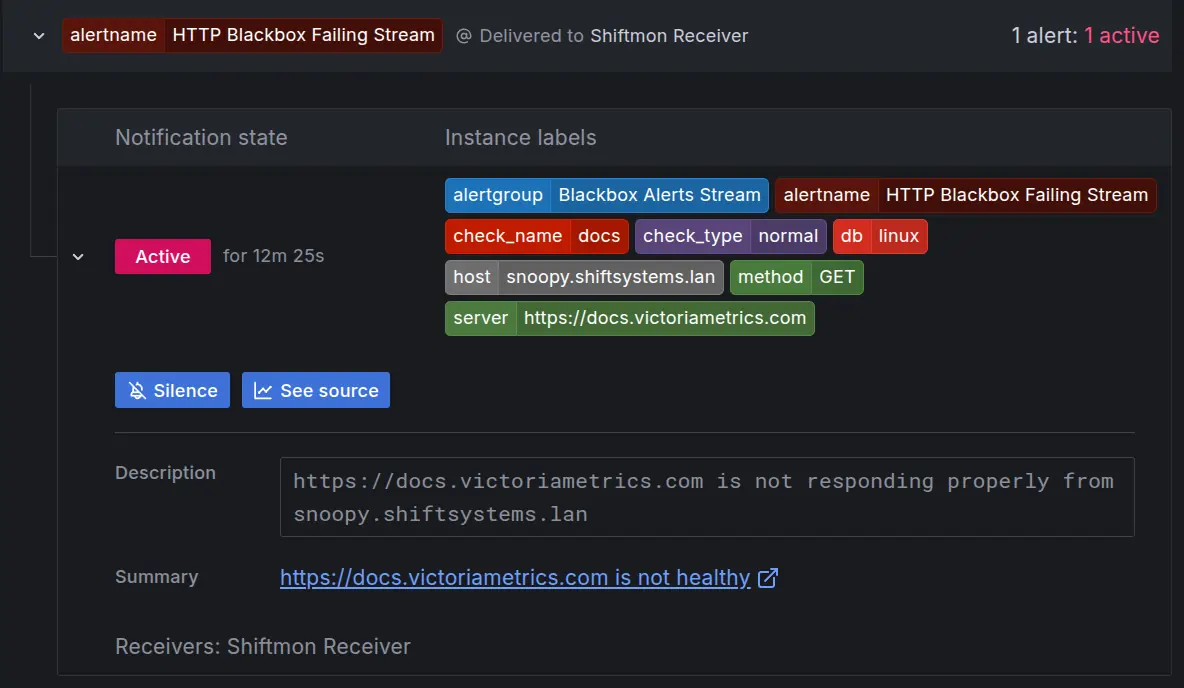
One seriously powerful and somewhat unique feature of vmalert in the VictoriaMetrics world is its ability to backfill recording rules.
What’s Backfilling? Imagine you had an SLO (Service Level Objective) recording rule that was, oops, a bit broken, and you were missing accurate data for a few days. Backfilling lets you tell vmalert to re-evaluate those recording rules for that specific historical period.
How It Works: You can run vmalert with special flags (-replay.timeStart, -replay.timeEnd) to make it re-crunch the numbers against your historical data. VictoriaMetrics is a champ at ingesting this backfilled data efficiently, no matter the timestamp, without any performance hits.
Here’s an example of how Mathias invoked vmalert for backfilling:
#!/bin/bash
docker run  -v ./stream.yaml:/etc/vmalert/stream.yaml \
quay.io/victoriametrics/vmalert:v1.118.0 /vmalert-prod \
 -rule=/rules/stream.yml \
 -datasource.url=http://victoriametrics:8428 \
 -remoteWrite.url=http://victoriametrics:8428 \
 -replay.timeFrom=2025-05-00T00:00:00Z
(Based on the command structure Mathias was building and explaining) Make sure the rule file (stream.yaml in this case) contains the corrected recording rule.
Important Note on Data: As Roman, one of VictoriaMetrics’ co-founders, clarified during the Tech Talk, backfilling a recording rule writes a new time series with that recording rule’s name for the period you specify. It doesn’t go back and change an existing time series. If the rule was missing or wrong for that past period, this new series will hold the historically accurate calculations. If some data for that rule and period already existed, VictoriaMetrics’ deduplication smarts might come into play.
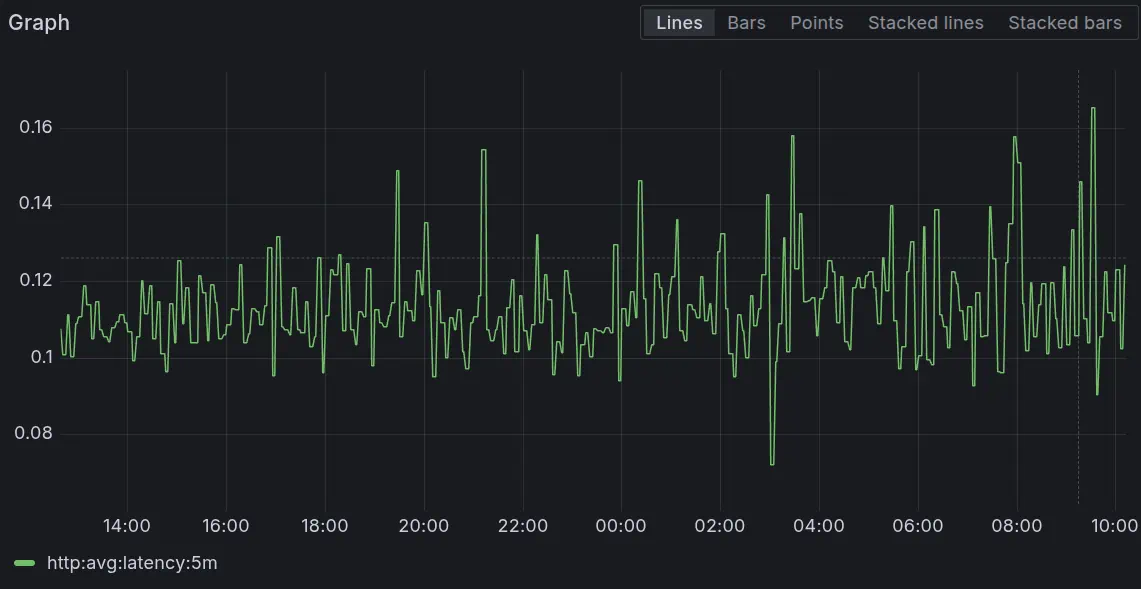
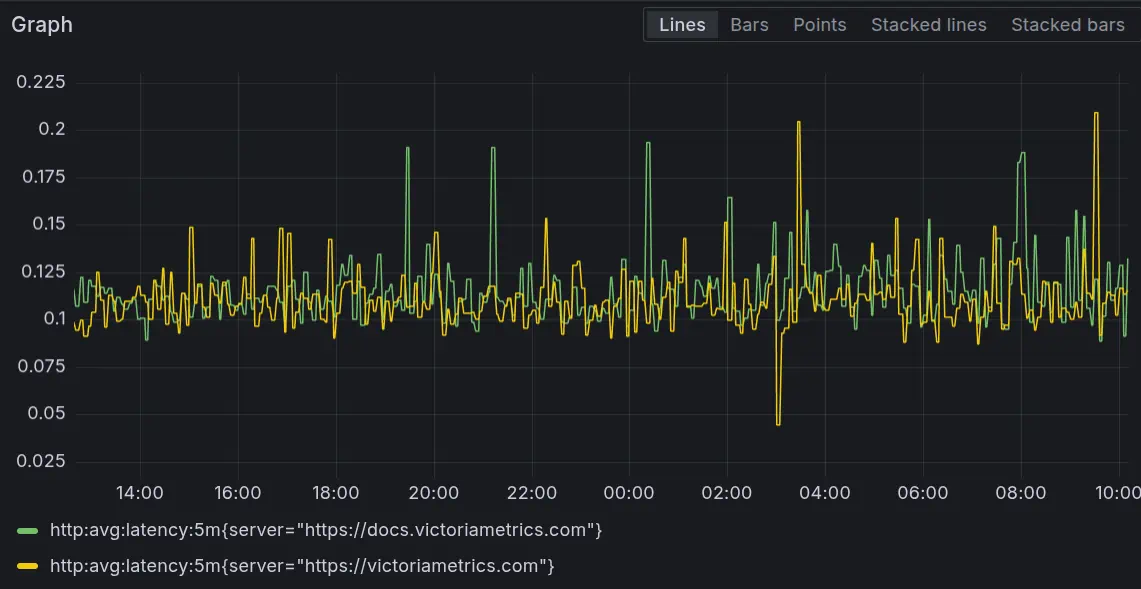
Mathias showed this by fixing a recording rule for http_average_latency. Initially, it was missing a by operation, causing it to incorrectly sum up latencies instead of averaging them per instance.
Original (broken) rule might have looked like:
 - name: Blackbox SLO
   interval: 5m
   type: prometheus
   rules:
     - record: http:avg:latency:5m
       expr: 'avg(http_response_response_time[5m])'
Corrected rule (added by (instance, job) so the SLO is calculated per website instead of across all websites):
 - name: Blackbox SLO
   interval: 5m
   type: prometheus
   rules:
     - record: http:avg:latency:5m
       expr: 'avg(http_response_response_time[5m]) by (server)'
By running vmalert in replay mode with the corrected rule, he successfully generated the missing, accurate historical data. [cite: 520, 521]
For those who prefer a managed solution, VictoriaMetrics Cloud offers a super smooth way to set up alerting without needing to manage the vmalert and Alertmanager infrastructure yourself. Jose gave us a great walkthrough of this “easy button” approach:
Get Started: First, you create a VictoriaMetrics instance in the Cloud. For the demo, a small, single-node instance did the trick.
Send Your Data: Metrics can come from all sorts of places. Jose used an OpenTelemetry collector running in a Kubernetes cluster. The VictoriaMetrics Cloud UI is really helpful here, providing configuration snippets, including the endpoint URL and access token, to get your collectors sending data quickly.
Jose even showed how his OpenTelemetry collector was configured to send metrics to both a local VictoriaMetrics instance and his new VictoriaMetrics Cloud instance.
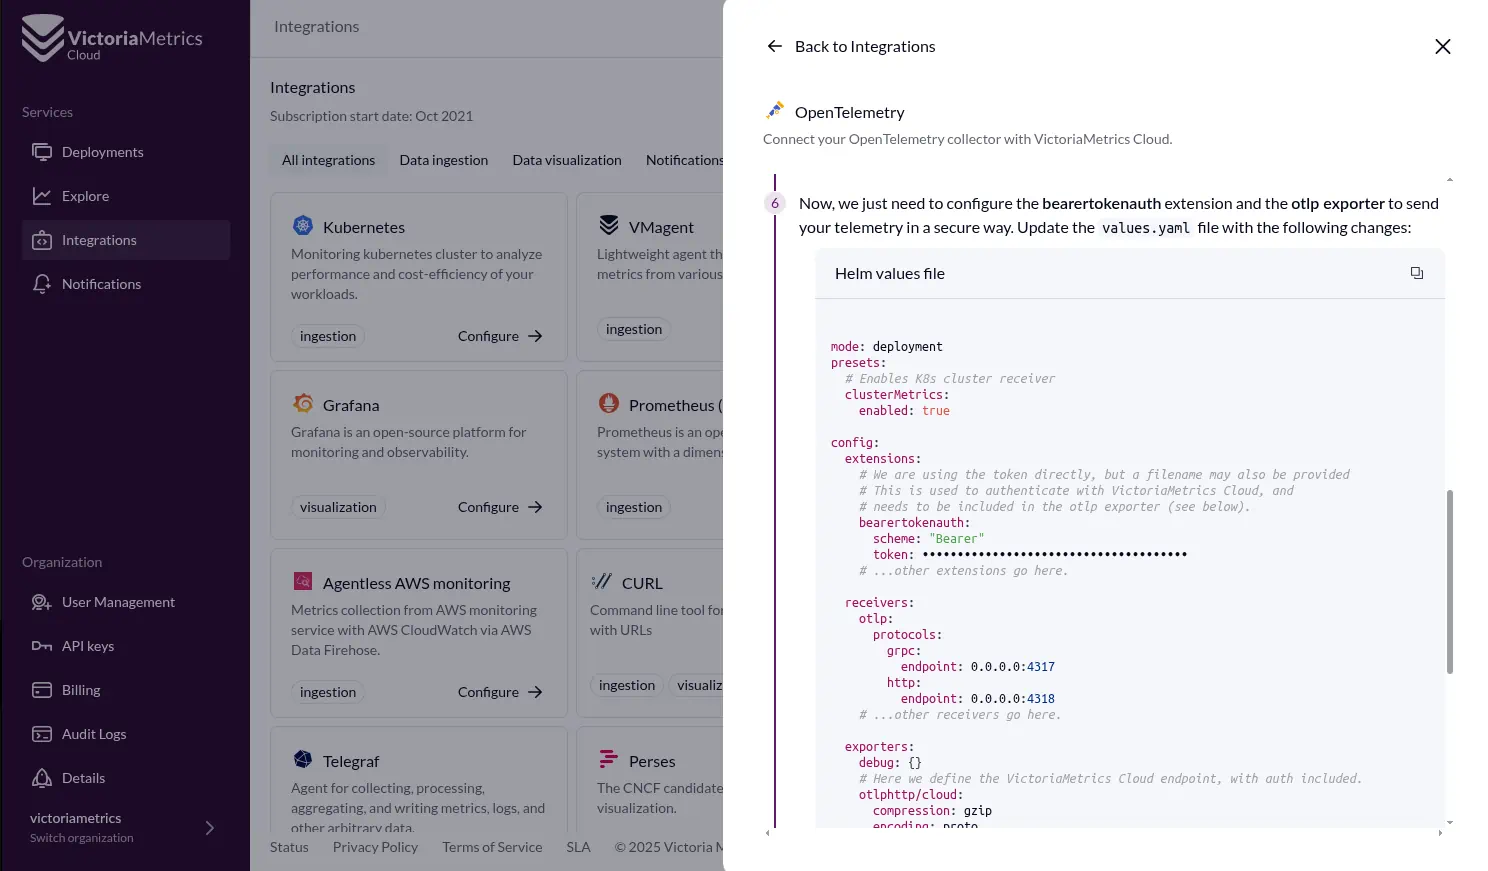
A snippet of the OpenTelemetry collector config (values.yaml for Helm) Jose used:
# otel-collector-config.yaml (simplified example)
exporters:
  otlphttp/to_vmcloud:
    endpoint: "YOUR_VICTORIAMETRICS_CLOUD_OTLP_HTTP_ENDPOINT" # [cite: 297, 302]
    headers:
      Authorization: "Bearer YOUR_ACCESS_TOKEN" # [cite: 297, 302]
# ... other collector configurations ...
service:
  pipelines:
    metrics:
      receivers: [otlp] # Or your specific receiver
      processors: [batch] # Or your processors
      exporters: [otlphttp/to_vmcloud] # Add other exporters if needed [cite: 307]
(Based on Jose’s description of configuring the OTel collector to send to VM Cloud)
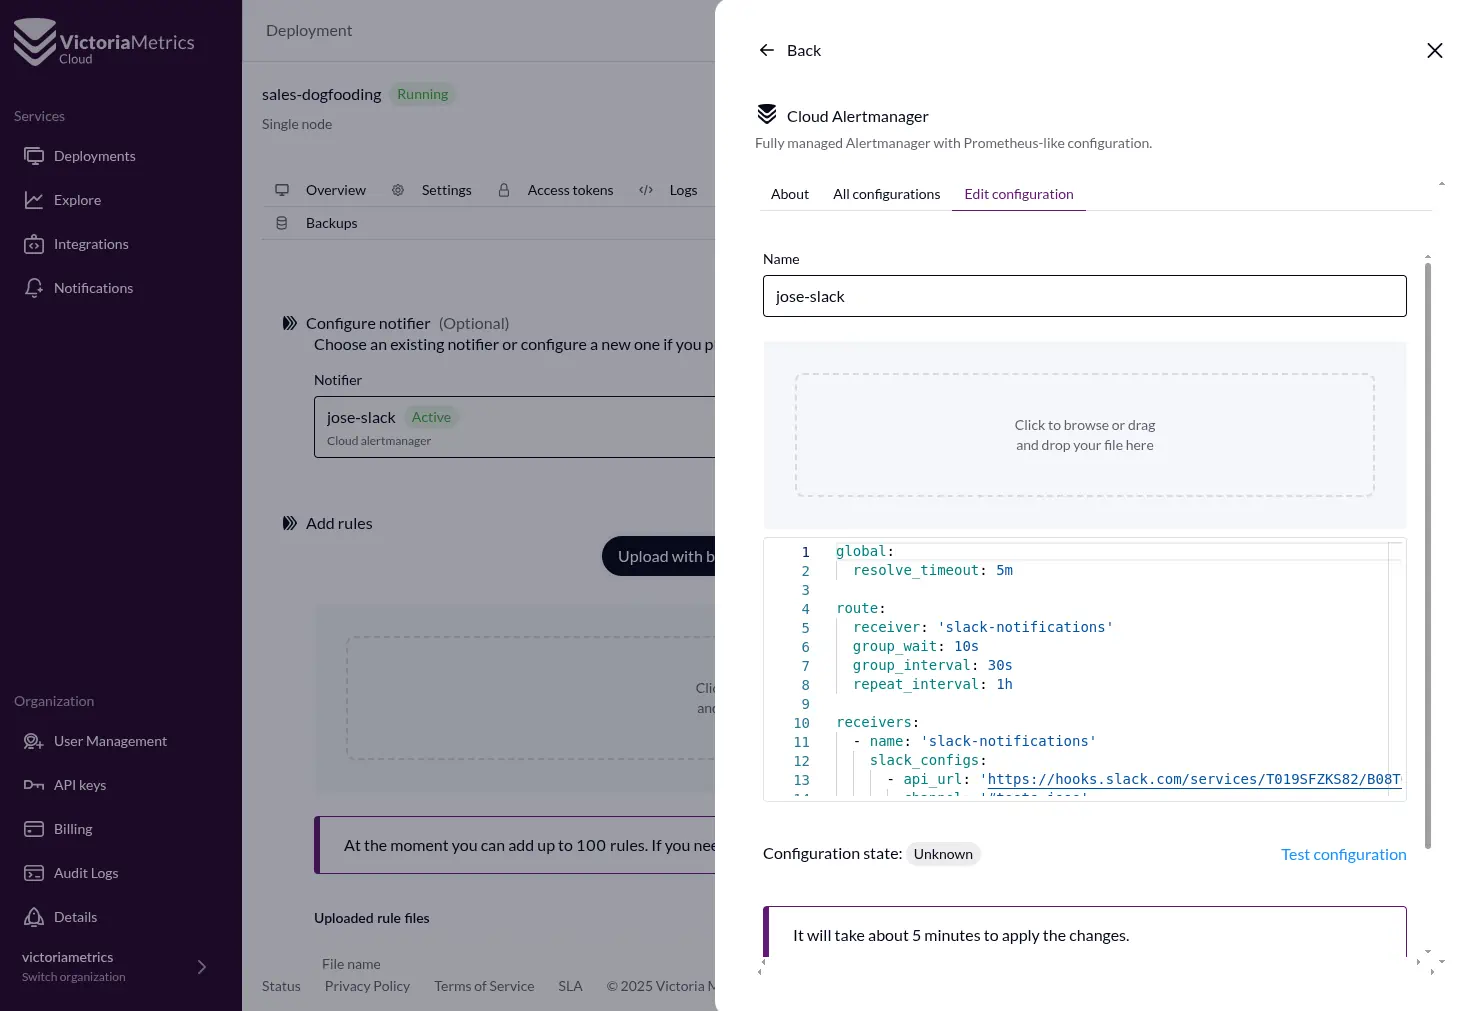
Create Alert Rules:
Use the Explorer (which is the VMUI - VictoriaMetrics User Interface) right within the Cloud console to browse your metrics and build the PromQL query for your alert. The Cardinality Explorer is also a gem here for understanding what metrics you actually have available.
For his demo, Jose wanted an alert if a specific Kubernetes deployment (my-server-mock) became unavailable. He cleverly used the query: absent(kube_deployment_status_replicas_available{deployment="my-server-mock"}). This query only returns a value (and thus can trigger an alert) when the specified metric isn’t there.
The alert rule, defined in a YAML file (just like for self-managed vmalert), is then uploaded via the Cloud UI.
groups:
  - name: server-mock-availability
    rules:
    - alert: ServerMockUnavailable
      expr: absent(k8s.deployment.available{k8s.deployment.name="server-mock"} == 1)
      for: 10s
      labels:
        severity: critical
      annotations:
        summary: "Deployment 'server-mock' is not available"
        description: "The deployment 'server-mock' has zero or no available replicas."
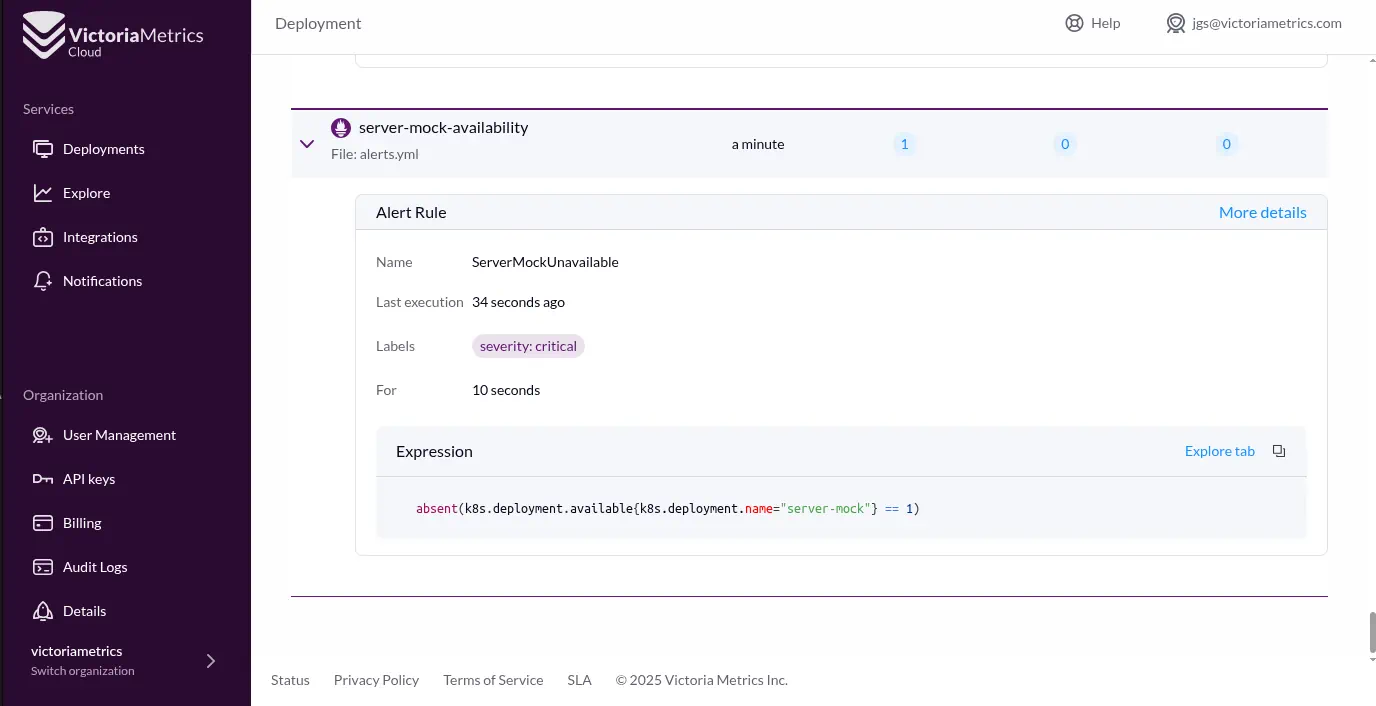
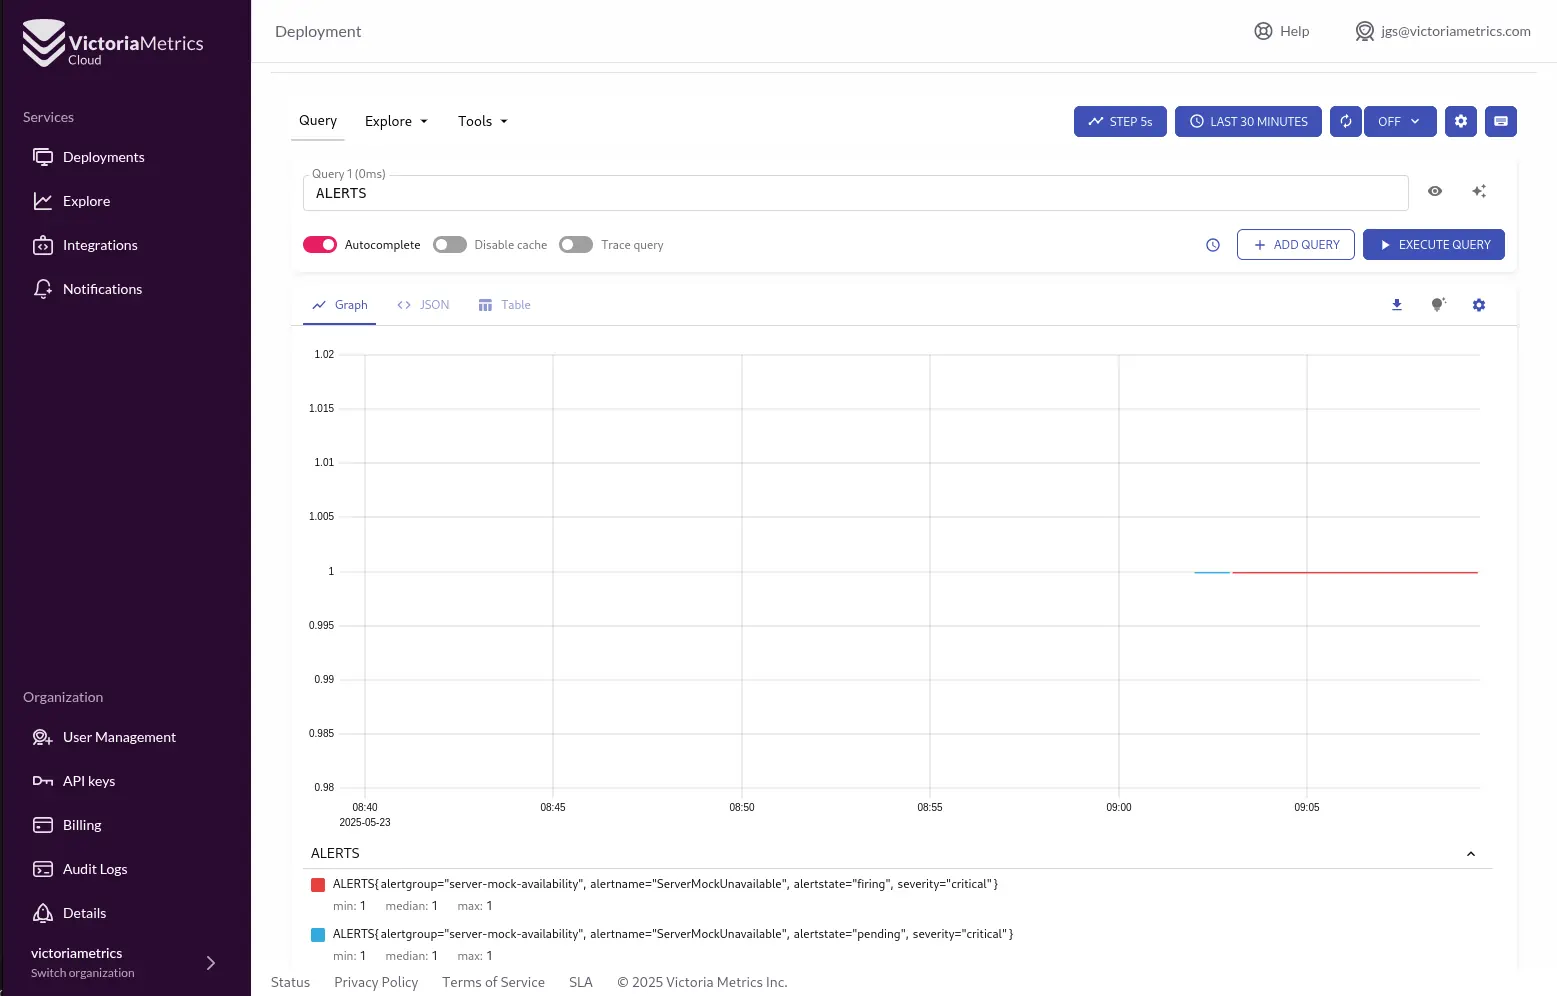
The big win here is Simplicity: VictoriaMetrics Cloud handles the tricky bits of the alerting stack, letting you focus on defining alerts that make sense for your services. Plus, the team is always working to make the alerting UI and overall experience even better on the Cloud platform.
Nail Your Query Logic: The smarts of your alert come from its query. Make sure your expressions truly capture the failure conditions you care about. As Jose found out, sometimes absent() is exactly what you need!
Embrace the for Clause: Use that for duration wisely to cut down on noise and alert fatigue. Let transient blips resolve themselves before your phone starts buzzing.
Recording Rules are Your Friends: For complex or frequently used queries, especially if they’re derived from logs, use recording rules. It boosts performance for both alerting and dashboards and can ease the query load on your database.
Prefer Datasource-Managed Alerts (with Grafana): When using Grafana, it’s generally a good idea to use rules managed by your data source (like vmalert) instead of Grafana-managed alerts. This keeps your architecture simpler and often scales better, since vmalert is stateless and stores alert states as metrics right within VictoriaMetrics.
Pick the Right Notification Channels: Not all alerts are born equal. Use critical channels like PagerDuty, the open-source Ntfy (which Mathias used ), or our partner iLert for things that need eyeballs now. Slack or email might be fine for less urgent heads-ups.
Monitor Everything, Even the Network Closet: As Mathias showed with his home network dashboard (using SNMP data via Telegraf into VictoriaMetrics), you can – and should – extend your monitoring to all critical pieces of your infrastructure.
Whether you’re captaining a self-managed VictoriaMetrics ship or cruising with the convenience of VictoriaMetrics Cloud, getting comfortable with vmalert is your ticket to proactive, effective monitoring. The power to define precise recording and alerting rules helps you stay ahead of trouble and keep your services reliable.
We definitely encourage you to check out the official vmalert documentation for even more details.
And if you’re curious about VictoriaMetrics Cloud, why not give our free trial a spin and see how easy managed alerting can be?
Your feedback is gold to us. Join our community, share what you’re building, and let us know how we can make VictoriaMetrics even more awesome!
Happy monitoring!
Sources
此内容由惯性聚合(RSS阅读器)自动聚合整理,仅供阅读参考。 原文来自 — 版权归原作者所有。