


惯性聚合 高效追踪和阅读你感兴趣的博客、新闻、科技资讯
阅读原文 在惯性聚合中打开

推荐订阅源

Threat Intelligence Blog | Flashpoint
Hacker News - Newest:
Hacker News - Newest: "LLM"
cs.AI updates on arXiv.org
L
LINUX DO - 最新话题
Cloudbric
Cloudbric
N
News and Events Feed by Topic
S
Secure Thoughts
Vercel News
Vercel News
S
Security @ Cisco Blogs
让小产品的独立变现更简单 - ezindie.com
S
SegmentFault 最新的问题
Hacker News: Ask HN
Hacker News: Ask HN
博客园 - 聂微东
WordPress大学
WordPress大学
Google Online Security Blog
cs.CV updates on arXiv.org
Application and Cybersecurity Blog
Google DeepMind News
PCI Perspectives
PCI Perspectives
雷峰网
雷峰网
Hugging Face - Blog
Hugging Face - Blog
Blog — PlanetScale
Blog — PlanetScale
Apple Machine Learning Research
C
CXSECURITY Database RSS Feed - CXSecurity.com
T
Threat Research - Cisco Blogs
博客园 - 司徒正美
Exploit-DB.com RSS Feed
A
About on SuperTechFans
P
Proofpoint News Feed
大猫的无限游戏
大猫的无限游戏
V
V2EX
I
Intezer
H
Hacker News: Front Page
www.infosecurity-magazine.com
L
Lohrmann on Cybersecurity
F
Fortinet All Blogs
Schneier on Security
博客园 - 叶小钗
The Cloudflare Blog
月光博客
月光博客
W
WeLiveSecurity
T
Tenable Blog
P
Proofpoint News Feed
aimingoo的专栏
aimingoo的专栏
Help Net Security
Help Net Security
L
LangChain Blog
C
CERT Recently Published Vulnerability Notes
T
The Exploit Database - CXSecurity.com
美团技术团队
B
Blog

VictoriaMetrics: Simple & Reliable Monitoring for Everyone on VictoriaMetrics

Operator now has Long-Term Support (LTS) version Multi-tiered Observability: A Practical Way to Handle Diverse Workloads VictoriaMetrics April 2026 Ecosystem Updates Not All Telemetry Requires Premium Pricing VictoriaMetrics at KubeCon Amsterdam: Community Highlights What's new in VictoriaMetrics Anomaly Detection (Q1 2026) What's New in VictoriaMetrics Cloud Q1 2026? Logs, MCP Server, Better Alerting, and... a Secret Project VictoriaMetrics at KubeCon: Optimizing Tail Sampling in OpenTelemetry with Retroactive Sampling VictoriaMetrics March 2026 Ecosystem Updates Observability Lessons From OpenAI Benchmarking Kubernetes Log Collectors: vlagent, Vector, Fluent Bit, OpenTelemetry Collector, and more VictoriaMetrics February 2026 Ecosystem Updates VictoriaMetrics at FOSDEM, Cloud Native Days France, and CfgMgmtCamp Ghent VictoriaLogs in VictoriaMetrics Cloud: Fast, Cost-Effective Log Management is Here What’s new in VictoriaMetrics Anomaly Detection (2025) VictoriaMetrics January 2026 Ecosystem Updates VictoriaLogs Basics: What You Need to Know, with Examples & Visuals What's New in VictoriaMetrics Cloud Q4 2025? New tiers, more deployment options, IaC and alerting rules. Vibe coding tools observability with VictoriaMetrics Stack and OpenTelemetry How a US Software Provider Improved Traffic Alerting with VictoriaMetrics Anomaly Detection VictoriaMetrics 2025 Developer Experience: A Year in Review Spotify’s performance & control across large monitoring environments with VictoriaMetrics VictoriaMetrics Achieves Red Hat OpenShift Operator Certification Our latest updates across the VictoriaMetrics Observability ecosystem New Capacity Tiers in VictoriaMetrics Cloud Announcing 1B+ Downloads & Product Development With Logs, Traces, Metrics AI Agents Observability with OpenTelemetry and the VictoriaMetrics Stack Discarding gRPC-Go: The Story Behind OTLP/gRPC Support in VictoriaTraces What's New in VictoriaMetrics Cloud Q3 2025? From new region in Asia to proactive alerts How DreamHost Slashed Memory Usage by 80% and Scaled to 76 Million Time Series Upcoming Conferences & Meetups: Where to Meet Our Team VictoriaMetrics Long-Term Support (LTS): H2 2025 Update Creating a Sustainable Open Source Business Model - Introduction Full-Stack Observability with VictoriaMetrics in the OTel Demo Alerting Best Practices vmanomaly Deep Dive: Smarter Alerting with AI (Tech Talk Companion) VictoriaLogs Practical Ingestion Guide for Message, Time and Streams Monotonic and Wall Clock Time in the Go time package Hello Singapore! VictoriaMetrics Cloud Expands to Asia Pacific MCP Server Integration & Much More: What's New in VictoriaMetrics Cloud Q2 2025 FIPS 140-3 Compatible Builds for VictoriaMetrics Enterprise Components VictoriaLogs Unleashed: Cluster Version Now Available for Exceptional, Linear Scaling Developer's Note: Research on Distributed Tracing, Comparing With Tempo and ClickHouse vmagent: Key Features Explained in Under 15 Minutes Go synctest: Solving Flaky Tests vmalert: Maximize Your Monitoring (Tech Talk Companion) Celebrating 14K Stars on GitHub: Spring Update vmalert: Maximize Your Monitoring VictoriaMetrics Connects with the Open Source Community at LinuxFest Northwest 2025 Graceful Shutdown in Go: Practical Patterns VictoriaLogs: Gaps, Gains & Growth Prometheus Monitoring: Functions, Subqueries, Operators, and Modifiers VictoriaMetrics Cloud: What's New in Q1 2025? Don’t default to microservices: You’ll thank us later! Container CPU Requests & Limits Explained with GOMAXPROCS Tuning gRPC in Go: Streaming RPCs, Interceptors, and Metadata From Chaos to Clarity with VictoriaLogs Prometheus Alerting 101: Rules, Recording Rules, and Alertmanager Heading to London: Meet Our Team at KubeCon Europe 2025 Inside vmselect: The Query Processing Engine of VictoriaMetrics Meet Our Team at Scale 22x Practical Protobuf - From Basic to Best Practices VictoriaLogs Status Update: Heading Towards the Cluster Version 24th of February 2025 Statement: VictoriaMetrics Stands with Ukraine! Prometheus Metrics Explained: Counters, Gauges, Histograms & Summaries Prometheus Monitoring: Instant Queries and Range Queries Explained 300%+ Growth in 2024: Join Our Team in 2025! FOSDEM 2025 recap How Protobuf Works—The Art of Data Encoding OpenTelemetry, Prometheus, and More: Which Is Better for Metrics Collection and Propagation? How vmstorage Handles Query Requests From vmselect How vmstorage's IndexDB Works VictoriaMetrics Tech Talk Stream: A Deep Dive into Blackbox Monitoring How HTTP/2 Works and How to Enable It in Go VictoriaMetrics Cloud: What's New in Q4 2024? How vmstorage Processes Data: Retention, Merging, Deduplication,... How vmstorage Handles Data Ingestion From vminsert When Metrics Meet vminsert: A Data-Delivery Story From net/rpc to gRPC in Go Applications VictoriaMetrics helps IHI Terrasun Win Big in Vegas on $1.2B Clean Energy Project Piros | VictoriaMetrics Partner Allenta | VictoriaMetrics Partner CloudRaft | VictoriaMetrics Partner Sensedia & VictoriaMetrics: API-compatible Efficient Storage Scalable Prometheus: Why DSV Chose VictoriaMetrics Sensor Factory | VictoriaMetrics Partner Erythix | VictoriaMetrics Partner Groove X & VictoriaMetrics: Faster Device Health Monitoring Scaled & Performant Monitoring at Spotify with VictoriaMetrics Grammarly & VictoriaMetrics: 10× Lower Costs & Direct Access Zelarsoft | VictoriaMetrics Partner DFKI & VictoriaMetrics: Efficient Long-Term Metric Storage Niubits | VictoriaMetrics Partner Megazone Cloud | VictoriaMetrics Partner Cogito Software | VictoriaMetrics Partner Bajau | VictoriaMetrics Partner Find Out Why Dig Security Chose VictoriaMetrics! Ness | VictoriaMetrics Partner Alpha Data | VictoriaMetrics Partner SIOS Technology | VictoriaMetrics Partner
Integrations made easy with VictoriaMetrics Cloud
Jose Gomez-Selles / Alexander Marshalov · 2025-06-10 · via VictoriaMetrics: Simple & Reliable Monitoring for Everyone on VictoriaMetrics

VictoriaMetrics Cloud continues to evolve as the most efficient, scalable and open platform in the observability landscape. In our last Q1 update blogpost, we shared new features such as seamless OpenTelemetry integrations, new Organizations support, and improvements in the Explore UI and APIs.

This time we wanted to take a minute to showcase how we’re taking the interoperability journey very seriously.
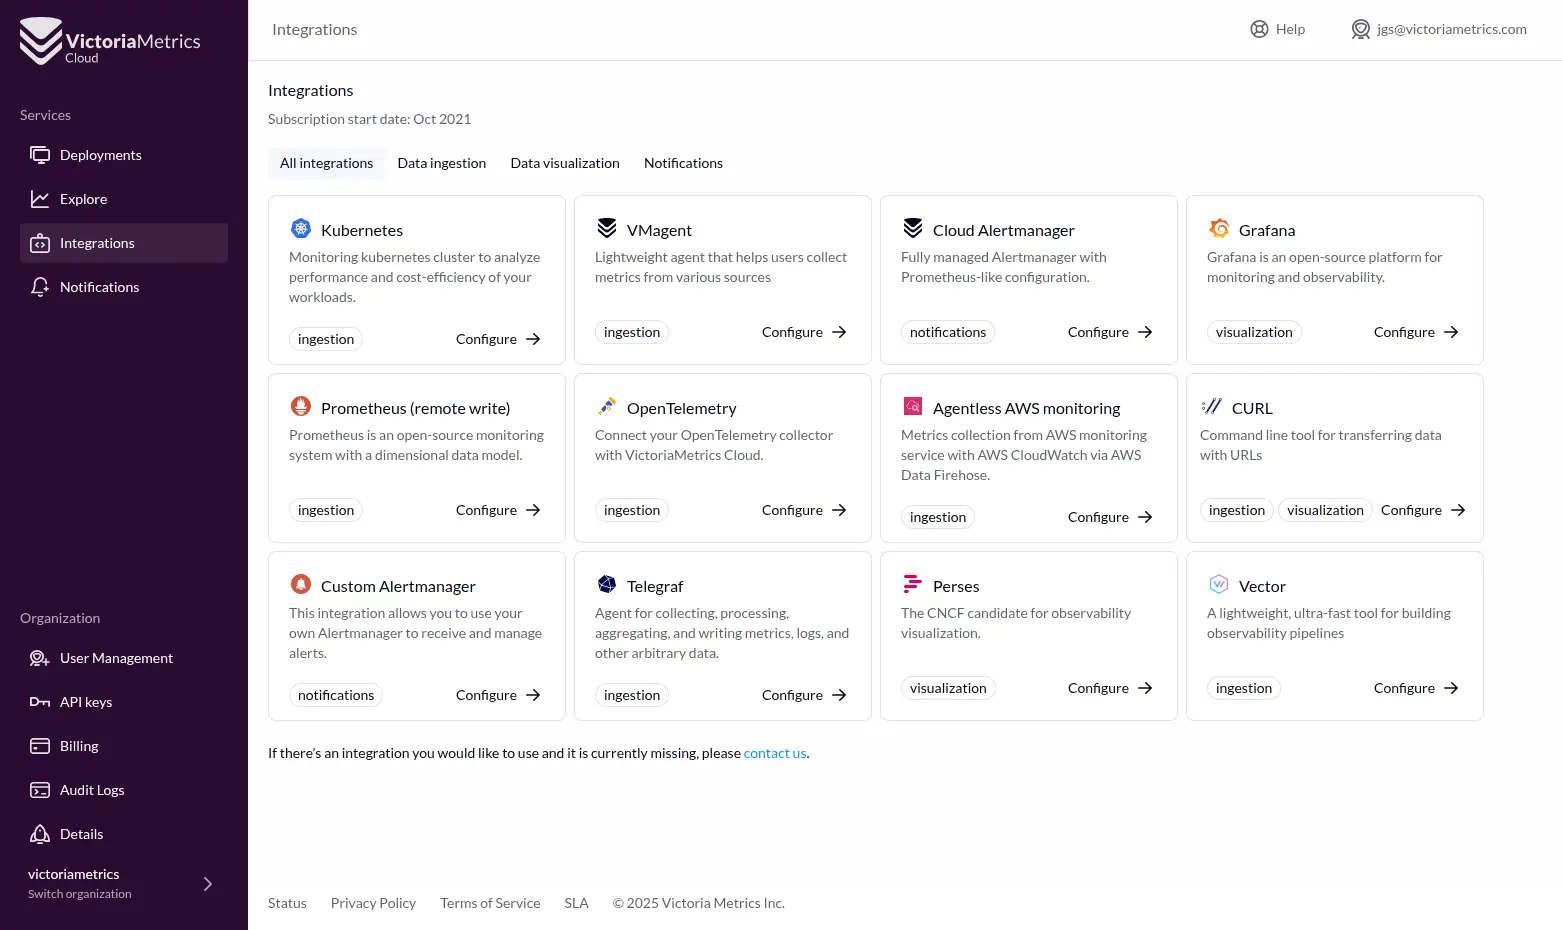
Integrations in VictoriaMetrics Cloud Integrations in VictoriaMetrics Cloud

Sign up for free — no credit card required — and get $200 in credits for one month.

Integrations in VictoriaMetrics Cloud

#

VictoriaMetrics has always focused on openness and interoperability. Whether you’re collecting data from Prometheus, OpenTelemetry, Graphite, or pushing metrics through any observability stack — we don’t force any tools on you. This unopinionated approach truly ensures you avoid vendor lock-in and fit VictoriaMetrics into your existing workflows.

The newly published integrations documentation demonstrates just how easy it is to integrate your systems. Once you select a deployment, all the instructions — from sending metrics to visualizing them — are generated for you with the correct URL and token.

To get started, all you need is a URL and an Access Token.

Integrate With Everything

#

All integrations come with interactive, step-by-step guides available in the VictoriaMetrics Cloud Console, tailored for your real deployments. This includes copy-paste-ready snippets with all required settings in place.

You can check it out directly in our revamped integrations documentation and experience how, with a couple of clicks in the VictoriaMetrics Cloud Console you can get started with real-world integration snippets customized for your deployments.

VictoriaMetrics Cloud supports integration across the entire observability lifecycle:

Ingestion

#

  • CloudWatch - Agentless AWS monitoring integration allows to forward metrics from AWS services (like EC2, RDS, Lambda, etc.) to VictoriaMetrics Cloud without deploying extra collectors or agents.
  • CURL can be used to interact with VictoriaMetrics Cloud for pushing metrics using HTTP API endpoints.
  • Kubernetes: collect metrics from cluster, nodes, and workloads, and forward them to VictoriaMetrics Cloud using vmagent.
  • OpenTelemetry Collector (using either the Helm chart or the Operator) to collect, process, and forward observability data from a wide variety of sources into VictoriaMetrics Cloud.
  • Prometheus (remote write), allows forwarding metrics collected by Prometheus to VictoriaMetrics Cloud for long-term storage and advanced querying.
  • Telegraf integration is ideal for environments where Telegraf is already used to gather system, application, or custom metrics.
  • If you are using Vector, this integration is useful to route metrics to VictoriaMetrics Cloud for storage and analysis.
  • vmagent is a lightweight agent designed to collect metrics from various sources, apply relabeling and filtering rules, and forward the data to storage systems. It supports both the Prometheus remote_write protocol and the VictoriaMetrics remote_write protocol for sending data. This makes vmagent ideal for centralized metric collection and forwarding in a resource-efficient way.

Visualization

#

  • VictoriaMetrics Cloud can easily be added as a datasource to Grafana, via the built-in Prometheus or VictoriaMetrics datasources. This integration allows you to build powerful, customizable dashboards and monitor your systems in real time using VictoriaMetrics as the backend.
  • Perses: VictoriaMetrics Cloud can be used as a data source in Perses via the Prometheus-compatible query API, allowing you to create dashboards and monitor time series data with a modern and lightweight interface.
  • CURL, can also be used for querying stored data using HTTP API endpoints. This makes it a simple and flexible option for testing or basic integrations.

Alerts & Notifications

#

  • Cloud AlertManager: VictoriaMetrics Cloud comes with a fully managed AlertManager based on vmalert, which can be used to send notifications. This integration provides a seamless way to trigger alerts based on Prometheus-compatible queries and route them to your preferred notification channels, such as email, PagerDuty, Slack, MS Teams or webhooks.
  • If you already have a Custom AlertManager VictoriaMetrics Cloud allows you to define and manage alerting rules using to your instance. This integration provides full flexibility for organizations that already operate their own AlertManager setup and want to connect it to VictoriaMetrics Cloud’s alerting engine.

Example: Integrate Kubernetes with VictoriaMetrics Kubernetes Stack

#

As already mentioned, if you are curious about how easy it is to integrate with VictoriaMetrics Cloud, we encourage you to visit our docs to experience by yourself. However, here’s a brief example of what it takes for one of the most used integrations: Monitoring Kubernetes via the VictoriaMetrics Kubernetes Stack: a Helm chart that brings together all the key components to collect and push metrics to VictoriaMetrics Cloud if you are starting from zero.

This stack includes:

  • vmagent to collect and forward metrics.
  • Prebuilt dashboards and alerts to get started quickly in observability.
  • Easy setup using just your <DEPLOYMENT_ENDPOINT_URL> and <YOUR_ACCESS_TOKEN>.

Integrating Kubernetes with VictoriaMetrics Cloud Integrating Kubernetes with VictoriaMetrics Cloud

Three steps to observe:

#

  1. Create a Secret with your VictoriaMetrics Cloud Access Token:
kubectl create secret generic vmauth-creds \
  --from-literal=VMAUTH_TOKEN='<YOUR_ACCESS_TOKEN>'
  1. Update the values.yaml with your endpoint and credentials:
vmagent:
  remoteWrite:
    - url: https://<DEPLOYMENT_ENDPOINT_URL>/api/v1/write
      headers:
        Authorization: "Bearer $VMAUTH_TOKEN"
  1. Install the Helm chart:
helm repo add victoria-metrics https://victoriametrics.github.io/helm-charts/
helm upgrade --install vm-stack victoria-metrics/victoria-metrics-k8s-stack \
  -f values.yaml

After that, your cluster metrics will be flowing into VictoriaMetrics Cloud, with dashboards and alerts ready to go!

Many Ways to Adapt to Your Needs

#

But this is not the only way to ingest Kubernetes metrics! As highlighted in our Q1 blog post, VictoriaMetrics is fully committed to OpenTelemetry as a first-class citizen in our observability stack.

You can monitor your Kubernetes cluster using OpenTelemetry as well, either via the Helm chart or the OpenTelemetry Operator. Explore our OpenTelemetry integration docs or try the guided setup in the Cloud Console.

Integrating Kubernetes using OpenTelemetry with VictoriaMetrics Cloud Integrating Kubernetes using OpenTelemetry with VictoriaMetrics Cloud

Last reminder (promised!): as every integration with VictoriaMetrics Cloud, you’ll only need a URL and an Access Token to connect your data source or visualization tool — no guesswork needed!

Help Us Improve

#

We’re always looking to make VictoriaMetrics Cloud better. Please take a moment to fill out our quick survey and share your feedback.

Thanks for being part of our community! We hope these improvements make your integration journey smoother than ever. As always, sign up to try everything for free with $200 credits — no credit card required.