


惯性聚合 高效追踪和阅读你感兴趣的博客、新闻、科技资讯
阅读原文 在惯性聚合中打开

推荐订阅源

Security Archives - TechRepublic
博客园 - Franky
U
Unit 42
有赞技术团队
有赞技术团队
P
Proofpoint News Feed
H
Hackread – Cybersecurity News, Data Breaches, AI and More
量子位
博客园 - 【当耐特】
罗磊的独立博客
B
Blog
Stack Overflow Blog
Stack Overflow Blog
F
Fortinet All Blogs
爱范儿
爱范儿
The Cloudflare Blog
Engineering at Meta
Engineering at Meta
Hugging Face - Blog
Hugging Face - Blog
freeCodeCamp Programming Tutorials: Python, JavaScript, Git & More
腾讯CDC
月光博客
月光博客
酷 壳 – CoolShell
酷 壳 – CoolShell
A
About on SuperTechFans
让小产品的独立变现更简单 - ezindie.com
V
V2EX
Microsoft Azure Blog
J
Java Code Geeks
Apple Machine Learning Research
N
Netflix TechBlog - Medium
Google DeepMind News
钛媒体:引领未来商业与生活新知
钛媒体:引领未来商业与生活新知
MyScale Blog
MyScale Blog
阮一峰的网络日志
阮一峰的网络日志
H
Help Net Security
S
SegmentFault 最新的问题
aimingoo的专栏
aimingoo的专栏
B
Blog RSS Feed
L
LangChain Blog
T
Tailwind CSS Blog
WordPress大学
WordPress大学
GbyAI
GbyAI
Blog — PlanetScale
Blog — PlanetScale
V
Visual Studio Blog
Vercel News
Vercel News
Recent Announcements
博客园 - 司徒正美
S
Securelist
Threat Intelligence Blog | Flashpoint
C
Cybersecurity and Infrastructure Security Agency CISA
L
LINUX DO - 热门话题
Security Latest
Security Latest
T
Threat Research - Cisco Blogs

VictoriaMetrics: Simple & Reliable Monitoring for Everyone on VictoriaMetrics

Operator now has Long-Term Support (LTS) version Multi-tiered Observability: A Practical Way to Handle Diverse Workloads VictoriaMetrics April 2026 Ecosystem Updates Not All Telemetry Requires Premium Pricing VictoriaMetrics at KubeCon Amsterdam: Community Highlights What's new in VictoriaMetrics Anomaly Detection (Q1 2026) What's New in VictoriaMetrics Cloud Q1 2026? Logs, MCP Server, Better Alerting, and... a Secret Project VictoriaMetrics at KubeCon: Optimizing Tail Sampling in OpenTelemetry with Retroactive Sampling VictoriaMetrics March 2026 Ecosystem Updates Observability Lessons From OpenAI Benchmarking Kubernetes Log Collectors: vlagent, Vector, Fluent Bit, OpenTelemetry Collector, and more VictoriaMetrics February 2026 Ecosystem Updates VictoriaMetrics at FOSDEM, Cloud Native Days France, and CfgMgmtCamp Ghent VictoriaLogs in VictoriaMetrics Cloud: Fast, Cost-Effective Log Management is Here What’s new in VictoriaMetrics Anomaly Detection (2025) VictoriaMetrics January 2026 Ecosystem Updates VictoriaLogs Basics: What You Need to Know, with Examples & Visuals What's New in VictoriaMetrics Cloud Q4 2025? New tiers, more deployment options, IaC and alerting rules. Vibe coding tools observability with VictoriaMetrics Stack and OpenTelemetry How a US Software Provider Improved Traffic Alerting with VictoriaMetrics Anomaly Detection VictoriaMetrics 2025 Developer Experience: A Year in Review Spotify’s performance & control across large monitoring environments with VictoriaMetrics VictoriaMetrics Achieves Red Hat OpenShift Operator Certification Our latest updates across the VictoriaMetrics Observability ecosystem New Capacity Tiers in VictoriaMetrics Cloud Announcing 1B+ Downloads & Product Development With Logs, Traces, Metrics AI Agents Observability with OpenTelemetry and the VictoriaMetrics Stack Discarding gRPC-Go: The Story Behind OTLP/gRPC Support in VictoriaTraces What's New in VictoriaMetrics Cloud Q3 2025? From new region in Asia to proactive alerts How DreamHost Slashed Memory Usage by 80% and Scaled to 76 Million Time Series Upcoming Conferences & Meetups: Where to Meet Our Team VictoriaMetrics Long-Term Support (LTS): H2 2025 Update Creating a Sustainable Open Source Business Model - Introduction Full-Stack Observability with VictoriaMetrics in the OTel Demo Alerting Best Practices vmanomaly Deep Dive: Smarter Alerting with AI (Tech Talk Companion) VictoriaLogs Practical Ingestion Guide for Message, Time and Streams Monotonic and Wall Clock Time in the Go time package Hello Singapore! VictoriaMetrics Cloud Expands to Asia Pacific MCP Server Integration & Much More: What's New in VictoriaMetrics Cloud Q2 2025 FIPS 140-3 Compatible Builds for VictoriaMetrics Enterprise Components VictoriaLogs Unleashed: Cluster Version Now Available for Exceptional, Linear Scaling Integrations made easy with VictoriaMetrics Cloud Developer's Note: Research on Distributed Tracing, Comparing With Tempo and ClickHouse vmagent: Key Features Explained in Under 15 Minutes Go synctest: Solving Flaky Tests vmalert: Maximize Your Monitoring (Tech Talk Companion) Celebrating 14K Stars on GitHub: Spring Update vmalert: Maximize Your Monitoring VictoriaMetrics Connects with the Open Source Community at LinuxFest Northwest 2025 Graceful Shutdown in Go: Practical Patterns VictoriaLogs: Gaps, Gains & Growth Prometheus Monitoring: Functions, Subqueries, Operators, and Modifiers VictoriaMetrics Cloud: What's New in Q1 2025? Don’t default to microservices: You’ll thank us later! Container CPU Requests & Limits Explained with GOMAXPROCS Tuning gRPC in Go: Streaming RPCs, Interceptors, and Metadata From Chaos to Clarity with VictoriaLogs Prometheus Alerting 101: Rules, Recording Rules, and Alertmanager Heading to London: Meet Our Team at KubeCon Europe 2025 Inside vmselect: The Query Processing Engine of VictoriaMetrics Meet Our Team at Scale 22x Practical Protobuf - From Basic to Best Practices VictoriaLogs Status Update: Heading Towards the Cluster Version 24th of February 2025 Statement: VictoriaMetrics Stands with Ukraine! Prometheus Metrics Explained: Counters, Gauges, Histograms & Summaries Prometheus Monitoring: Instant Queries and Range Queries Explained 300%+ Growth in 2024: Join Our Team in 2025! FOSDEM 2025 recap How Protobuf Works—The Art of Data Encoding OpenTelemetry, Prometheus, and More: Which Is Better for Metrics Collection and Propagation? How vmstorage Handles Query Requests From vmselect How vmstorage's IndexDB Works VictoriaMetrics Tech Talk Stream: A Deep Dive into Blackbox Monitoring How HTTP/2 Works and How to Enable It in Go VictoriaMetrics Cloud: What's New in Q4 2024? How vmstorage Processes Data: Retention, Merging, Deduplication,... How vmstorage Handles Data Ingestion From vminsert When Metrics Meet vminsert: A Data-Delivery Story From net/rpc to gRPC in Go Applications Piros | VictoriaMetrics Partner Allenta | VictoriaMetrics Partner CloudRaft | VictoriaMetrics Partner Sensedia & VictoriaMetrics: API-compatible Efficient Storage Scalable Prometheus: Why DSV Chose VictoriaMetrics Sensor Factory | VictoriaMetrics Partner Erythix | VictoriaMetrics Partner Groove X & VictoriaMetrics: Faster Device Health Monitoring Scaled & Performant Monitoring at Spotify with VictoriaMetrics Grammarly & VictoriaMetrics: 10× Lower Costs & Direct Access Zelarsoft | VictoriaMetrics Partner DFKI & VictoriaMetrics: Efficient Long-Term Metric Storage Niubits | VictoriaMetrics Partner Megazone Cloud | VictoriaMetrics Partner Cogito Software | VictoriaMetrics Partner Bajau | VictoriaMetrics Partner Find Out Why Dig Security Chose VictoriaMetrics! Ness | VictoriaMetrics Partner Alpha Data | VictoriaMetrics Partner SIOS Technology | VictoriaMetrics Partner
Troubleshooting Time Series Databases: Where Did My Metrics Go?
Zhu Jiekun · 2024-08-09 · via VictoriaMetrics: Simple & Reliable Monitoring for Everyone on VictoriaMetrics

Where Are My Metrics?

#

Complex modern applications rely heavily on observability, and metric monitoring is a crucial part of observability. The most common process of metric monitoring, which includes data scraping, processing, storage, and visualization, can be summarized in the diagram below:

If an issue arises, for example, when users ask, “I have already recorded metrics in the application, why can’t I see my metrics on Grafana?”, how should we troubleshoot it? In this blog, I will take VictoriaMetrics as an example and use its built-in tools to investigate this issue. Of course, you can apply the same troubleshooting approach to Prometheus as they are highly compatible.

Data Scraping

#

Data scraping issues typically occur in these areas: the applications that expose metrics, vmagent that scrapes metrics, and the network between them.

For the application, the first step is to check if the monitoring metrics are being exposed correctly. This can be done by accessing the metrics’ HTTP endpoint (for example, curl http://IP:Port/metrics). If everything is working fine, you should be able to see the following content:

test_histogram_seconds_bucket{label_1="bar",vmrange="1.896e+00...2.154e+00"} 7192
test_histogram_seconds_sum{label_1="bar"} 14384
test_histogram_seconds_count{label_1="bar"} 7192
test_histogram_seconds_bucket{label_1="foo",vmrange="8.799e-01...1.000e+00"} 7192
test_histogram_seconds_sum{label_1="foo"} 7192
test_histogram_seconds_count{label_1="foo"} 7192
go_sched_latencies_seconds_bucket{le="0"} 0
go_sched_latencies_seconds_bucket{le="2.56e-07"} 80
...

If you are unable to see this monitoring data, you need to debug your application. You can typically refer to the Prometheus SDK documentation, or its lightweight alternative, the metrics package, along with this Go language example for guidance.

Alright, once the application is functioning properly, we need to check if vmagent is scraping data. vmagent provides a very convenient WebUI (http://<vmagent>:8429/) to assist with this. From the target page, you can find all the scrape targets, which should ideally look like this under normal circumstances:
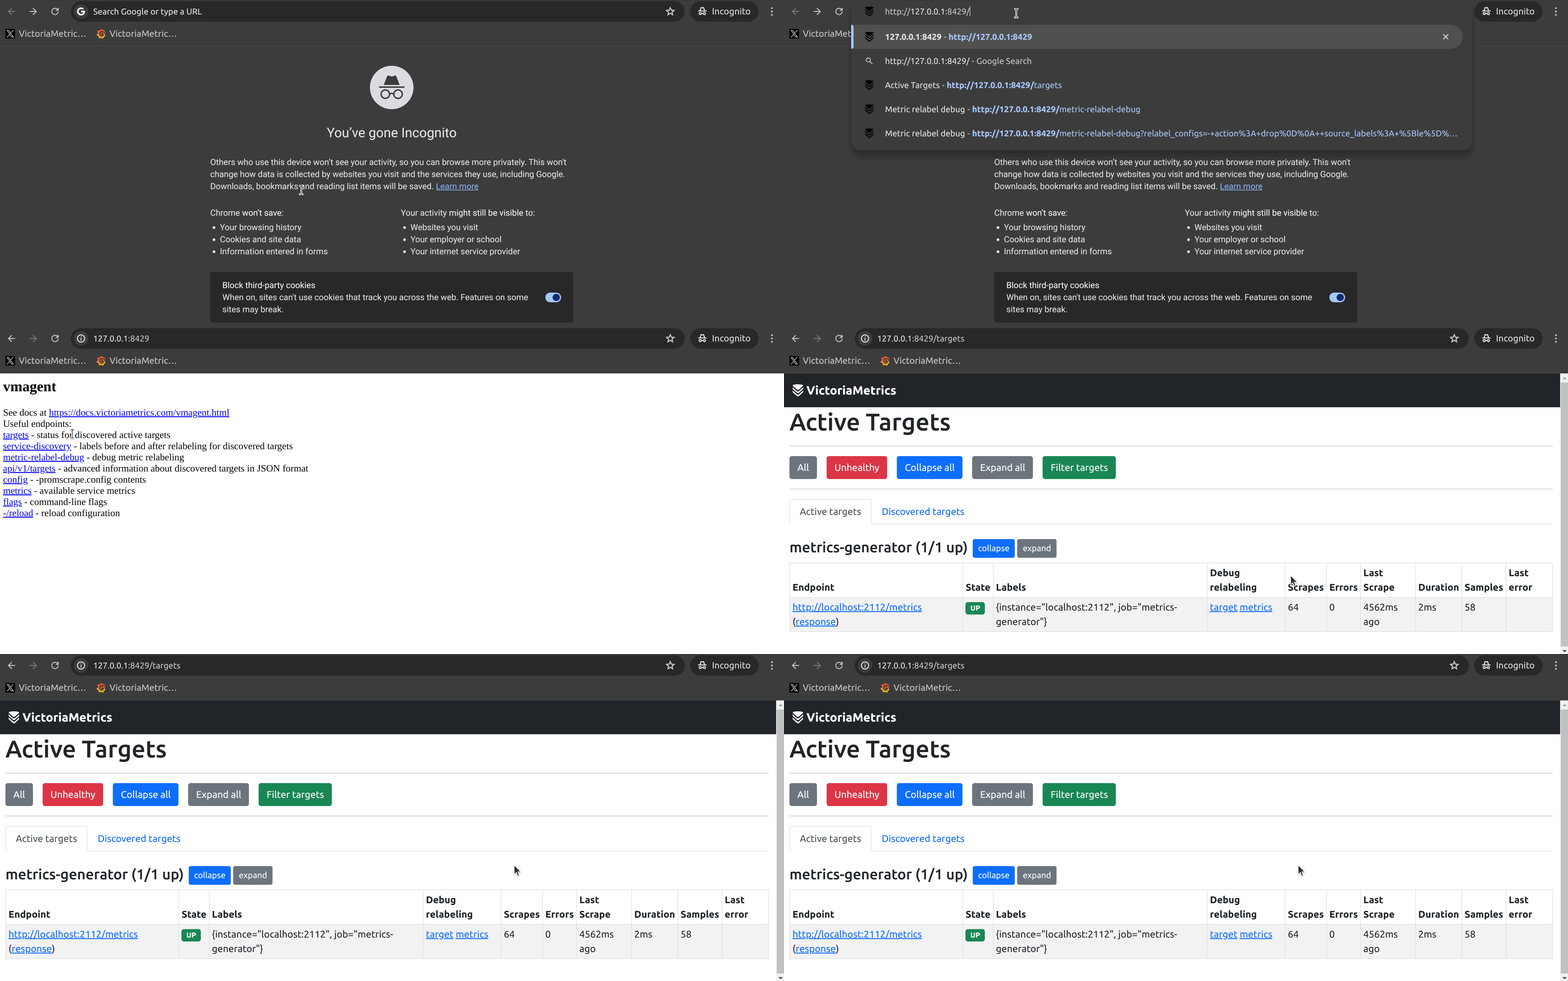
At this point, the most common issues could be:

  1. Unable to find the corresponding Target (whether it is Healthy or Unhealthy);
  2. The corresponding Target is in an Unhealthy state.

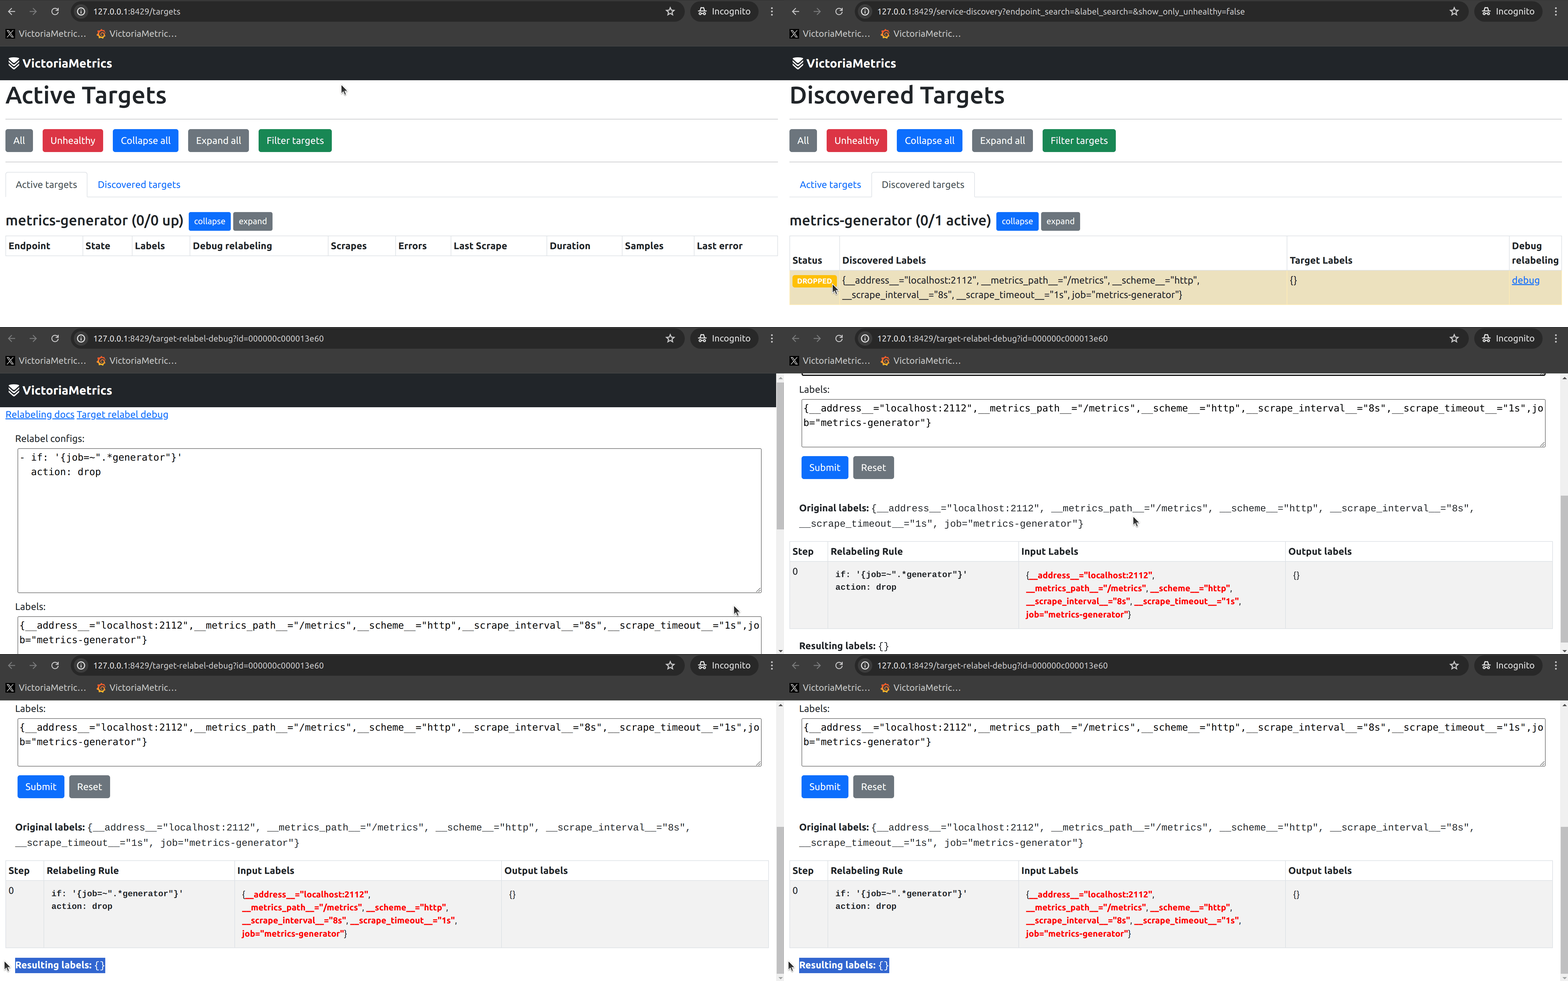
If your target is not found, it might not have been discovered by service discovery or it could have been dropped by a relabeling rule after service discovery. vmagent’s built-in Relabel Debug feature can effectively help you confirm the issue (see the image below).
If the corresponding target is in an Unhealthy state, the reasons could be:

  • Network connectivity issues between vmagent and the application.
  • Timeout due to the application exposing a huge number of metrics.

You can typically observe the specific error reasons on the WebUI of vmagent.

I recommend users to manually access the scrape target from the environment where vmagent is located (e.g., the Container / Pod / Node where vmagent is running) to check if the response matches the error reasons. If they match, then debugging of network issues (using iptables, Kubernetes Service, etc.) may be necessary.

Remote Write

#

When you can’t find issues at the data scraping end, you will surely wonder if the data has actually been sent to the storage end (VictoriaMetrics Single-Node/Cluster).

The first thing to consider is whether the vmagent’s remote write is functioning correctly. We need to observe some metrics exposed by vmagent to determine this. The following screenshot is from the Grafana Dashboard provided by VictoriaMetrics. It describes the data transfer status for each Remote-Write Target:
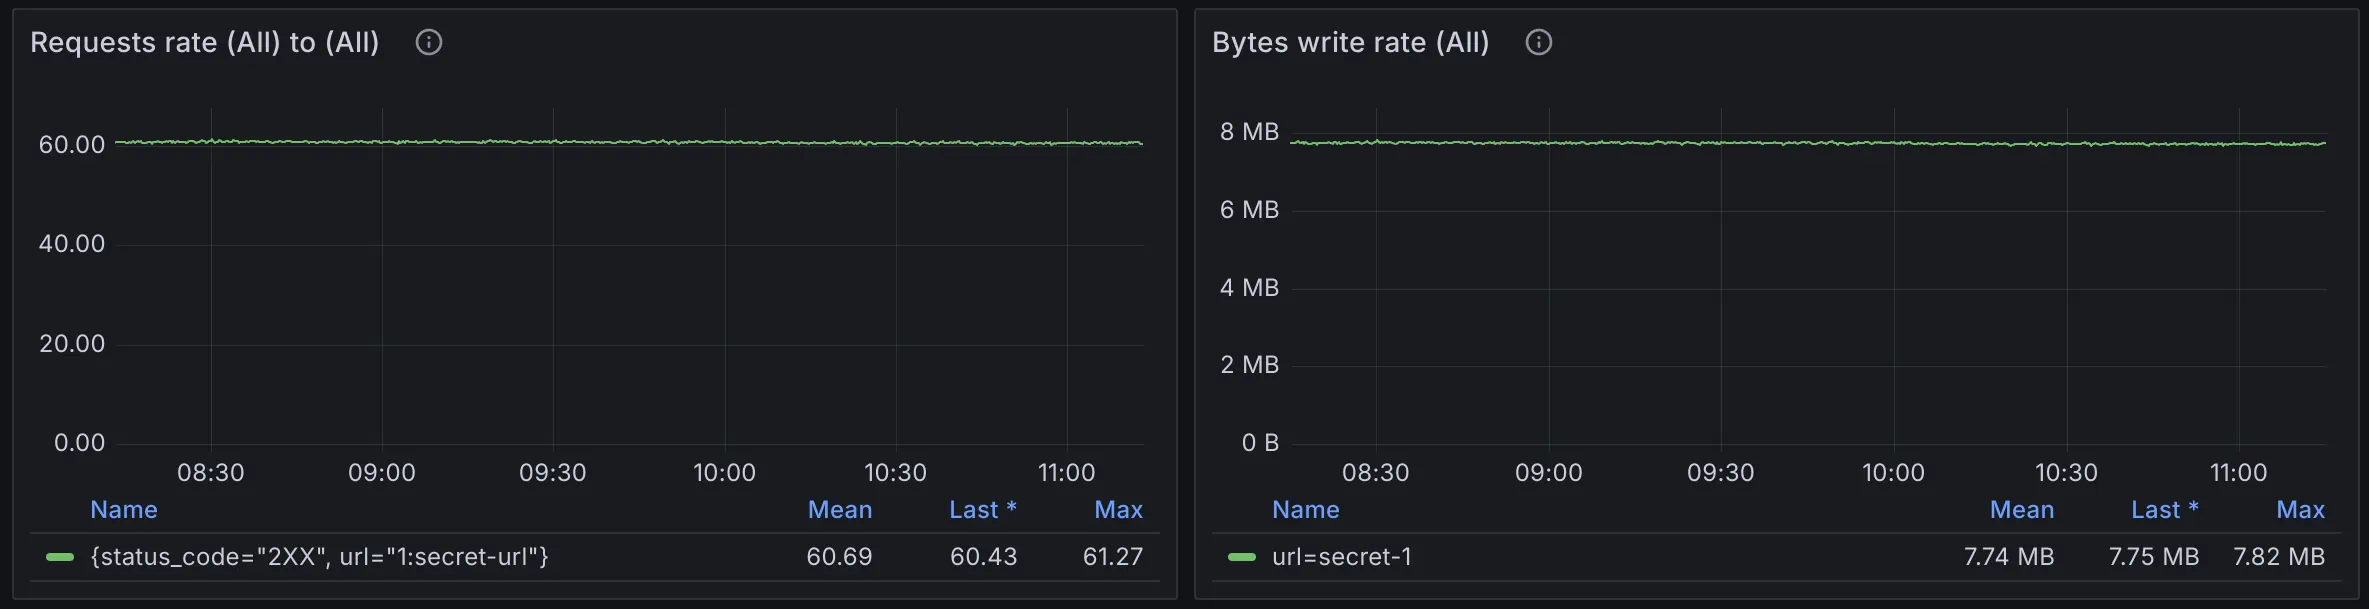
If you haven’t configured the VictoriaMetrics Grafana Dashboard yet, you can also try the following query:

sum(rate(vmagent_remotewrite_requests_total{}[1m])) by(url, status_code) > 0
sum(rate(vmagent_remotewrite_conn_bytes_written_total{}[1m]))> 0

These metrics can indicate the network conditions of remote write, such as 401 Unauthorized status code for wrong auth settings, or network being unreachable.

You can find more suggestions in the Monitoring section of the Quick Start on how to monitor all VictoriaMetrics components.

I still recommend importing the Grafana Dashboard as soon as you have set up VictoriaMetrics because it includes monitoring metrics for various components of VictoriaMetrics. This can significantly reduce the time needed to troubleshoot issues. The monitoring metrics mentioned later in this article will also be introduced based on the Grafana Dashboard.

Another issue that may occur on the vmagent side is remote write queue blockage. Similarly, this can be identified by observing the vmagent_remotewrite_pending_data_bytes metric:
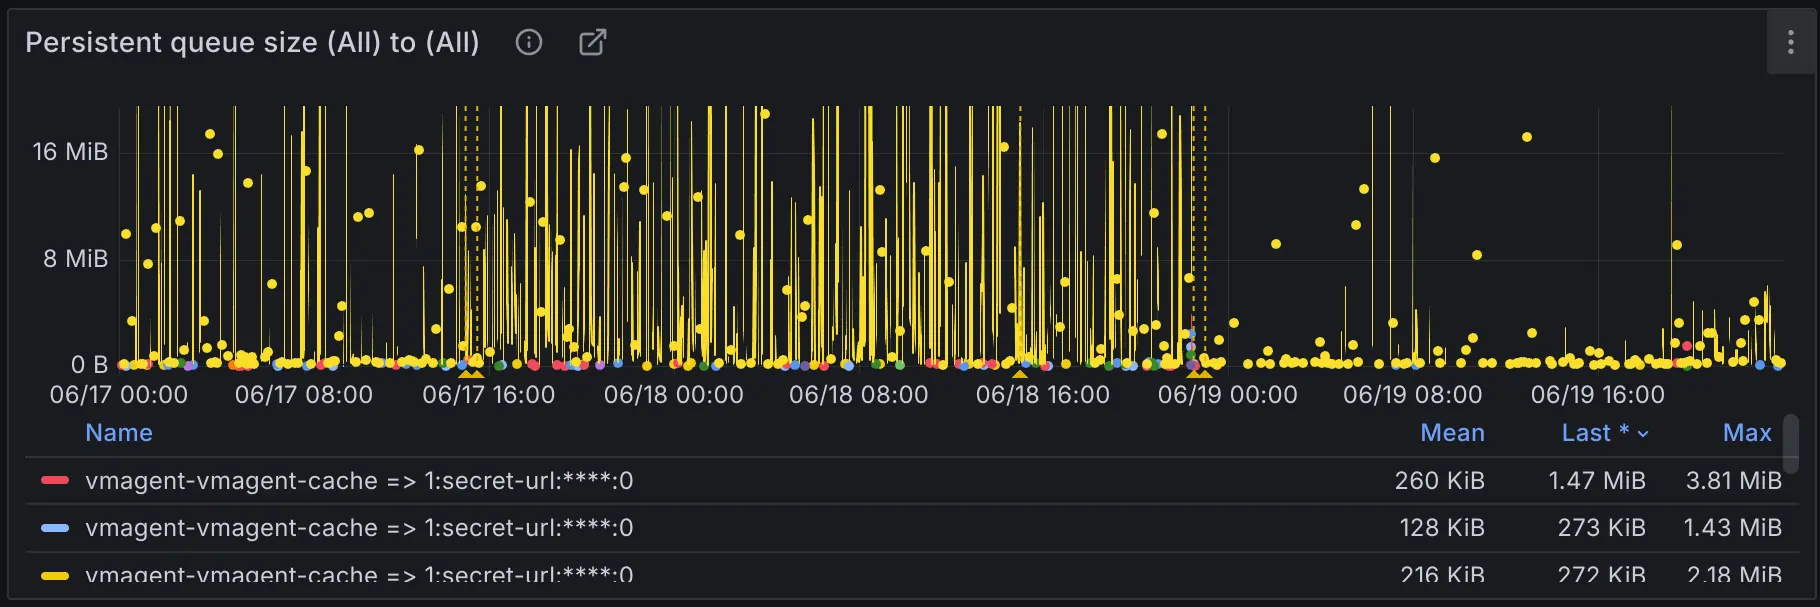
This issue can result in data scraped by vmagent not being promptly sent to the remote write target, thus preventing users from querying their metrics in real-time. Possible reasons:

  1. The remote write target cannot support the amount of current data ingestion.
  2. Insufficient network bandwidth between vmagent and the remote write target.

The first case can be easily observed through storage connection saturation. It shows the saturation level of connection between vminsert and vmstorage components.

max(rate(vm_rpc_send_duration_seconds_total{}[1m])) by(addr)

If the threshold of 0.9sec is reached, then the connection is saturated by more than 90% and vminsert won’t be able to keep up. This usually means that either vminsert or vmstorage nodes are struggling with the load. Verify CPU/mem saturation of both components and network saturation between them.

I recommend visualizing it directly on the Grafana Dashboard, as these metrics are already integrated into the Dashboard of the VictoriaMetrics Cluster.
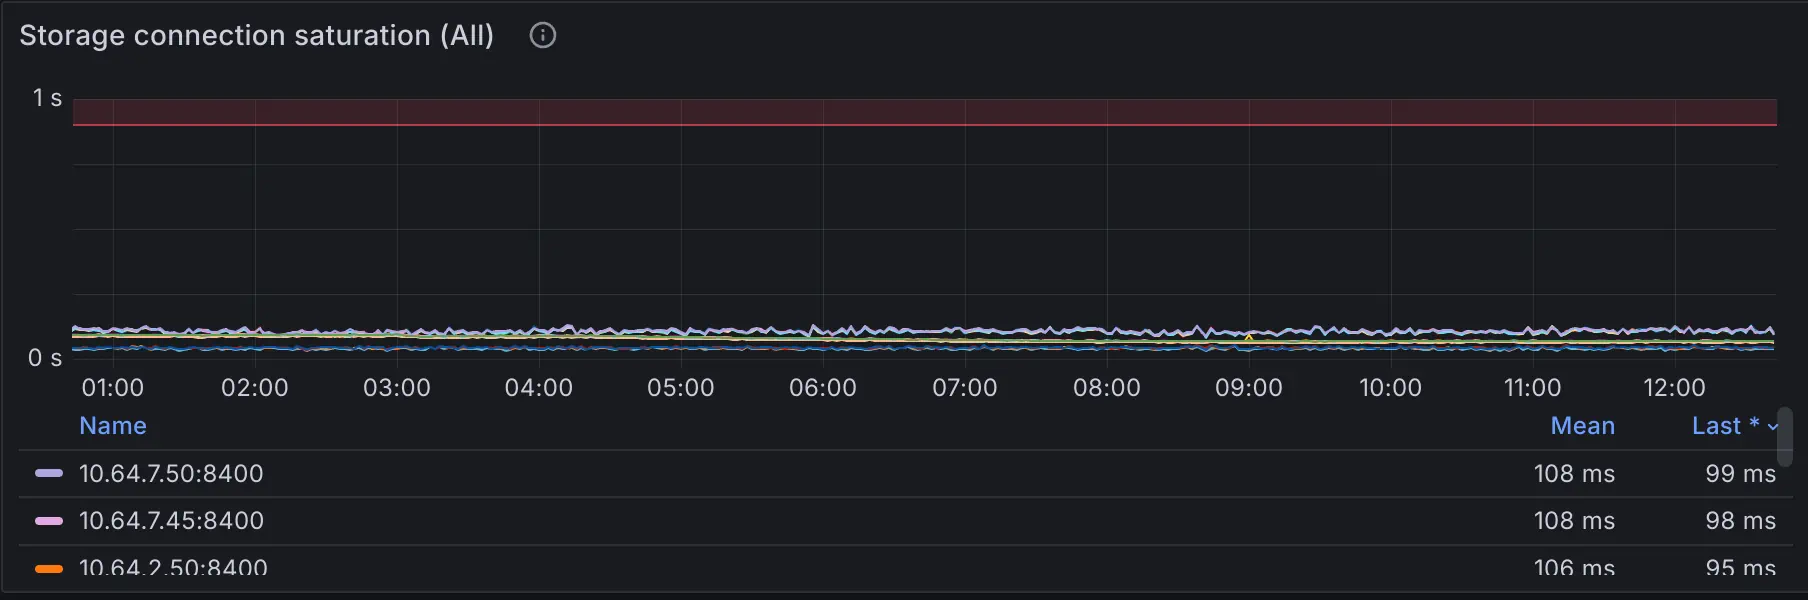
Connection saturation is just one of the methods for troubleshooting ingestion issues. The official documentation provides 7 common suggestions for troubleshooting slow data ingestion, and it is recommended to read through them.

If not many issues are found in the monitoring of the VictoriaMetrics Cluster, then perhaps the second scenario to consider is whether the network bandwidth is sufficient.

Querying

#

Assuming no issues were found in the previous steps, congratulations, the data likely resides in the TSDB. In this case, the absence of query results is often caused by issues related to PromQL/MetricsQL, variables, etc.

In VictoriaMetrics Cluster, it is recommended to start by querying vmstorage through vmselect at the lowest level and remove all variables and functions from the query statement, for example:

// Original PromQL/MetricsQL
rate(vm_slow_row_inserts_total{job=~"$job_storage"}[$__rate_interval]) 

// PromQL/MetricsQL for troubleshooting
vm_slow_row_inserts_total

This ensures that the metric is present in your TSDB, and then you can gradually add label conditions, variables, and aggregation functions to identify which step in the query process is not yielding the expected results.

If everything appears to be in order, the issue likely lies in the higher-level query path, such as Grafana -> vmauth -> vmselect_level_1 -> ... vmselect_level_n -> vmstorage, in which case you should troubleshoot each level upwards.

What Else Could it Be?

#

Sometimes troubleshooting can be challenging, and these reasons can also make metrics not queryable:

  • Data ingested with too old timestamp or future timestamp. Check the log of vmstorage and see if they were dropped.
  • Data ingested with relatively old timestamp, but still in the retentionPeriod. Extend your time range in Query UI to see them.
  • Wrong tenant ID in cluster version.

A good tool for checking whether you have your metrics without typing anything is the explore mode, which works for Prometheus-like metrics.

At the same time, by delving into VictoriaMetrics Monitoring, make sure you grasp the health status of VictoriaMetrics comprehensively.

Conclusion

#

Through the above introduction, I believe you have gained some insights into troubleshooting issues in the metric monitoring system. I have summarized these insights into a diagram:
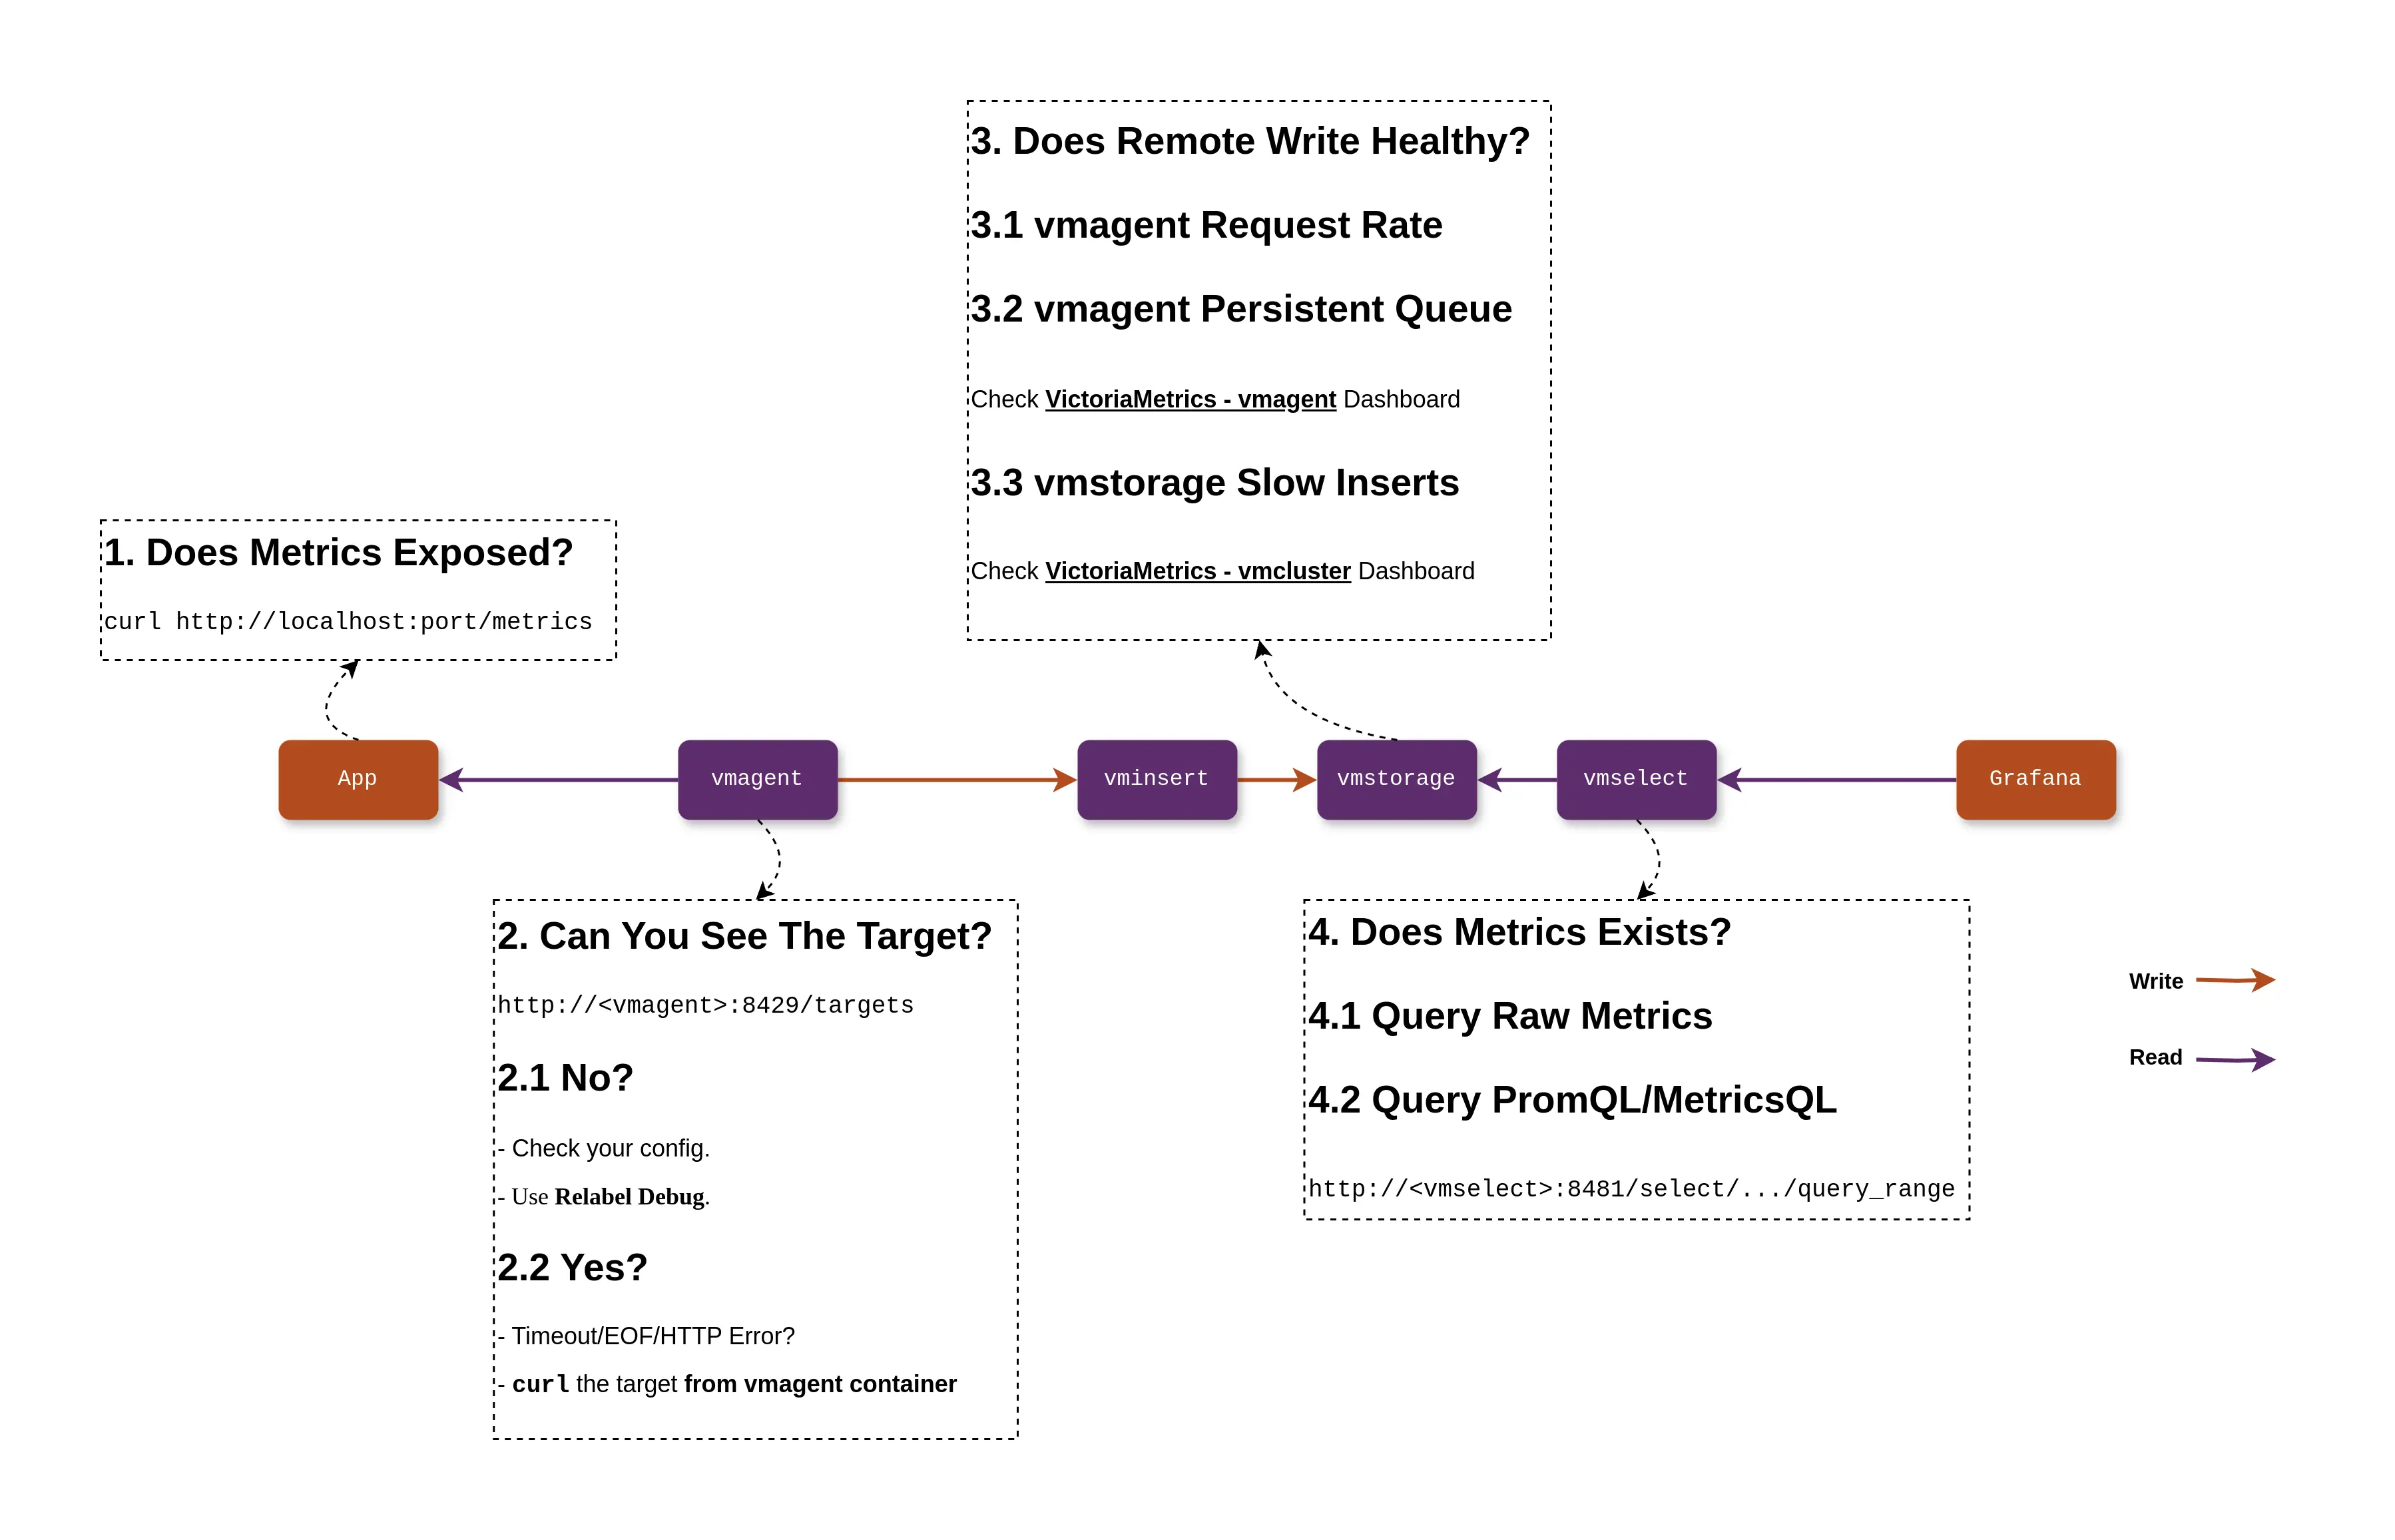
Due to space limitations, this article only scratches the surface of common issues. If you encounter more complex problems, I recommend:

  1. Make good use of monitoring with VictoriaMetrics, Grafana Dashboard is your best tool;
  2. Come to the VictoriaMetrics community to ask questions, we are happy to answer users’ questions and implement new features.