

惯性聚合 高效追踪和阅读你感兴趣的博客、新闻、科技资讯
阅读原文 在惯性聚合中打开

推荐订阅源

Spread Privacy
Spread Privacy
L
LangChain Blog
爱范儿
爱范儿
OSCHINA 社区最新新闻
OSCHINA 社区最新新闻
Google DeepMind News
有赞技术团队
有赞技术团队
博客园 - 【当耐特】
人人都是产品经理
人人都是产品经理
H
Hackread – Cybersecurity News, Data Breaches, AI and More
www.infosecurity-magazine.com
Engineering at Meta
Engineering at Meta
P
Privacy International News Feed
I
Intezer
NISL@THU
NISL@THU
Jina AI
Jina AI
G
GRAHAM CLULEY
C
CERT Recently Published Vulnerability Notes
S
Schneier on Security
Threat Intelligence Blog | Flashpoint
Cisco Talos Blog
Cisco Talos Blog
Scott Helme
Scott Helme
MyScale Blog
MyScale Blog
IT之家
IT之家
Security Latest
Security Latest
C
Cisco Blogs
Cyberwarzone
Cyberwarzone
aimingoo的专栏
aimingoo的专栏
V
Vulnerabilities – Threatpost
L
LINUX DO - 热门话题
Recorded Future
Recorded Future
The Hacker News
The Hacker News
C
CXSECURITY Database RSS Feed - CXSecurity.com
月光博客
月光博客
A
Arctic Wolf
云风的 BLOG
云风的 BLOG
N
Netflix TechBlog - Medium
K
Kaspersky official blog
S
Securelist
M
MIT News - Artificial intelligence
T
Threat Research - Cisco Blogs
P
Palo Alto Networks Blog
Simon Willison's Weblog
Know Your Adversary
Know Your Adversary
WordPress大学
WordPress大学
Project Zero
Project Zero
freeCodeCamp Programming Tutorials: Python, JavaScript, Git & More
N
News and Events Feed by Topic
AWS News Blog
AWS News Blog
T
The Exploit Database - CXSecurity.com
T
The Blog of Author Tim Ferriss

VictoriaMetrics: Simple & Reliable Monitoring for Everyone on VictoriaMetrics

Operator now has Long-Term Support (LTS) version Multi-tiered Observability: A Practical Way to Handle Diverse Workloads VictoriaMetrics April 2026 Ecosystem Updates Not All Telemetry Requires Premium Pricing VictoriaMetrics at KubeCon Amsterdam: Community Highlights What's new in VictoriaMetrics Anomaly Detection (Q1 2026) What's New in VictoriaMetrics Cloud Q1 2026? Logs, MCP Server, Better Alerting, and... a Secret Project VictoriaMetrics at KubeCon: Optimizing Tail Sampling in OpenTelemetry with Retroactive Sampling VictoriaMetrics March 2026 Ecosystem Updates Observability Lessons From OpenAI Benchmarking Kubernetes Log Collectors: vlagent, Vector, Fluent Bit, OpenTelemetry Collector, and more VictoriaMetrics February 2026 Ecosystem Updates VictoriaMetrics at FOSDEM, Cloud Native Days France, and CfgMgmtCamp Ghent VictoriaLogs in VictoriaMetrics Cloud: Fast, Cost-Effective Log Management is Here What’s new in VictoriaMetrics Anomaly Detection (2025) VictoriaMetrics January 2026 Ecosystem Updates VictoriaLogs Basics: What You Need to Know, with Examples & Visuals What's New in VictoriaMetrics Cloud Q4 2025? New tiers, more deployment options, IaC and alerting rules. Vibe coding tools observability with VictoriaMetrics Stack and OpenTelemetry How a US Software Provider Improved Traffic Alerting with VictoriaMetrics Anomaly Detection VictoriaMetrics 2025 Developer Experience: A Year in Review Spotify’s performance & control across large monitoring environments with VictoriaMetrics VictoriaMetrics Achieves Red Hat OpenShift Operator Certification Our latest updates across the VictoriaMetrics Observability ecosystem New Capacity Tiers in VictoriaMetrics Cloud Announcing 1B+ Downloads & Product Development With Logs, Traces, Metrics AI Agents Observability with OpenTelemetry and the VictoriaMetrics Stack Discarding gRPC-Go: The Story Behind OTLP/gRPC Support in VictoriaTraces What's New in VictoriaMetrics Cloud Q3 2025? From new region in Asia to proactive alerts How DreamHost Slashed Memory Usage by 80% and Scaled to 76 Million Time Series Upcoming Conferences & Meetups: Where to Meet Our Team VictoriaMetrics Long-Term Support (LTS): H2 2025 Update Creating a Sustainable Open Source Business Model - Introduction Full-Stack Observability with VictoriaMetrics in the OTel Demo Alerting Best Practices vmanomaly Deep Dive: Smarter Alerting with AI (Tech Talk Companion) VictoriaLogs Practical Ingestion Guide for Message, Time and Streams Monotonic and Wall Clock Time in the Go time package Hello Singapore! VictoriaMetrics Cloud Expands to Asia Pacific MCP Server Integration & Much More: What's New in VictoriaMetrics Cloud Q2 2025 FIPS 140-3 Compatible Builds for VictoriaMetrics Enterprise Components VictoriaLogs Unleashed: Cluster Version Now Available for Exceptional, Linear Scaling Integrations made easy with VictoriaMetrics Cloud Developer's Note: Research on Distributed Tracing, Comparing With Tempo and ClickHouse vmagent: Key Features Explained in Under 15 Minutes Go synctest: Solving Flaky Tests vmalert: Maximize Your Monitoring (Tech Talk Companion) Celebrating 14K Stars on GitHub: Spring Update vmalert: Maximize Your Monitoring VictoriaMetrics Connects with the Open Source Community at LinuxFest Northwest 2025 Graceful Shutdown in Go: Practical Patterns VictoriaLogs: Gaps, Gains & Growth Prometheus Monitoring: Functions, Subqueries, Operators, and Modifiers VictoriaMetrics Cloud: What's New in Q1 2025? Don’t default to microservices: You’ll thank us later! Container CPU Requests & Limits Explained with GOMAXPROCS Tuning gRPC in Go: Streaming RPCs, Interceptors, and Metadata From Chaos to Clarity with VictoriaLogs Prometheus Alerting 101: Rules, Recording Rules, and Alertmanager Heading to London: Meet Our Team at KubeCon Europe 2025 Inside vmselect: The Query Processing Engine of VictoriaMetrics Meet Our Team at Scale 22x Practical Protobuf - From Basic to Best Practices VictoriaLogs Status Update: Heading Towards the Cluster Version 24th of February 2025 Statement: VictoriaMetrics Stands with Ukraine! Prometheus Metrics Explained: Counters, Gauges, Histograms & Summaries Prometheus Monitoring: Instant Queries and Range Queries Explained 300%+ Growth in 2024: Join Our Team in 2025! FOSDEM 2025 recap How Protobuf Works—The Art of Data Encoding OpenTelemetry, Prometheus, and More: Which Is Better for Metrics Collection and Propagation? How vmstorage Handles Query Requests From vmselect How vmstorage's IndexDB Works VictoriaMetrics Tech Talk Stream: A Deep Dive into Blackbox Monitoring How HTTP/2 Works and How to Enable It in Go VictoriaMetrics Cloud: What's New in Q4 2024? How vmstorage Processes Data: Retention, Merging, Deduplication,... How vmstorage Handles Data Ingestion From vminsert When Metrics Meet vminsert: A Data-Delivery Story From net/rpc to gRPC in Go Applications Piros | VictoriaMetrics Partner Allenta | VictoriaMetrics Partner CloudRaft | VictoriaMetrics Partner Sensedia & VictoriaMetrics: API-compatible Efficient Storage Scalable Prometheus: Why DSV Chose VictoriaMetrics Sensor Factory | VictoriaMetrics Partner Erythix | VictoriaMetrics Partner Groove X & VictoriaMetrics: Faster Device Health Monitoring Scaled & Performant Monitoring at Spotify with VictoriaMetrics Grammarly & VictoriaMetrics: 10× Lower Costs & Direct Access Zelarsoft | VictoriaMetrics Partner DFKI & VictoriaMetrics: Efficient Long-Term Metric Storage Niubits | VictoriaMetrics Partner Megazone Cloud | VictoriaMetrics Partner Cogito Software | VictoriaMetrics Partner Bajau | VictoriaMetrics Partner Find Out Why Dig Security Chose VictoriaMetrics! Ness | VictoriaMetrics Partner Alpha Data | VictoriaMetrics Partner SIOS Technology | VictoriaMetrics Partner
Community Question: High Churn Rate Without New Time Series?
Zhu Jiekun · 2024-09-05 · via VictoriaMetrics: Simple & Reliable Monitoring for Everyone on VictoriaMetrics

Last week, I saw a user asking for help on Slack:

“My VictoriaMetrics cluster has a very high churn rate at 0:00 every day. However, when I enable -logNewSeries, I find that these ’new’ time series actually already existed. Why is this happening?”
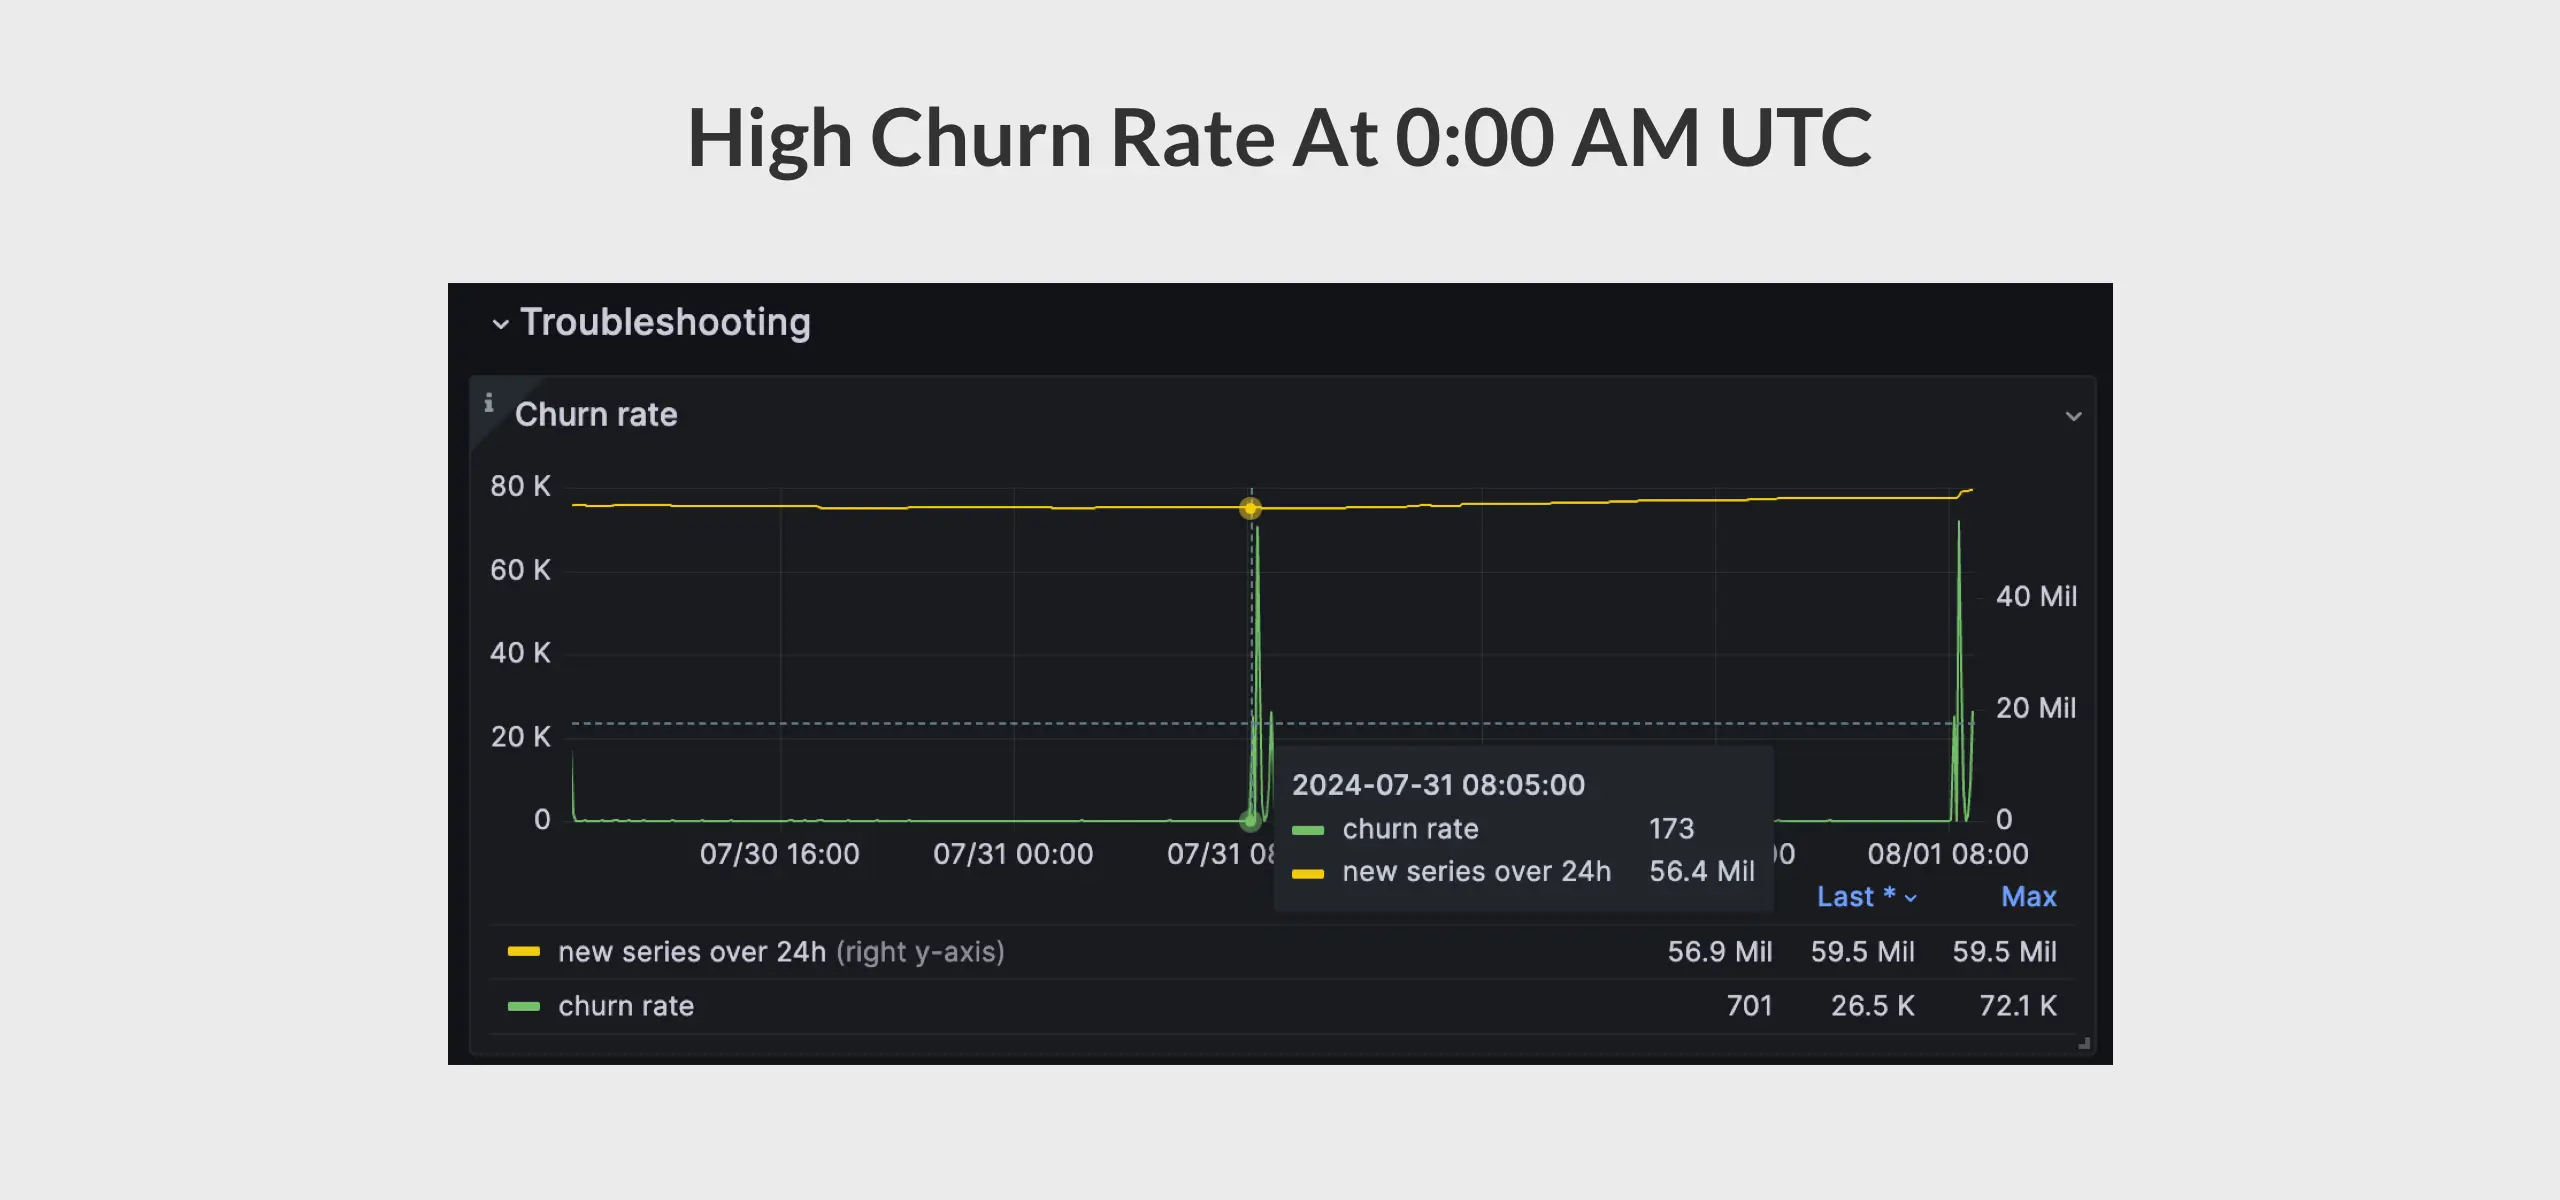
Note: The screenshot was taken in the UTC+8 timezone, so the high churn rate at 8:00 AM occurs at 0:00 AM UTC. Note: The screenshot was taken in the UTC+8 timezone, so the high churn rate at 8:00 AM occurs at 0:00 AM UTC.

What Is Churn Rate

#

In time series database, churn rate refers to the rate at which new time series appear and replace old time series.

If old time series are constantly substituted with new time series at a high rate, then such a state is called high churn rate. High churn rate has the following negative consequences:

  • Increased total number of time series stored in the database.
  • Increased size of inverted index.
  • Slowed query speed, especially over long time ranges.

In VictoriaMetrics, you can use the following MetricsQL expression to see the churn rate:

sum(rate(vm_new_timeseries_created_total))

Going back to the user’s question, if there are truly no new time series appearing, shouldn’t the churn rate be 0?

In theory, yes. To answer this question, we first need to understand how churn rate is calculated.

How Churn Rate is Calculated in VictoriaMetrics

#

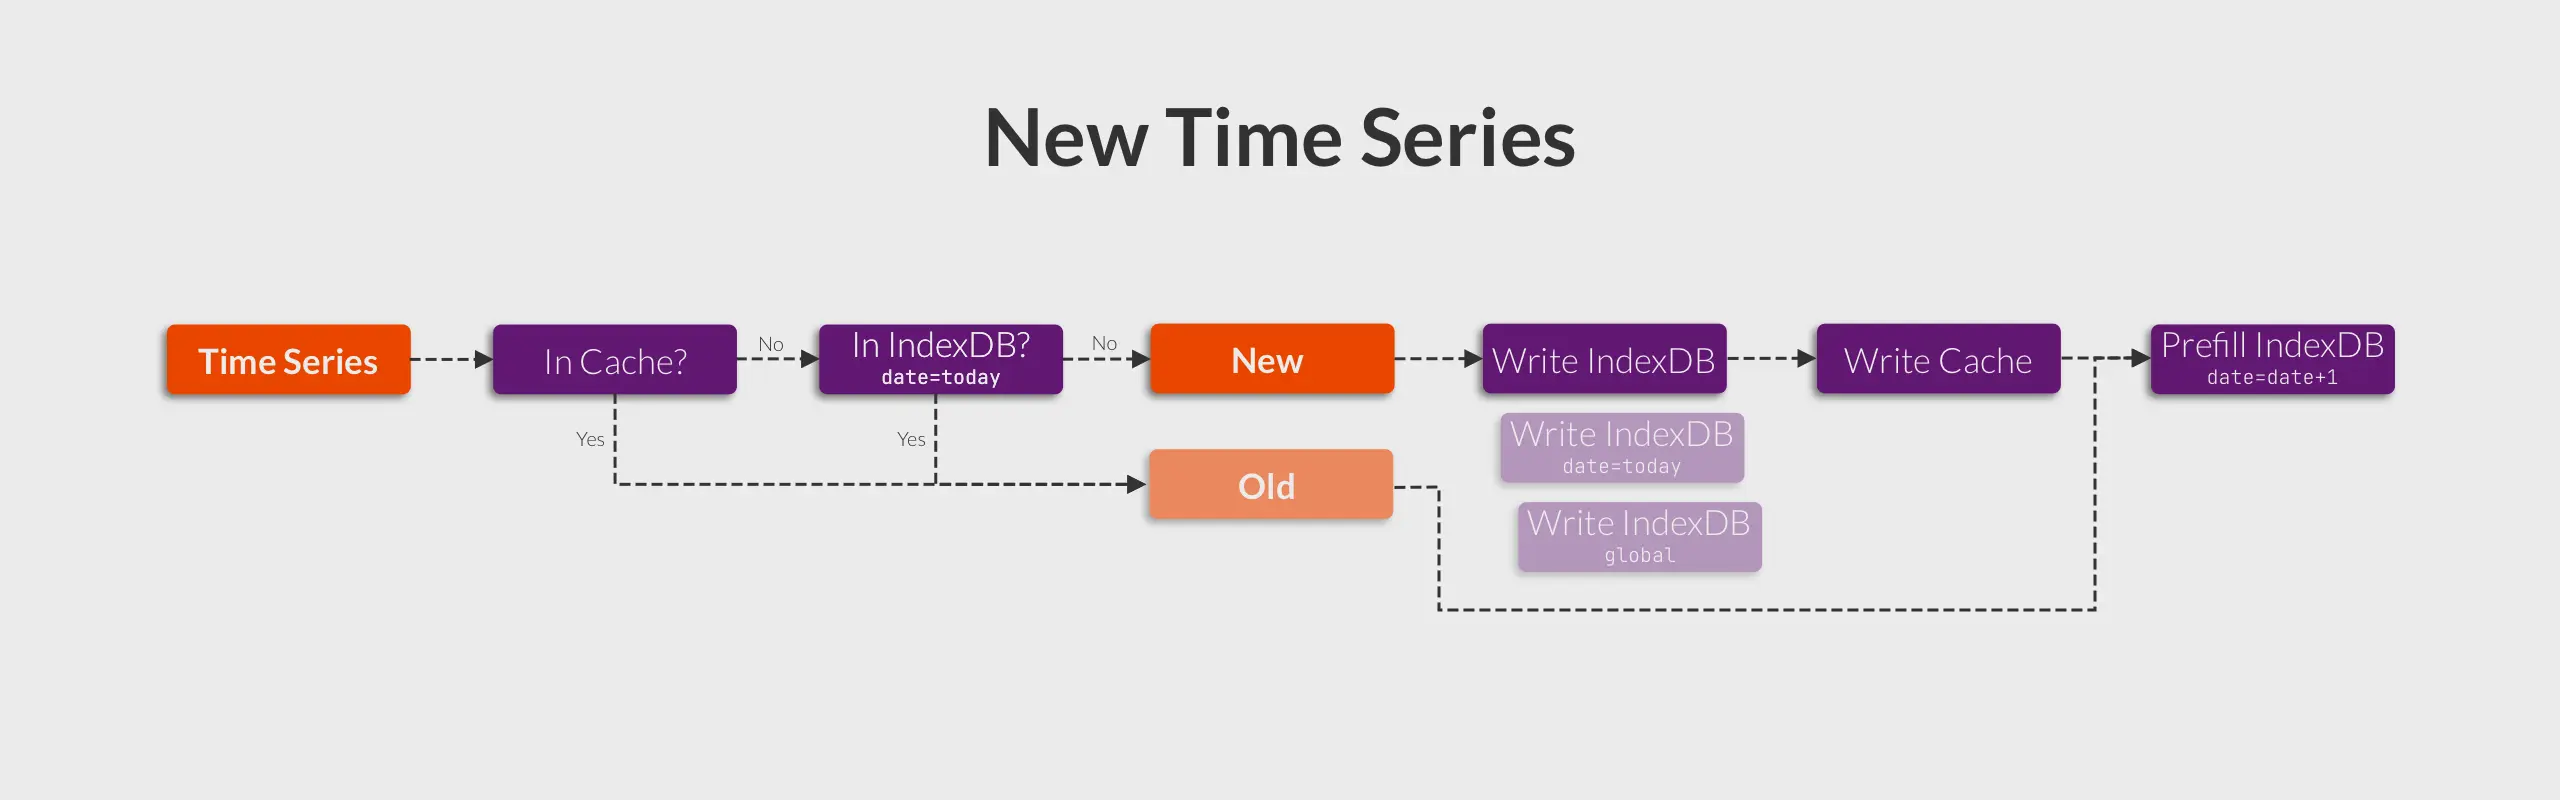
To distinguish between already seen and a new time series, we must register it to the index. When a time series arrives, we query the inverted index to check if this time series was seen before.

Building on top of this, the most common optimization technique is to use in-memory cache. Consequently, we can create the following flowchart:
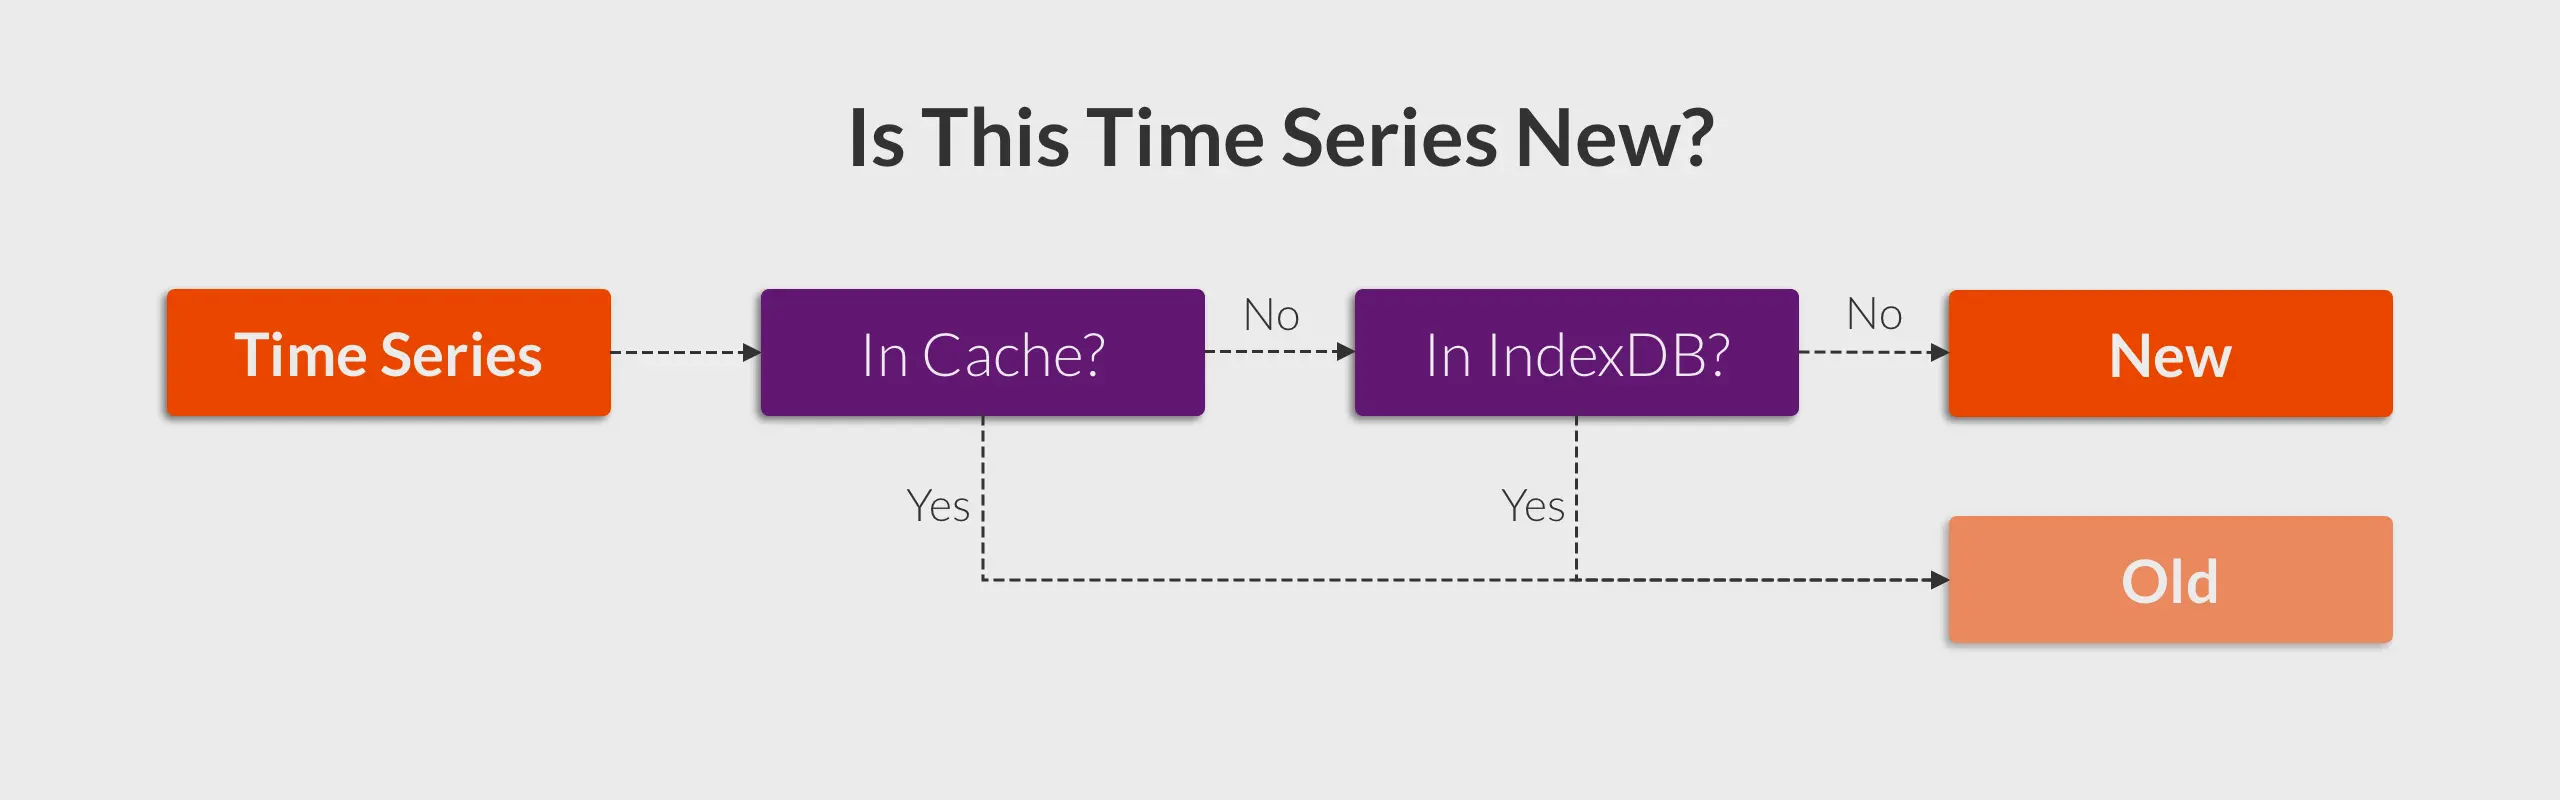
If a time series is identified as ’new,’ it indicates that it is absent both from the cache and the inverted index.

Root Cause

#

As I delved deeper into the code, I uncovered the following code block:

        // Search for TSID for the given mr.MetricNameRaw in the indexdb.
        if is.getTSIDByMetricName(&genTSID, metricNameBuf, date) {
            // Slower path - the TSID has been found in indexdb.
            ...
        }

        // Slowest path - the TSID for the given mr.MetricNameRaw isn't found in indexdb. Create it.
        ...

The date parameter stands out, indicating that data is queried by date. If this is indeed the case, it implies that every time series is considered ’new’ at midnight each day, aligning with the scenario described by the user.

To confirm this scenario, I checked our internal VictoriaMetrics cluster monitoring dashboard. Strangely, the churn rate looks relatively stable and did not show any sudden spikes at midnight each day.
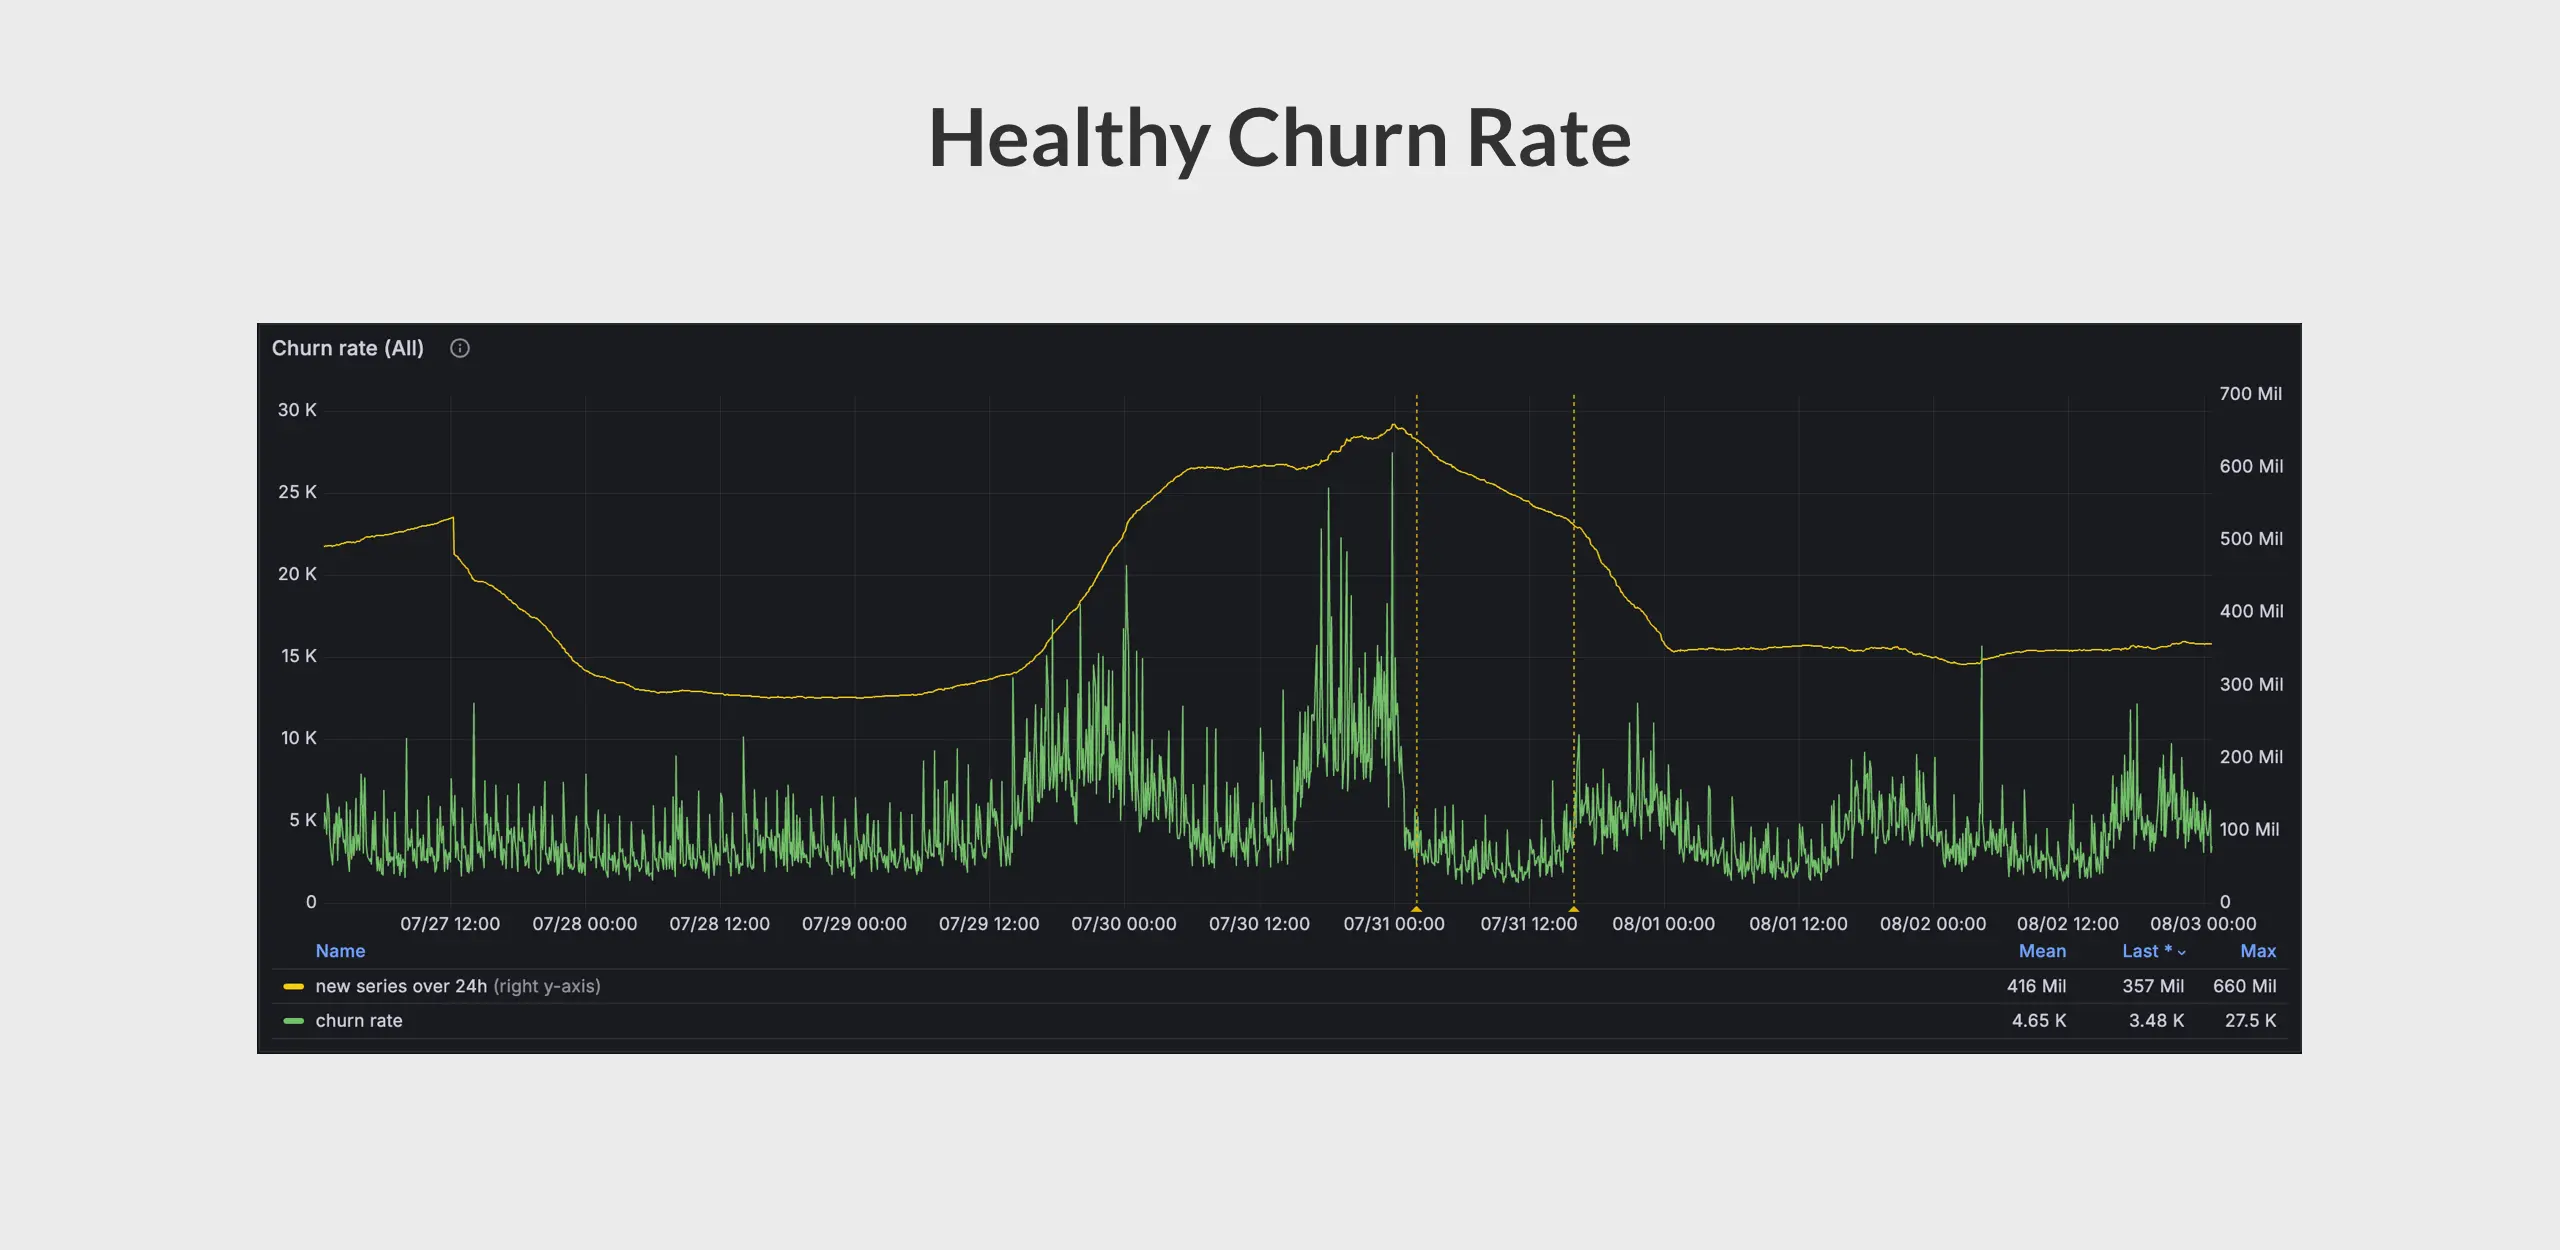
Are there any secrets in the inverted index? I then noticed this method:

func (s *Storage) prefillNextIndexDB(rows []rawRow, mrs []*MetricRow) error {
    d := s.nextRetentionSeconds()
    if d >= 3600 {
        // Fast path: nothing to pre-fill because it is too early.
        // The pre-fill is started during the last hour before the indexdb rotation.
        return nil
    }

    // Slower path: less than hour left for the next indexdb rotation.
    // Pre-populate idbNext with the increasing probability until the rotation.
    ...
}

So basically, VictoriaMetrics will prefill a new inverted index for the next day 1 hour before the indexdb rotation. All data appearing in the last hour will be inserted into the new index in advance. This approach:

  • Avoids a churn rate spike that occurs daily at midnight.
  • Prevents some stale time series from being prefilled into the new index.

For the problematic scenario described by the user, it can be inferred:
  1. Most of the time, data exists in either the inverted index or the cache.
  2. At midnight, data is not in the prefill inverted index or the cache.

Note: The prefilling of IndexDB only happens 1 hour before daily rotation. Note: The prefilling of IndexDB only happens 1 hour before daily rotation.

We are now getting very close to the root cause. “But why aren’t the user’s time series in the prefill index and cache?”

I revisited the information provided by the user and discovered the following:

“My (problematic) VictoriaMetrics cluster is primarily used to store downsampling data, which is generated every hour.”

This is a crucial clue: because the index prefilling only happens 1 hour before rotation, it is possible to miss that data. As for the cache, if it has a TTL (Time To Live), one-hour (downsampling interval) might exceed the TTL duration.

After a quick search in the code, I discovered that the TTL is controlled by the cacheExpireDuration flag, with a default value of 30 minutes.

The reason for the issue became clear at this point:

  • Each time the user generates downsampling data, it is recorded in both the cache and the inverted index, with a cache TTL of 30 minutes.
  • After 30 minutes, the cache expires. An hour later, when the user generates new downsampling data, it cannot be found in the cache but still gets a hit in the (daily) inverted index.
  • Since the queries rely on the daily inverted index, they cannot be found at midnight even with index prefilling optimization. This leads to the data being treated as new time series, resulting in a high churn rate.

To confirm this, I asked the user to check the cache usage rate to see if it increases with each data generation and decreases after 30 minutes. Here are the results:
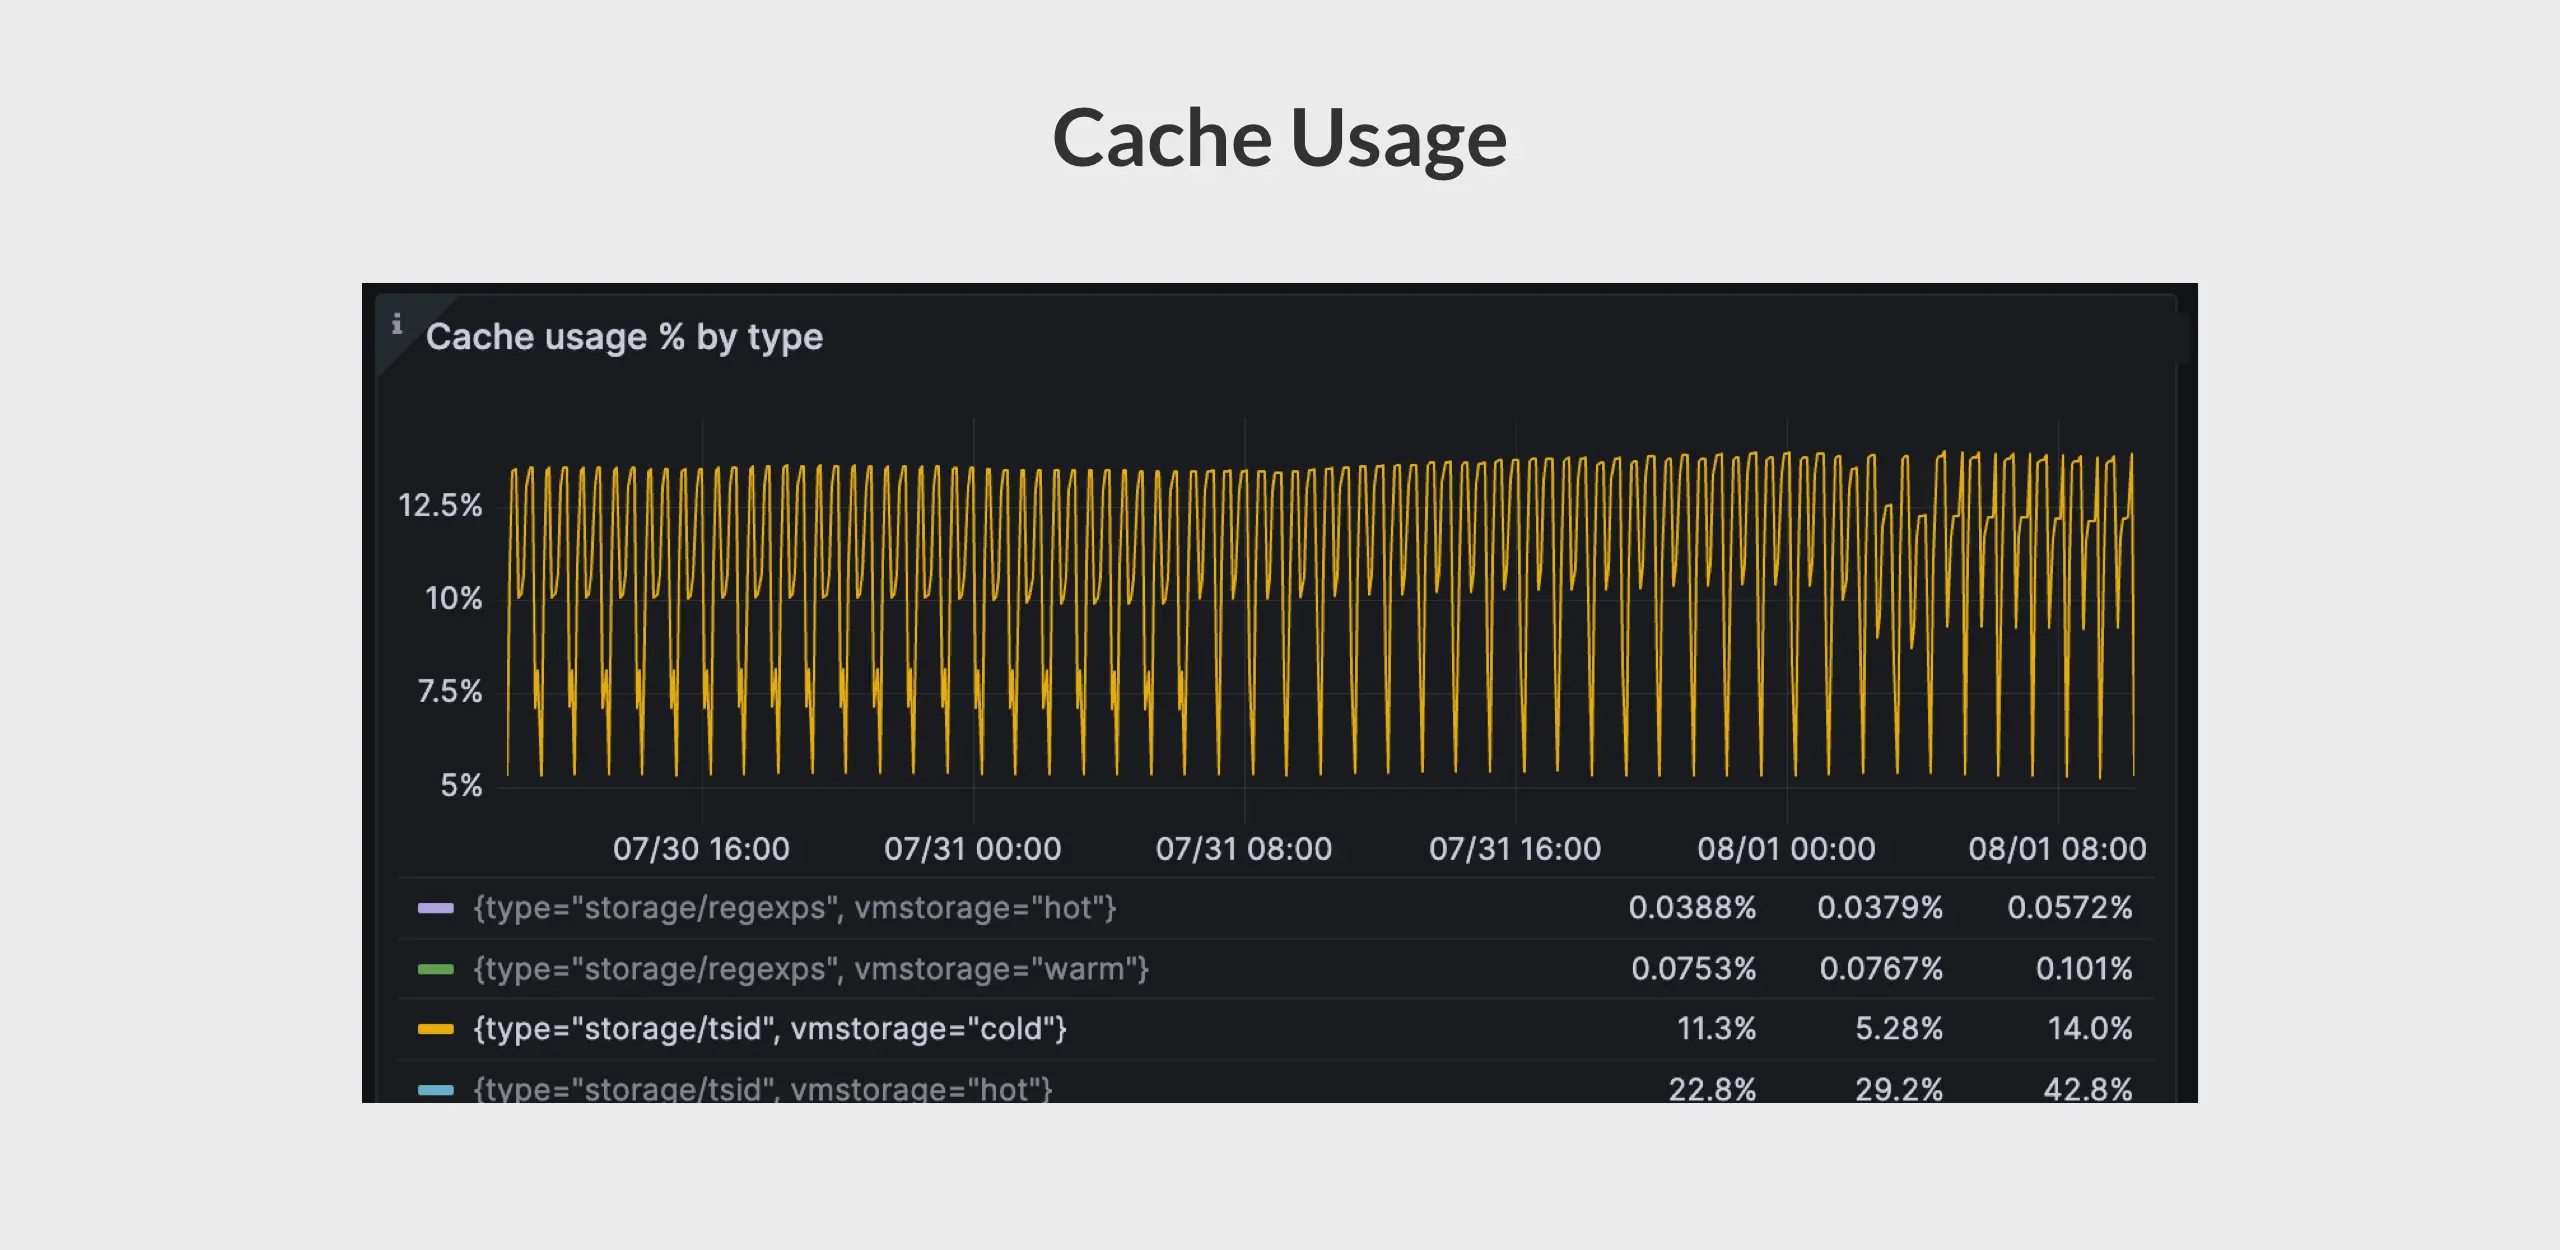
How To Fix It

#

It’s quite simple—adjust the cacheExpireDuration to a suitable duration based on the actual intervals of data generation.

Conclusion

#

In this blog post, we explored a high churn rate issue caused by daily index, cache TTL and ingestion interval. Ingesting samples over such a long interval is not common, forcing samples to adopt the slowest path of ingestion. But this case still serves well as an example to illustrate the concept of churn rate and its statistical approach within VictoriaMetrics.

In practice, processing each time series in VictoriaMetrics is more complex. For detailed implementation, please refer to the add function.

Bonus Section

#

After the user adjusted cacheExpireDuration to 90 minutes, covering the interval for generating downsampling data, the cache usage rate should ideally remain stable. However, the cache usage rate, as depicted in the graph, shows a different trend. Do you know why?
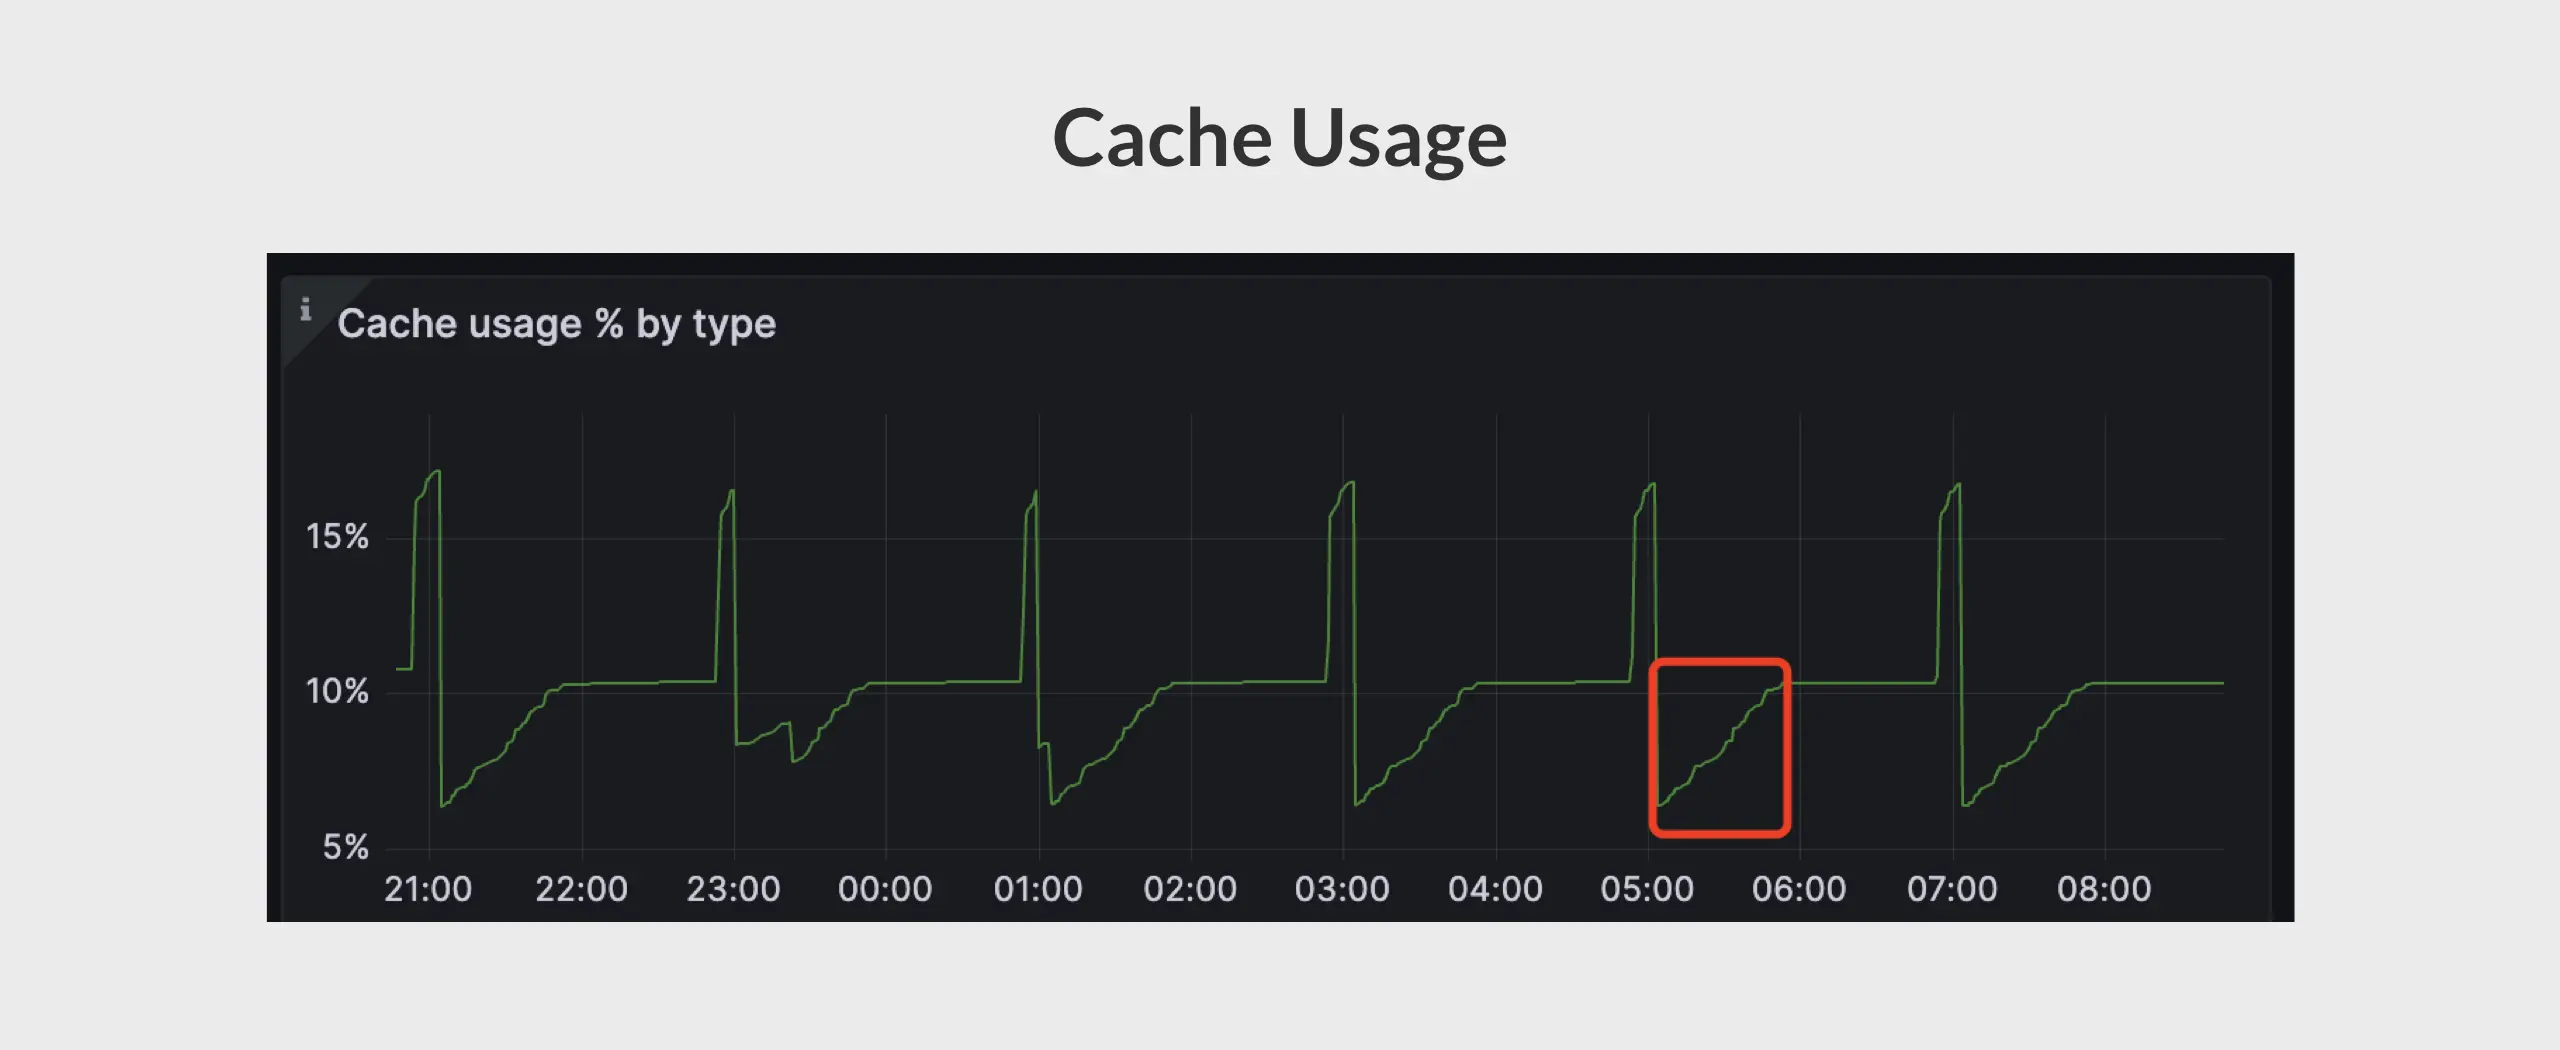
Hint: expirationWatcher.