
惯性聚合 高效追踪和阅读你感兴趣的博客、新闻、科技资讯
阅读原文 在惯性聚合中打开

推荐订阅源

博客园_首页
阮一峰的网络日志
阮一峰的网络日志
S
Secure Thoughts
Threat Intelligence Blog | Flashpoint
C
Cyber Attacks, Cyber Crime and Cyber Security
T
Threat Research - Cisco Blogs
P
Privacy & Cybersecurity Law Blog
The Hacker News
The Hacker News
H
Heimdal Security Blog
W
WeLiveSecurity
L
LINUX DO - 热门话题
Hacker News: Ask HN
Hacker News: Ask HN
WordPress大学
WordPress大学
The Last Watchdog
The Last Watchdog
Hugging Face - Blog
Hugging Face - Blog
博客园 - 【当耐特】
D
DataBreaches.Net
I
Intezer
Webroot Blog
Webroot Blog
C
Cisco Blogs
AWS News Blog
AWS News Blog
博客园 - 聂微东
T
The Blog of Author Tim Ferriss
V
Vulnerabilities – Threatpost
罗磊的独立博客
Google DeepMind News
N
Netflix TechBlog - Medium
Schneier on Security
宝玉的分享
宝玉的分享
博客园 - 叶小钗
PCI Perspectives
PCI Perspectives
D
Docker
Scott Helme
Scott Helme
NISL@THU
NISL@THU
J
Java Code Geeks
B
Blog RSS Feed
Google Online Security Blog
OSCHINA 社区最新新闻
OSCHINA 社区最新新闻
T
The Exploit Database - CXSecurity.com
AI
AI
美团技术团队
Cloudbric
Cloudbric
月光博客
月光博客
P
Proofpoint News Feed
T
Tailwind CSS Blog
Google DeepMind News
小众软件
小众软件
www.infosecurity-magazine.com
The Cloudflare Blog
cs.CV updates on arXiv.org

VictoriaMetrics: Simple & Reliable Monitoring for Everyone on VictoriaMetrics

Operator now has Long-Term Support (LTS) version Multi-tiered Observability: A Practical Way to Handle Diverse Workloads VictoriaMetrics April 2026 Ecosystem Updates Not All Telemetry Requires Premium Pricing VictoriaMetrics at KubeCon Amsterdam: Community Highlights What's new in VictoriaMetrics Anomaly Detection (Q1 2026) What's New in VictoriaMetrics Cloud Q1 2026? Logs, MCP Server, Better Alerting, and... a Secret Project VictoriaMetrics at KubeCon: Optimizing Tail Sampling in OpenTelemetry with Retroactive Sampling VictoriaMetrics March 2026 Ecosystem Updates Observability Lessons From OpenAI Benchmarking Kubernetes Log Collectors: vlagent, Vector, Fluent Bit, OpenTelemetry Collector, and more VictoriaMetrics February 2026 Ecosystem Updates VictoriaMetrics at FOSDEM, Cloud Native Days France, and CfgMgmtCamp Ghent VictoriaLogs in VictoriaMetrics Cloud: Fast, Cost-Effective Log Management is Here What’s new in VictoriaMetrics Anomaly Detection (2025) VictoriaMetrics January 2026 Ecosystem Updates VictoriaLogs Basics: What You Need to Know, with Examples & Visuals What's New in VictoriaMetrics Cloud Q4 2025? New tiers, more deployment options, IaC and alerting rules. Vibe coding tools observability with VictoriaMetrics Stack and OpenTelemetry How a US Software Provider Improved Traffic Alerting with VictoriaMetrics Anomaly Detection VictoriaMetrics 2025 Developer Experience: A Year in Review Spotify’s performance & control across large monitoring environments with VictoriaMetrics VictoriaMetrics Achieves Red Hat OpenShift Operator Certification Our latest updates across the VictoriaMetrics Observability ecosystem New Capacity Tiers in VictoriaMetrics Cloud Announcing 1B+ Downloads & Product Development With Logs, Traces, Metrics AI Agents Observability with OpenTelemetry and the VictoriaMetrics Stack Discarding gRPC-Go: The Story Behind OTLP/gRPC Support in VictoriaTraces What's New in VictoriaMetrics Cloud Q3 2025? From new region in Asia to proactive alerts How DreamHost Slashed Memory Usage by 80% and Scaled to 76 Million Time Series Upcoming Conferences & Meetups: Where to Meet Our Team VictoriaMetrics Long-Term Support (LTS): H2 2025 Update Creating a Sustainable Open Source Business Model - Introduction Full-Stack Observability with VictoriaMetrics in the OTel Demo Alerting Best Practices vmanomaly Deep Dive: Smarter Alerting with AI (Tech Talk Companion) VictoriaLogs Practical Ingestion Guide for Message, Time and Streams Monotonic and Wall Clock Time in the Go time package Hello Singapore! VictoriaMetrics Cloud Expands to Asia Pacific MCP Server Integration & Much More: What's New in VictoriaMetrics Cloud Q2 2025 FIPS 140-3 Compatible Builds for VictoriaMetrics Enterprise Components VictoriaLogs Unleashed: Cluster Version Now Available for Exceptional, Linear Scaling Integrations made easy with VictoriaMetrics Cloud Developer's Note: Research on Distributed Tracing, Comparing With Tempo and ClickHouse vmagent: Key Features Explained in Under 15 Minutes Go synctest: Solving Flaky Tests vmalert: Maximize Your Monitoring (Tech Talk Companion) Celebrating 14K Stars on GitHub: Spring Update vmalert: Maximize Your Monitoring VictoriaMetrics Connects with the Open Source Community at LinuxFest Northwest 2025 Graceful Shutdown in Go: Practical Patterns VictoriaLogs: Gaps, Gains & Growth Prometheus Monitoring: Functions, Subqueries, Operators, and Modifiers VictoriaMetrics Cloud: What's New in Q1 2025? Don’t default to microservices: You’ll thank us later! Container CPU Requests & Limits Explained with GOMAXPROCS Tuning gRPC in Go: Streaming RPCs, Interceptors, and Metadata From Chaos to Clarity with VictoriaLogs Prometheus Alerting 101: Rules, Recording Rules, and Alertmanager Heading to London: Meet Our Team at KubeCon Europe 2025 Inside vmselect: The Query Processing Engine of VictoriaMetrics Meet Our Team at Scale 22x Practical Protobuf - From Basic to Best Practices VictoriaLogs Status Update: Heading Towards the Cluster Version 24th of February 2025 Statement: VictoriaMetrics Stands with Ukraine! Prometheus Metrics Explained: Counters, Gauges, Histograms & Summaries Prometheus Monitoring: Instant Queries and Range Queries Explained 300%+ Growth in 2024: Join Our Team in 2025! FOSDEM 2025 recap How Protobuf Works—The Art of Data Encoding OpenTelemetry, Prometheus, and More: Which Is Better for Metrics Collection and Propagation? How vmstorage Handles Query Requests From vmselect How vmstorage's IndexDB Works VictoriaMetrics Tech Talk Stream: A Deep Dive into Blackbox Monitoring How HTTP/2 Works and How to Enable It in Go VictoriaMetrics Cloud: What's New in Q4 2024? How vmstorage Processes Data: Retention, Merging, Deduplication,... How vmstorage Handles Data Ingestion From vminsert When Metrics Meet vminsert: A Data-Delivery Story From net/rpc to gRPC in Go Applications Piros | VictoriaMetrics Partner Allenta | VictoriaMetrics Partner CloudRaft | VictoriaMetrics Partner Sensedia & VictoriaMetrics: API-compatible Efficient Storage Scalable Prometheus: Why DSV Chose VictoriaMetrics Sensor Factory | VictoriaMetrics Partner Erythix | VictoriaMetrics Partner Groove X & VictoriaMetrics: Faster Device Health Monitoring Scaled & Performant Monitoring at Spotify with VictoriaMetrics Grammarly & VictoriaMetrics: 10× Lower Costs & Direct Access Zelarsoft | VictoriaMetrics Partner DFKI & VictoriaMetrics: Efficient Long-Term Metric Storage Niubits | VictoriaMetrics Partner Megazone Cloud | VictoriaMetrics Partner Cogito Software | VictoriaMetrics Partner Bajau | VictoriaMetrics Partner Find Out Why Dig Security Chose VictoriaMetrics! Ness | VictoriaMetrics Partner Alpha Data | VictoriaMetrics Partner SIOS Technology | VictoriaMetrics Partner
vmagent High-Availability Examples
Yurii Kravets · 2022-05-10 · via VictoriaMetrics: Simple & Reliable Monitoring for Everyone on VictoriaMetrics

vmagent supports both the pushing and pulling (scrape) of metrics and here are examples of high availability setups for both cases.
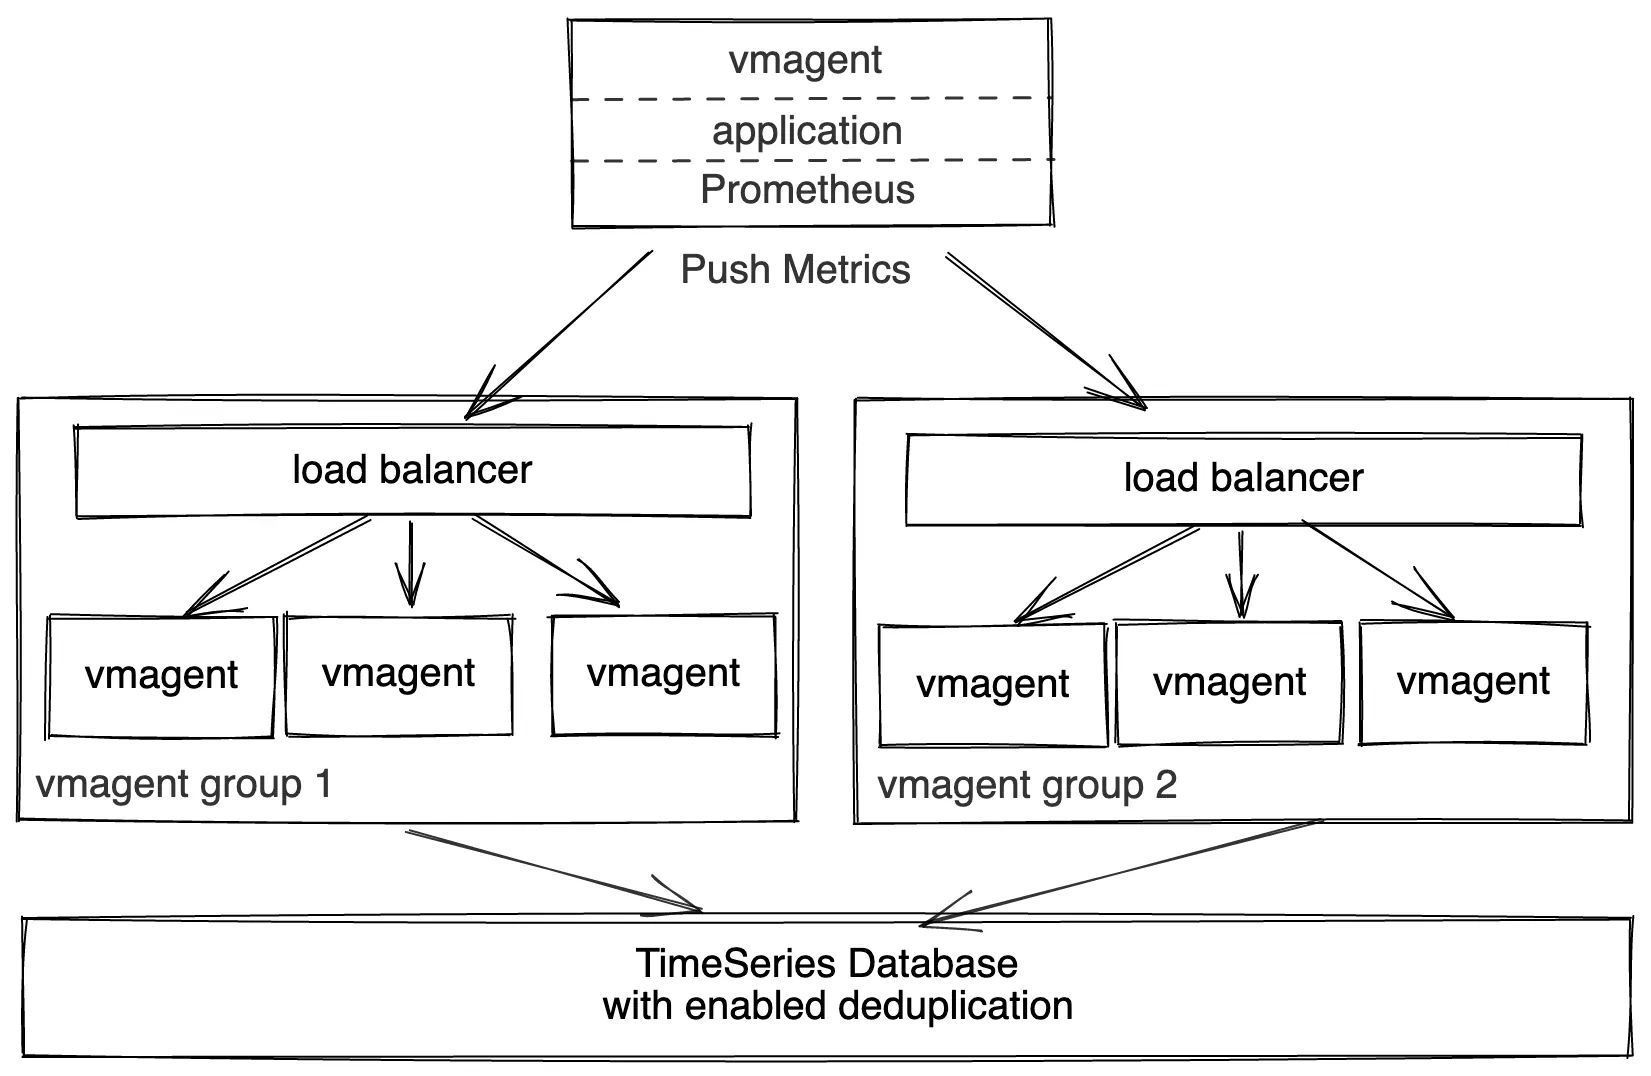
Push and High Availability

#

vmagent push model high availability vmagent push model high availability

Multiple sources can push data simultaneously to two groups of identically configured vmagents via the following supported push protocols:

  • InfluxDB line protocol
  • DataDog “submit metrics” API
  • Graphite plaintext protocol
  • OpenTSDB http and telnet protocols
  • Arbitrary CSV
  • JSON line protocol
  • Prometheus remote write protocol
  • Prometheus metrics exposition format

The groups must be located in distinct availability zones for high availability puproses. E.g. when a group in a single AZ becomes unavailable, the collected data continues flowing to the group in another AZ.

The load-balancer in front of vmagent groups serves the following purposes:

  • Horizontal scalability. If existing vmagent nodes in the group reach their scalability limits, then just add new vmagent nodes in order to process larger amounts of data.
  • High availability. If a single vmagent becomes unavailable, then the load-balancer continues routing the incoming data via the remaining available vmagent nodes.

vmagent nodes push the incoming data to VictoriaMetrics (either single-node or cluster version may be used for storing the data).

The deduplication must be set up at VictoriaMetrics in order to remove duplicate samples received via two vmagent groups. See how to deduplicate data in single-node VictoriaMetrics and how to deduplicate data in the cluster version of VictoriaMetrics.
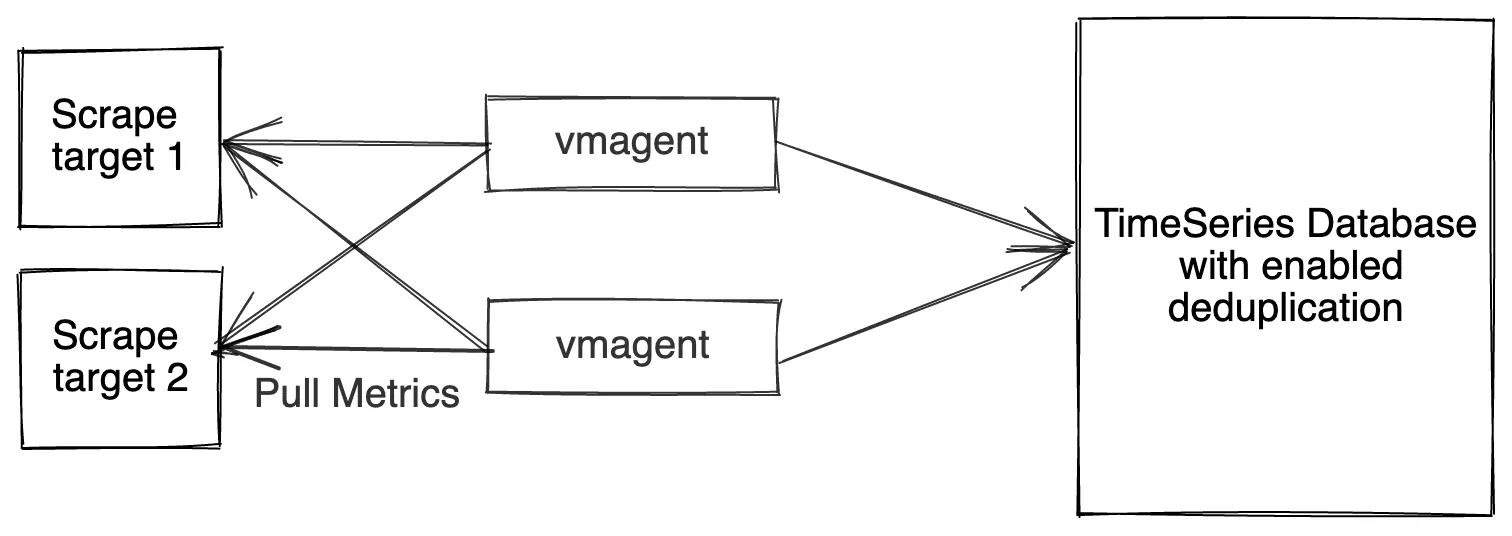
Pull and High Availability for small-to-medium loads

#

vmagent pull model high availability for small-to-medium loads vmagent pull model high availability for small-to-medium loads

Two identically configured vmagent instances scrape the same targets and send the collected metrics to VictoriaMetrics (either single-node or cluster version may be used for storing the data). If a single vmagent instance is temporarily unavailable, then the remaining vmagent continues scraping the metrics. This prevents gaps in the collected data at VictoriaMetrics.

The deduplication must be set up at VictoriaMetrics in order to remove duplicate samples received via two vmagent instances. See how to deduplicate data in single-node VictoriaMetrics and how to deduplicate data in the cluster version of VictoriaMetrics.
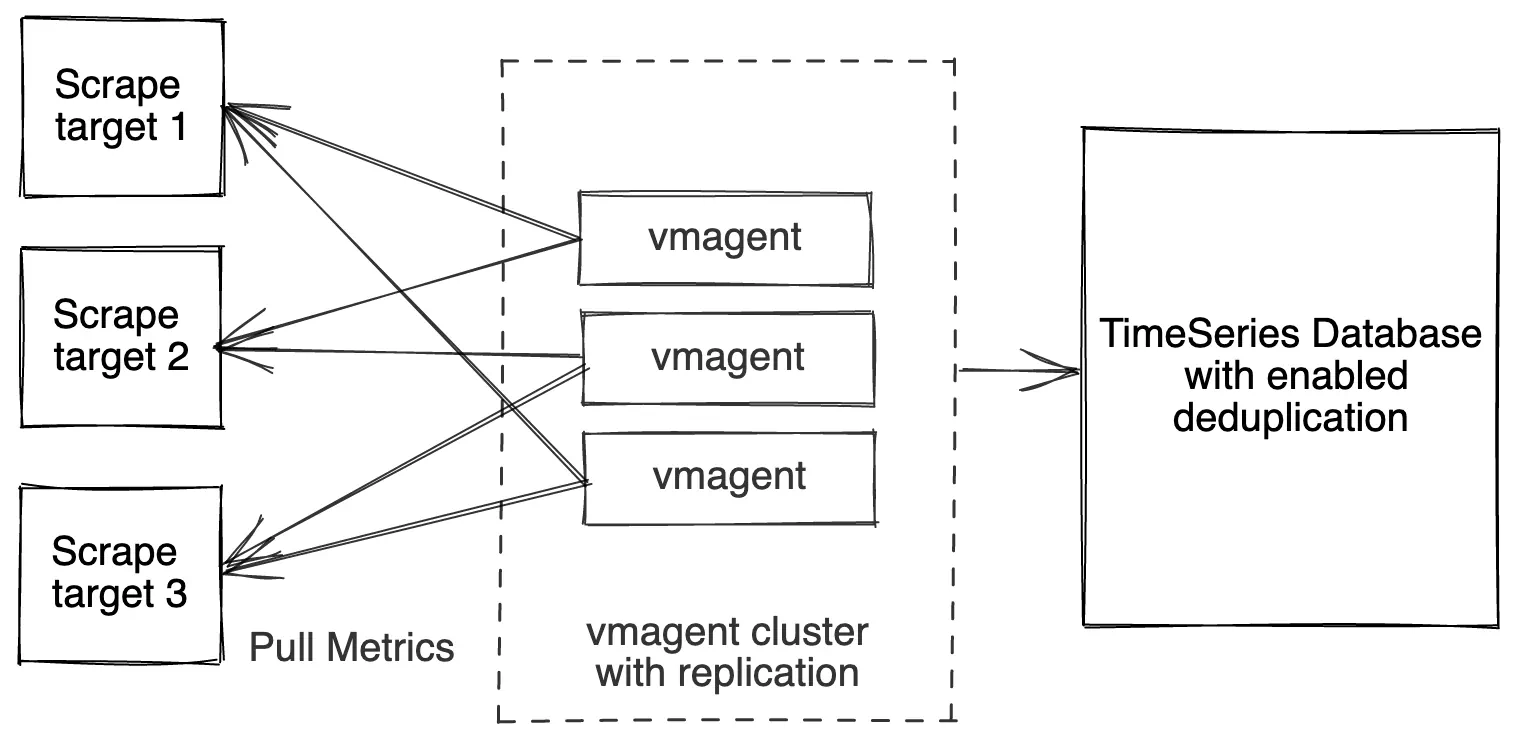
Pull and High Availability for high loads

#

vmagent pull model high availability for high loads vmagent pull model high availability for high loads

If a single vmagent has no enough resources for scraping the needed targets, then it is possible to spread scrape targets among a group of vmagent instances. This can be achieved with the following command-line flags:

  • -promscrape.cluster.membersCount - the number of members in the group of vmagent instances
  • -promscrape.cluster.memberNum - unique index of vmagent instance in the group
  • -promscrape.cluster.replicationFactor - the number of vmagent instances in the cluster, which scrape every configured target

Every vmagent instance in the group must have identical -promscrape.config files and identical command-line flags except of -promscrape.cluster.memberNum flag. Every vmagent instance must have unique value for the -promscrape.cluster.memberNum flag in the range [0 .. promscrape.cluster.membersCount-1]. In this setup every vmagent instance scrapes promscrape.cluster.replicationFactor / promscrape.cluster.membersCount part of all the scrape targets defined at -promscrape.config (including dynamically discovered scrape targets).

If -promscrape.cluster.replicationFactor is set to a value greater than 1, then deduplication must be set up at VictoriaMetrics in order to remove duplicate samples received from vmagent replicas. See how to deduplicate data in single-node VictoriaMetrics and how to deduplicate data in the cluster version of VictoriaMetrics.

Give it a try and please do share your feedback or ask us any questions via the comments section below. We’d love to know your experience!