

惯性聚合 高效追踪和阅读你感兴趣的博客、新闻、科技资讯
阅读原文 在惯性聚合中打开

推荐订阅源

B
Blog
V
Vulnerabilities – Threatpost
P
Proofpoint News Feed
Google DeepMind News
Y
Y Combinator Blog
V
Visual Studio Blog
阮一峰的网络日志
阮一峰的网络日志
腾讯CDC
月光博客
月光博客
T
Troy Hunt's Blog
博客园_首页
H
Hackread – Cybersecurity News, Data Breaches, AI and More
N
Netflix TechBlog - Medium
Microsoft Security Blog
Recorded Future
Recorded Future
Blog — PlanetScale
Blog — PlanetScale
Threat Intelligence Blog | Flashpoint
Scott Helme
Scott Helme
T
Threat Research - Cisco Blogs
P
Palo Alto Networks Blog
T
The Exploit Database - CXSecurity.com
Simon Willison's Weblog
Know Your Adversary
Know Your Adversary
SecWiki News
SecWiki News
Security Archives - TechRepublic
T
Threatpost
Forbes - Security
Forbes - Security
S
Schneier on Security
P
Proofpoint News Feed
T
Tor Project blog
Cyberwarzone
Cyberwarzone
The Hacker News
The Hacker News
Cloudbric
Cloudbric
S
Security @ Cisco Blogs
Webroot Blog
Webroot Blog
Attack and Defense Labs
Hacker News: Ask HN
Hacker News: Ask HN
Google DeepMind News
Hacker News - Newest:
Hacker News - Newest: "LLM"
C
CERT Recently Published Vulnerability Notes
The Last Watchdog
The Last Watchdog
cs.CV updates on arXiv.org
S
SegmentFault 最新的问题
V
V2EX
量子位
B
Blog RSS Feed
宝玉的分享
宝玉的分享
T
The Blog of Author Tim Ferriss
罗磊的独立博客
J
Java Code Geeks

VictoriaMetrics: Simple & Reliable Monitoring for Everyone on VictoriaMetrics

Operator now has Long-Term Support (LTS) version Multi-tiered Observability: A Practical Way to Handle Diverse Workloads VictoriaMetrics April 2026 Ecosystem Updates Not All Telemetry Requires Premium Pricing VictoriaMetrics at KubeCon Amsterdam: Community Highlights What's new in VictoriaMetrics Anomaly Detection (Q1 2026) What's New in VictoriaMetrics Cloud Q1 2026? Logs, MCP Server, Better Alerting, and... a Secret Project VictoriaMetrics at KubeCon: Optimizing Tail Sampling in OpenTelemetry with Retroactive Sampling VictoriaMetrics March 2026 Ecosystem Updates Observability Lessons From OpenAI Benchmarking Kubernetes Log Collectors: vlagent, Vector, Fluent Bit, OpenTelemetry Collector, and more VictoriaMetrics February 2026 Ecosystem Updates VictoriaMetrics at FOSDEM, Cloud Native Days France, and CfgMgmtCamp Ghent VictoriaLogs in VictoriaMetrics Cloud: Fast, Cost-Effective Log Management is Here What’s new in VictoriaMetrics Anomaly Detection (2025) VictoriaMetrics January 2026 Ecosystem Updates VictoriaLogs Basics: What You Need to Know, with Examples & Visuals What's New in VictoriaMetrics Cloud Q4 2025? New tiers, more deployment options, IaC and alerting rules. Vibe coding tools observability with VictoriaMetrics Stack and OpenTelemetry How a US Software Provider Improved Traffic Alerting with VictoriaMetrics Anomaly Detection VictoriaMetrics 2025 Developer Experience: A Year in Review Spotify’s performance & control across large monitoring environments with VictoriaMetrics VictoriaMetrics Achieves Red Hat OpenShift Operator Certification Our latest updates across the VictoriaMetrics Observability ecosystem New Capacity Tiers in VictoriaMetrics Cloud Announcing 1B+ Downloads & Product Development With Logs, Traces, Metrics AI Agents Observability with OpenTelemetry and the VictoriaMetrics Stack Discarding gRPC-Go: The Story Behind OTLP/gRPC Support in VictoriaTraces What's New in VictoriaMetrics Cloud Q3 2025? From new region in Asia to proactive alerts How DreamHost Slashed Memory Usage by 80% and Scaled to 76 Million Time Series Upcoming Conferences & Meetups: Where to Meet Our Team VictoriaMetrics Long-Term Support (LTS): H2 2025 Update Creating a Sustainable Open Source Business Model - Introduction Full-Stack Observability with VictoriaMetrics in the OTel Demo Alerting Best Practices vmanomaly Deep Dive: Smarter Alerting with AI (Tech Talk Companion) VictoriaLogs Practical Ingestion Guide for Message, Time and Streams Monotonic and Wall Clock Time in the Go time package Hello Singapore! VictoriaMetrics Cloud Expands to Asia Pacific MCP Server Integration & Much More: What's New in VictoriaMetrics Cloud Q2 2025 FIPS 140-3 Compatible Builds for VictoriaMetrics Enterprise Components VictoriaLogs Unleashed: Cluster Version Now Available for Exceptional, Linear Scaling Integrations made easy with VictoriaMetrics Cloud Developer's Note: Research on Distributed Tracing, Comparing With Tempo and ClickHouse vmagent: Key Features Explained in Under 15 Minutes Go synctest: Solving Flaky Tests vmalert: Maximize Your Monitoring (Tech Talk Companion) Celebrating 14K Stars on GitHub: Spring Update vmalert: Maximize Your Monitoring VictoriaMetrics Connects with the Open Source Community at LinuxFest Northwest 2025 Graceful Shutdown in Go: Practical Patterns VictoriaLogs: Gaps, Gains & Growth Prometheus Monitoring: Functions, Subqueries, Operators, and Modifiers VictoriaMetrics Cloud: What's New in Q1 2025? Don’t default to microservices: You’ll thank us later! Container CPU Requests & Limits Explained with GOMAXPROCS Tuning gRPC in Go: Streaming RPCs, Interceptors, and Metadata From Chaos to Clarity with VictoriaLogs Prometheus Alerting 101: Rules, Recording Rules, and Alertmanager Heading to London: Meet Our Team at KubeCon Europe 2025 Inside vmselect: The Query Processing Engine of VictoriaMetrics Meet Our Team at Scale 22x Practical Protobuf - From Basic to Best Practices VictoriaLogs Status Update: Heading Towards the Cluster Version 24th of February 2025 Statement: VictoriaMetrics Stands with Ukraine! Prometheus Metrics Explained: Counters, Gauges, Histograms & Summaries Prometheus Monitoring: Instant Queries and Range Queries Explained 300%+ Growth in 2024: Join Our Team in 2025! FOSDEM 2025 recap How Protobuf Works—The Art of Data Encoding OpenTelemetry, Prometheus, and More: Which Is Better for Metrics Collection and Propagation? How vmstorage's IndexDB Works VictoriaMetrics Tech Talk Stream: A Deep Dive into Blackbox Monitoring How HTTP/2 Works and How to Enable It in Go VictoriaMetrics Cloud: What's New in Q4 2024? How vmstorage Processes Data: Retention, Merging, Deduplication,... How vmstorage Handles Data Ingestion From vminsert When Metrics Meet vminsert: A Data-Delivery Story From net/rpc to gRPC in Go Applications VictoriaMetrics helps IHI Terrasun Win Big in Vegas on $1.2B Clean Energy Project Piros | VictoriaMetrics Partner Allenta | VictoriaMetrics Partner CloudRaft | VictoriaMetrics Partner Sensedia & VictoriaMetrics: API-compatible Efficient Storage Scalable Prometheus: Why DSV Chose VictoriaMetrics Sensor Factory | VictoriaMetrics Partner Erythix | VictoriaMetrics Partner Groove X & VictoriaMetrics: Faster Device Health Monitoring Scaled & Performant Monitoring at Spotify with VictoriaMetrics Grammarly & VictoriaMetrics: 10× Lower Costs & Direct Access Zelarsoft | VictoriaMetrics Partner DFKI & VictoriaMetrics: Efficient Long-Term Metric Storage Niubits | VictoriaMetrics Partner Megazone Cloud | VictoriaMetrics Partner Cogito Software | VictoriaMetrics Partner Bajau | VictoriaMetrics Partner Find Out Why Dig Security Chose VictoriaMetrics! Ness | VictoriaMetrics Partner Alpha Data | VictoriaMetrics Partner SIOS Technology | VictoriaMetrics Partner
How vmstorage Handles Query Requests From vmselect
Phuong Le · 2025-02-03 · via VictoriaMetrics: Simple & Reliable Monitoring for Everyone on VictoriaMetrics

This piece is part of our ongoing VictoriaMetrics series, where we break down how different components of the system function:

  1. How VictoriaMetrics Agent (vmagent) Works
  2. How vmstorage Handles Data Ingestion
  3. How vmstorage Processes Data: Retention, Merging, Deduplication,…
  4. When Metrics Meet vminsert: A Data-Delivery Story
  5. How vmstorage’s IndexDB Works
  6. How vmstorage Handles Query Requests From vmselect (We’re here)
  7. Inside vmselect: The Query Processing Engine of VictoriaMetrics

This discussion assumes you’ve checked out the earlier articles, which cover how vmstorage’s IndexDB works.

Receiving Requests From vmselect

#

By default, vmstorage listens for connections from vmselect on a dedicated TCP port, 8401 (configured with -vmselectAddr).

Whenever vmselect connects, the two start a handshake process to negotiate details like the compression algorithm. Unless you’ve explicitly disabled it (-rpc.disableCompression=false), vmstorage will compress the data it sends back to vmselect to save bandwidth.

Requests coming from vmselect follow this general structure:

<rpcName> <traceEnable?> <timeout> <request>

Now, vmselect doesn’t just send query requests—it asks vmstorage a variety of things, each tied to a specific rpcName. Here are a few examples:

  • search_v7 – This is the one we’re focusing on today. It handles the main search query for time series data.
  • deleteSeries_v5 – Used to delete time series data that matches specific criteria. This removes data points from storage.
  • seriesCount_v4 – Returns a single number representing the total number of series in storage.
  • searchMetricNames_v3 – Searches for metric names based on specific criteria.

Let’s stick to the star of the show: the search_v7 request format:

["search_v7"][traceEnable?][timeout][search-request]

One cool thing about this is the tracing feature (-traceEnable), which happens to be one of my favorites. Tracing lets you locate bottlenecks during query processing — think of it as the equivalent of EXPLAIN ANALYZE in PostgreSQL. It shows you the exact steps a query goes through and how much time each one takes.

If you’re curious, there’s an excellent article that dives into this feature: How to reduce expenses on monitoring - Roman Khavronenko.

There’s also a timeout on requests from vmselect, which is set to 30 seconds by default. We’ll talk more about this timeout in the vminsert article, so let’s leave it for now.

  • Current active connections from vmselect: vm_vmselect_conns
  • How many connection errors with vmselect nodes: vm_vmselect_conn_errors_total
  • How many requests are search queries: vm_vmselect_rpc_requests_total{action="search"}

Just like it does with vminsert, vmstorage applies a concurrency limit to RPC requests from vmselect. This is controlled by -search.maxConcurrentRequests, which, by default, allows up to 2x your CPU cores worth of concurrent RPC requests. If the number of requests exceeds that, they’ll wait in a queue for up to 10 seconds (-search.maxQueueDuration) before being rejected.

If you’re dealing with a slow network or running into network bottlenecks, increasing these limits might help as it brings the workload to the CPU. Otherwise, it’s better to leave them as they are.

Find Metric IDs (and TSIDs) of Timeseries

#

Let’s say you want to search for metrics in the timeseries http_request_total{status!="500"} across two days: 2024-01-01 and 2024-01-02.

IndexDB takes the filter tags from vmselect, __name__=http_request_total and status=500. The main goal at this stage is to find the metric IDs for all timeseries that match the filter tags. These could be:

  • 41: http_request_total{url="/metrics",status="500",method="GET"}
  • 124: http_request_total{url="/insert",status="500",method="POST"}
  • 495: http_request_total{url="/query",status="500",method="GET"}

To speed things up, IndexDB has an in-memory cache that stores the metric IDs for tag filters. For example, it might check if the key 2024-01-01 2024-01-02 http_request_total status=500 is already in the cache. This tag-filter cache uses 3% of vmstorage’s total memory (-storage.cacheSizeIndexDBTagFilters).

If there’s a cache miss, vmstorage searches the current IndexDB. It chooses between two indexes:

  • The per-day index tag to metric IDs: if your query covers a range of 40 days or less.
  • The global index tag to metric IDs: for longer ranges.

Let’s focus on the per-day index since it also explains how the global index works.

For the example query, vmstorage identifies the days it needs to search: 2024-01-01 and 2024-01-02. It then searches those days in parallel using the prefixes 6 2024-01-01 http_request_total and 6 2024-01-02 status=500 (or composite index 6 2024-01-01 http_request_total,status=500, but let’s keep it simple).

At this point, it scans the in-memory part, small parts, big parts in IndexDB to find the metric IDs for the relevant tags.

Fortunately, vmstorage doesn’t search every part. It can skip parts that aren’t relevant just by looking at the last item in each part:
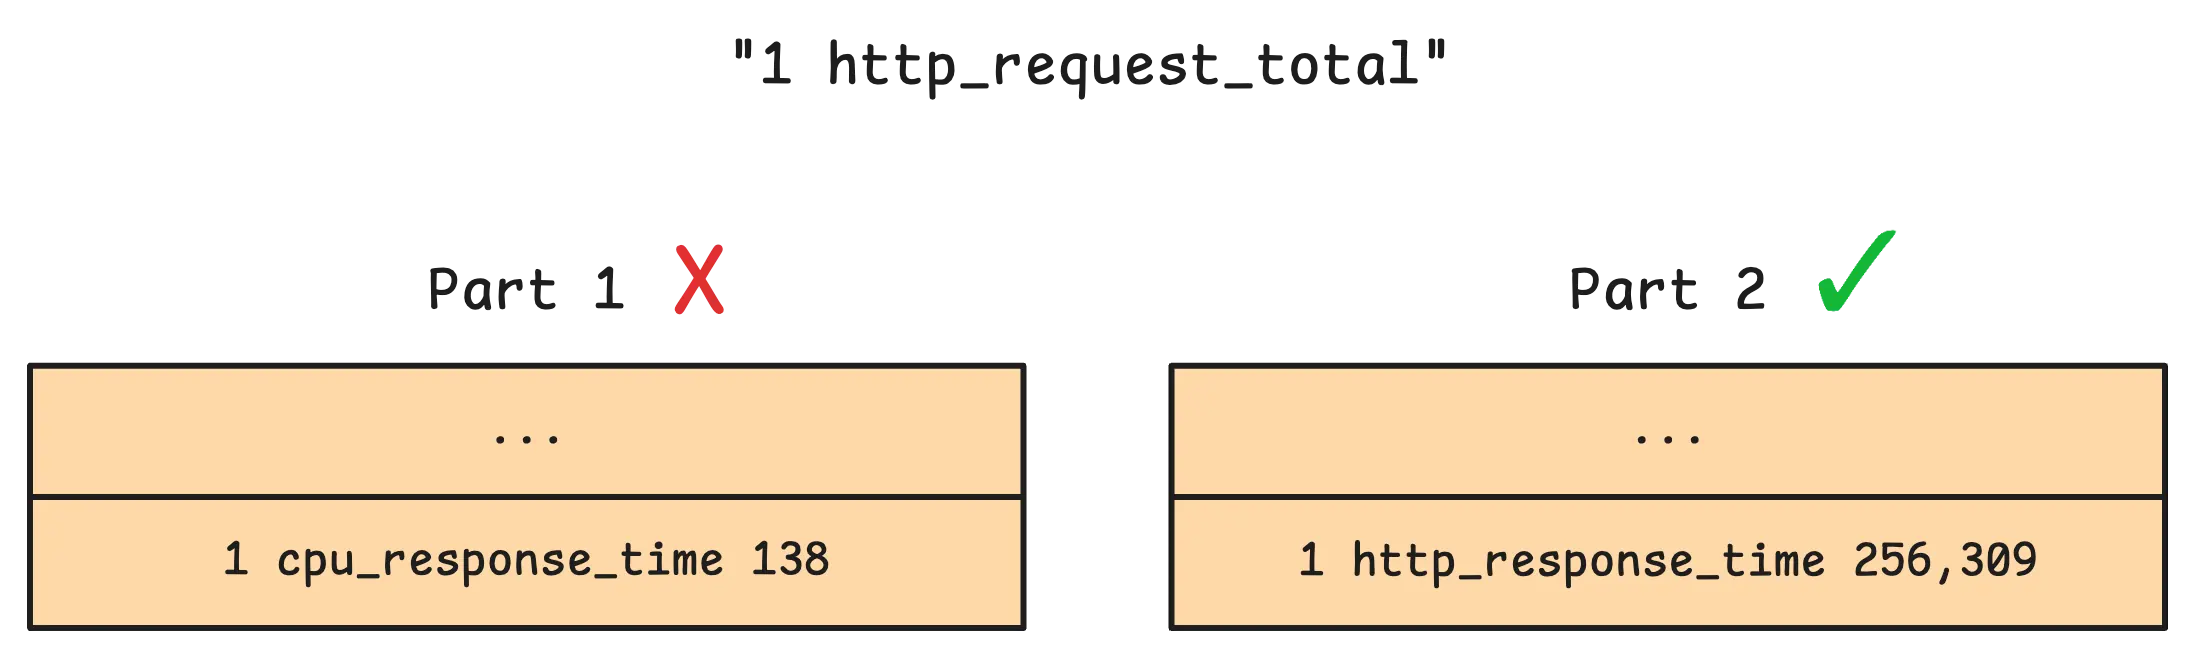
Parts filtered using last item boundaries

Parts filtered using last item boundaries

This works because each part is sorted alphabetically. By comparing the query’s boundaries to the last item in a part, vmstorage can quickly decide whether that part needs to be searched or can be safely ignored.

Now, vmstorage uses the pre-loaded metaindex.bin file to figure out the first block it needs to read, then starts loading rows from index.bin into memory, one by one.

If you remember, each row in index.bin is an array of block headers. To make things faster, vmstorage keeps a small cache for these index rows, so it doesn’t have to constantly read them from disk. By default, this cache takes up 10% of vmstorage’s total memory (-storage.cacheSizeIndexDBIndexBlocks).
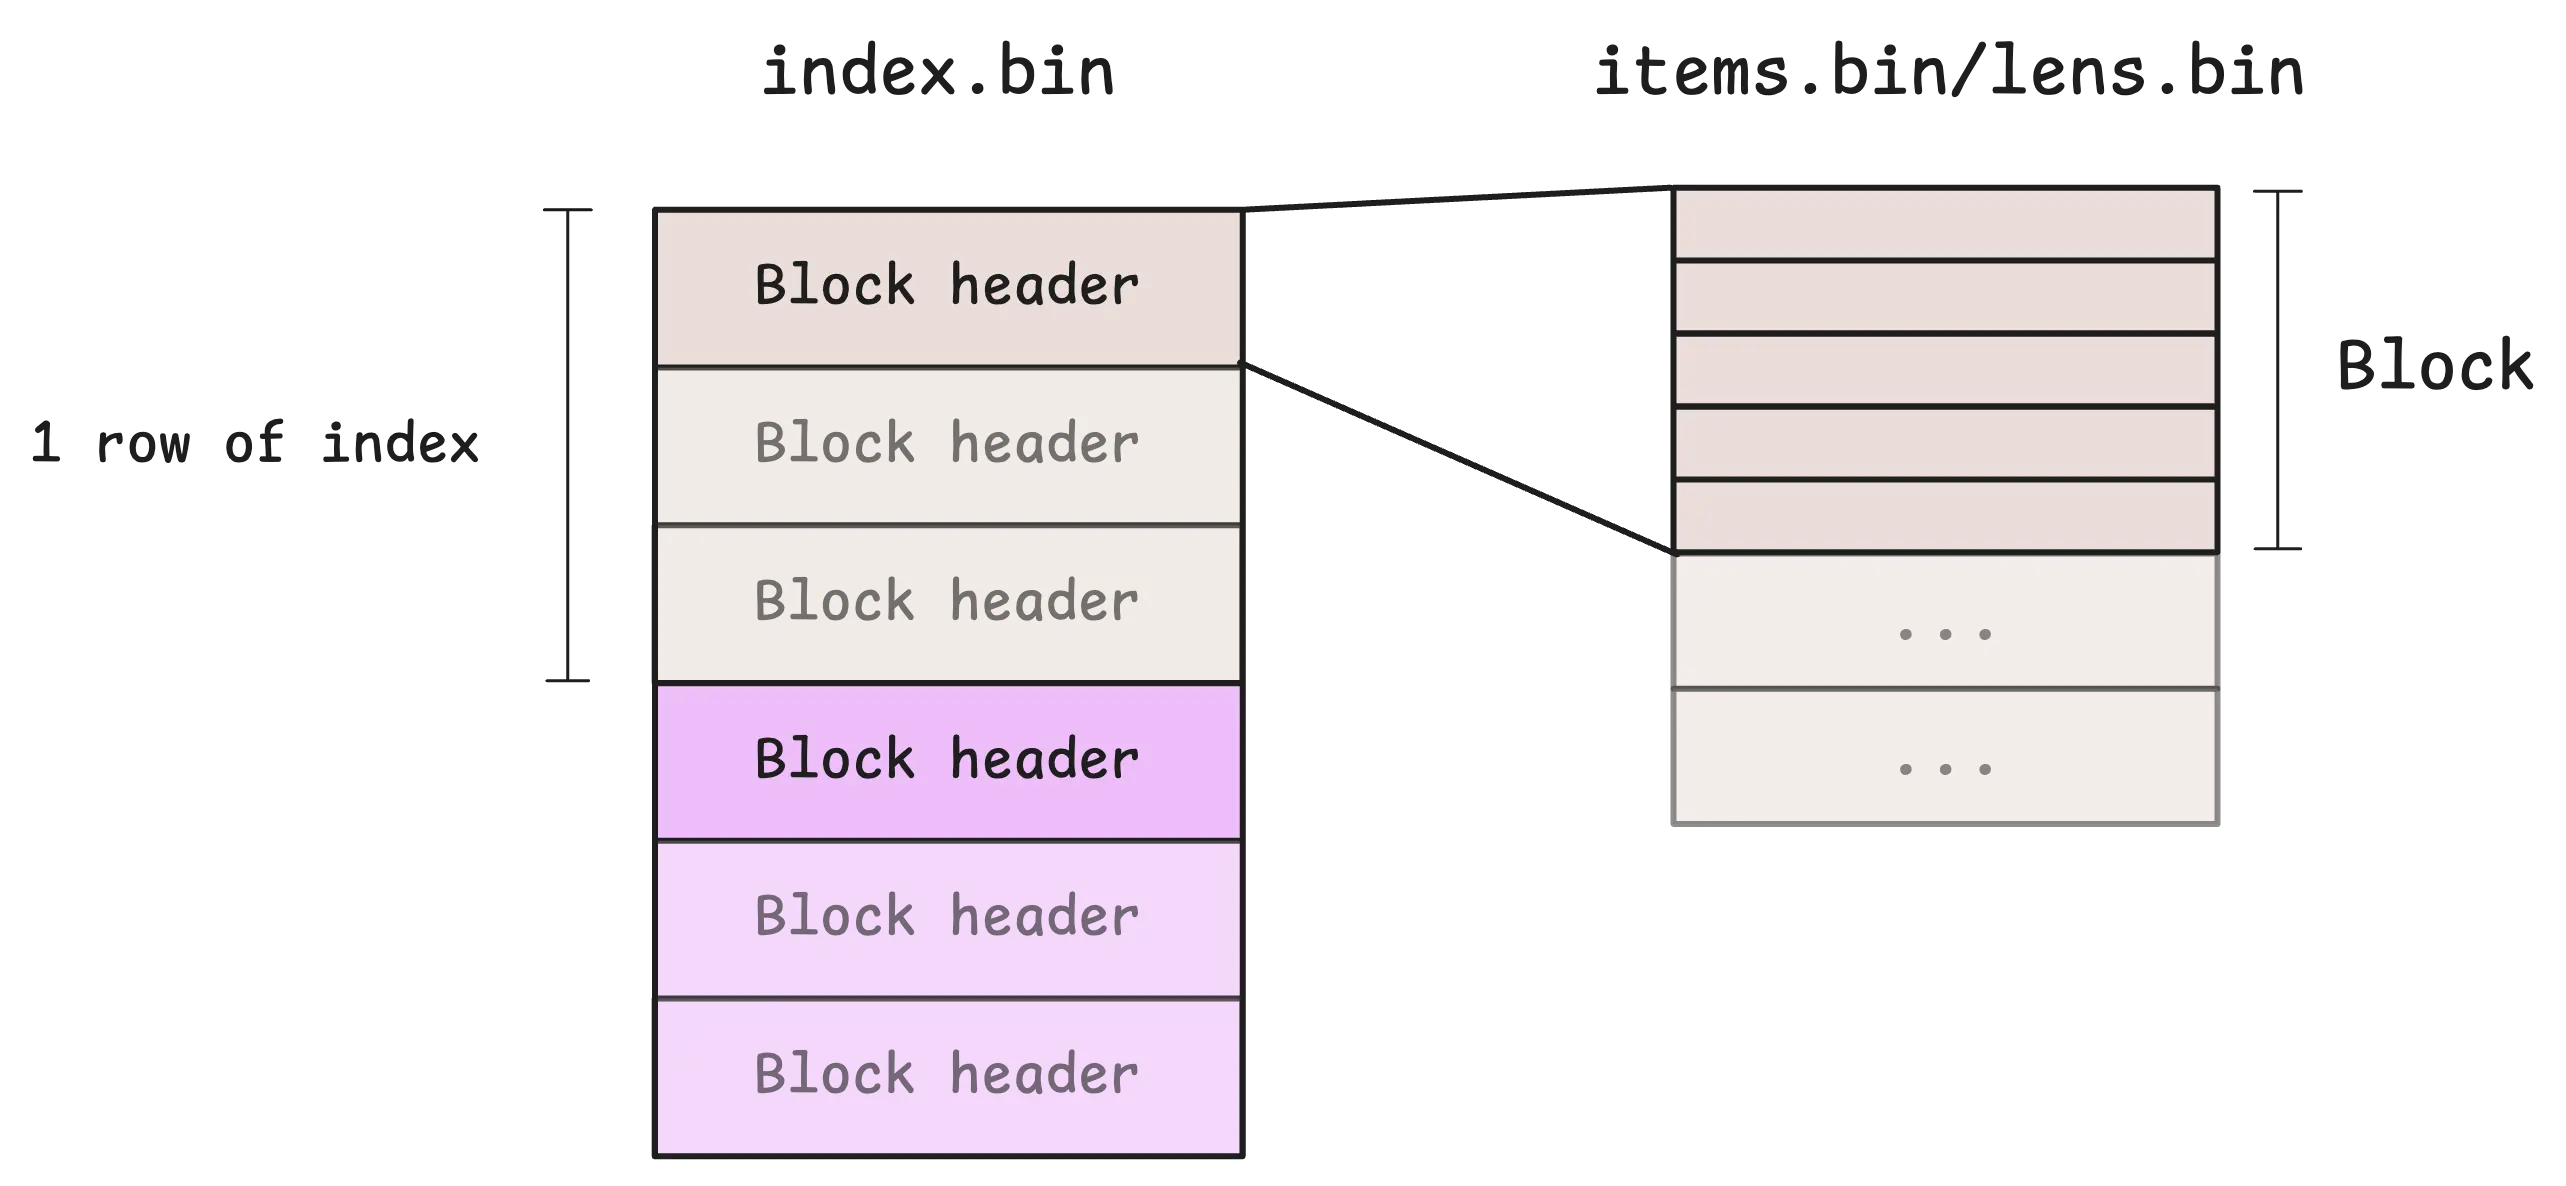
IndexDB index.bin file

IndexDB index.bin file

Once vmstorage has the block headers, it knows how to load the actual blocks from items.bin and lens.bin. To avoid loading from disk, there’s also a small cache here for frequently accessed blocks, which uses 25% of the total memory by default (-storage.cacheSizeIndexDBDataBlocks).

After loading the target block into memory, it’s all about comparisons.

For instance, vmstorage only need to compare the prefix 6 2024-01-01 http_request_total against every row of the block (rows in the block are sorted by prefix so we can stop once we find a row that doesn’t match).
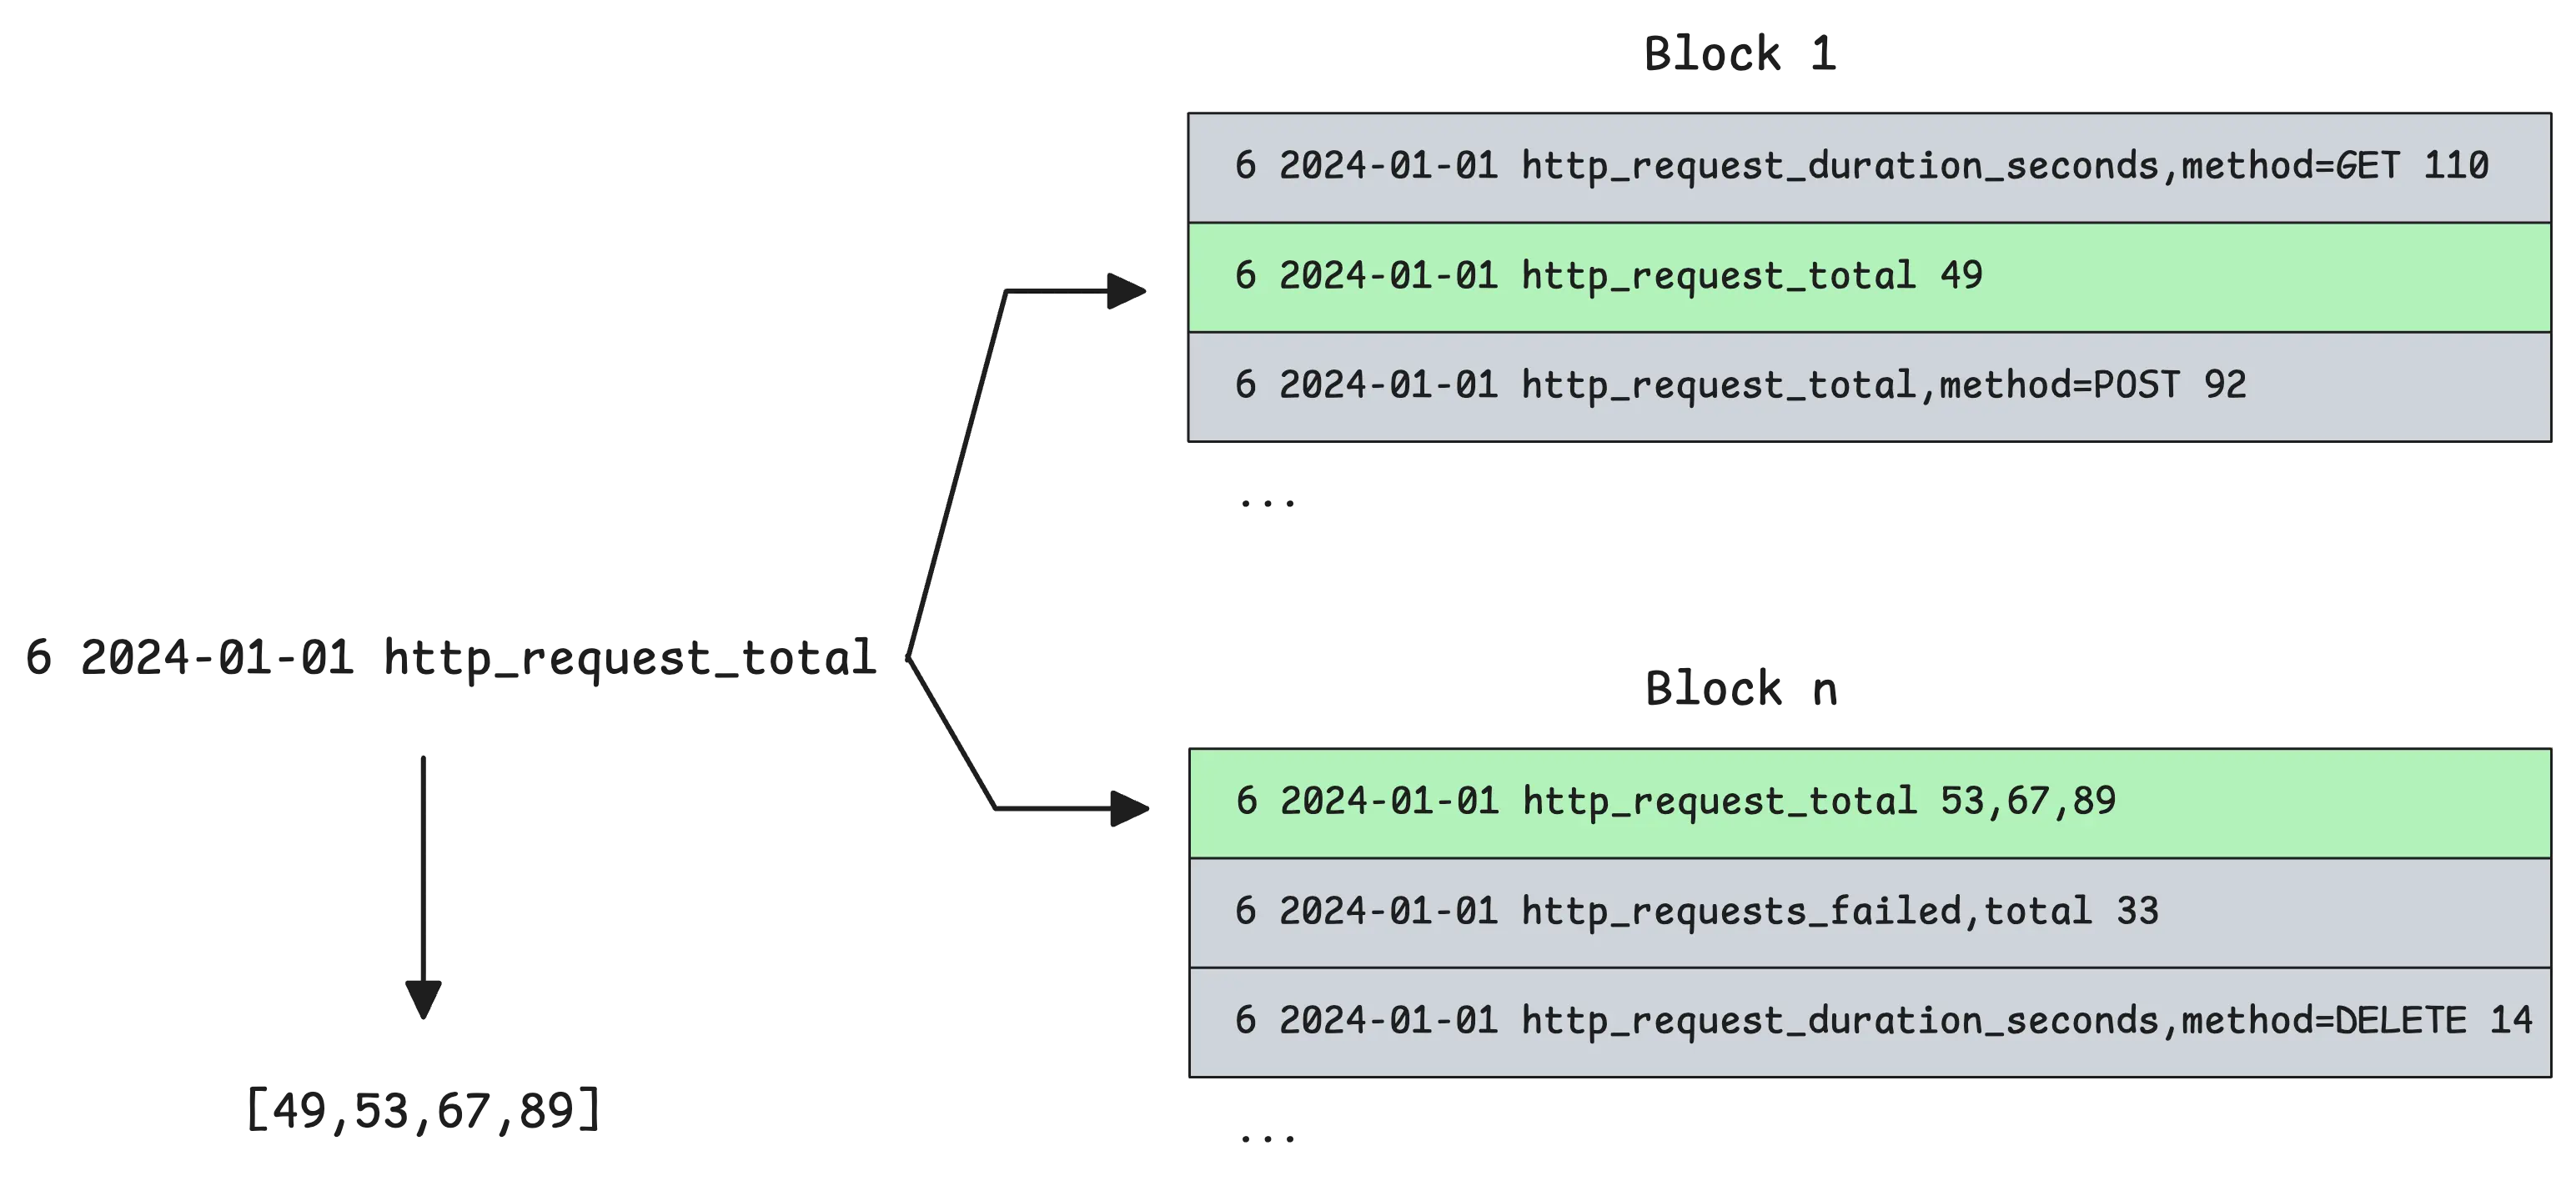
Matching prefix to locate metric IDs

Matching prefix to locate metric IDs

Once all the metric IDs for each tag are found, things get a bit easier. The next step is to intersect those IDs to find which ones match all the tags in the query:
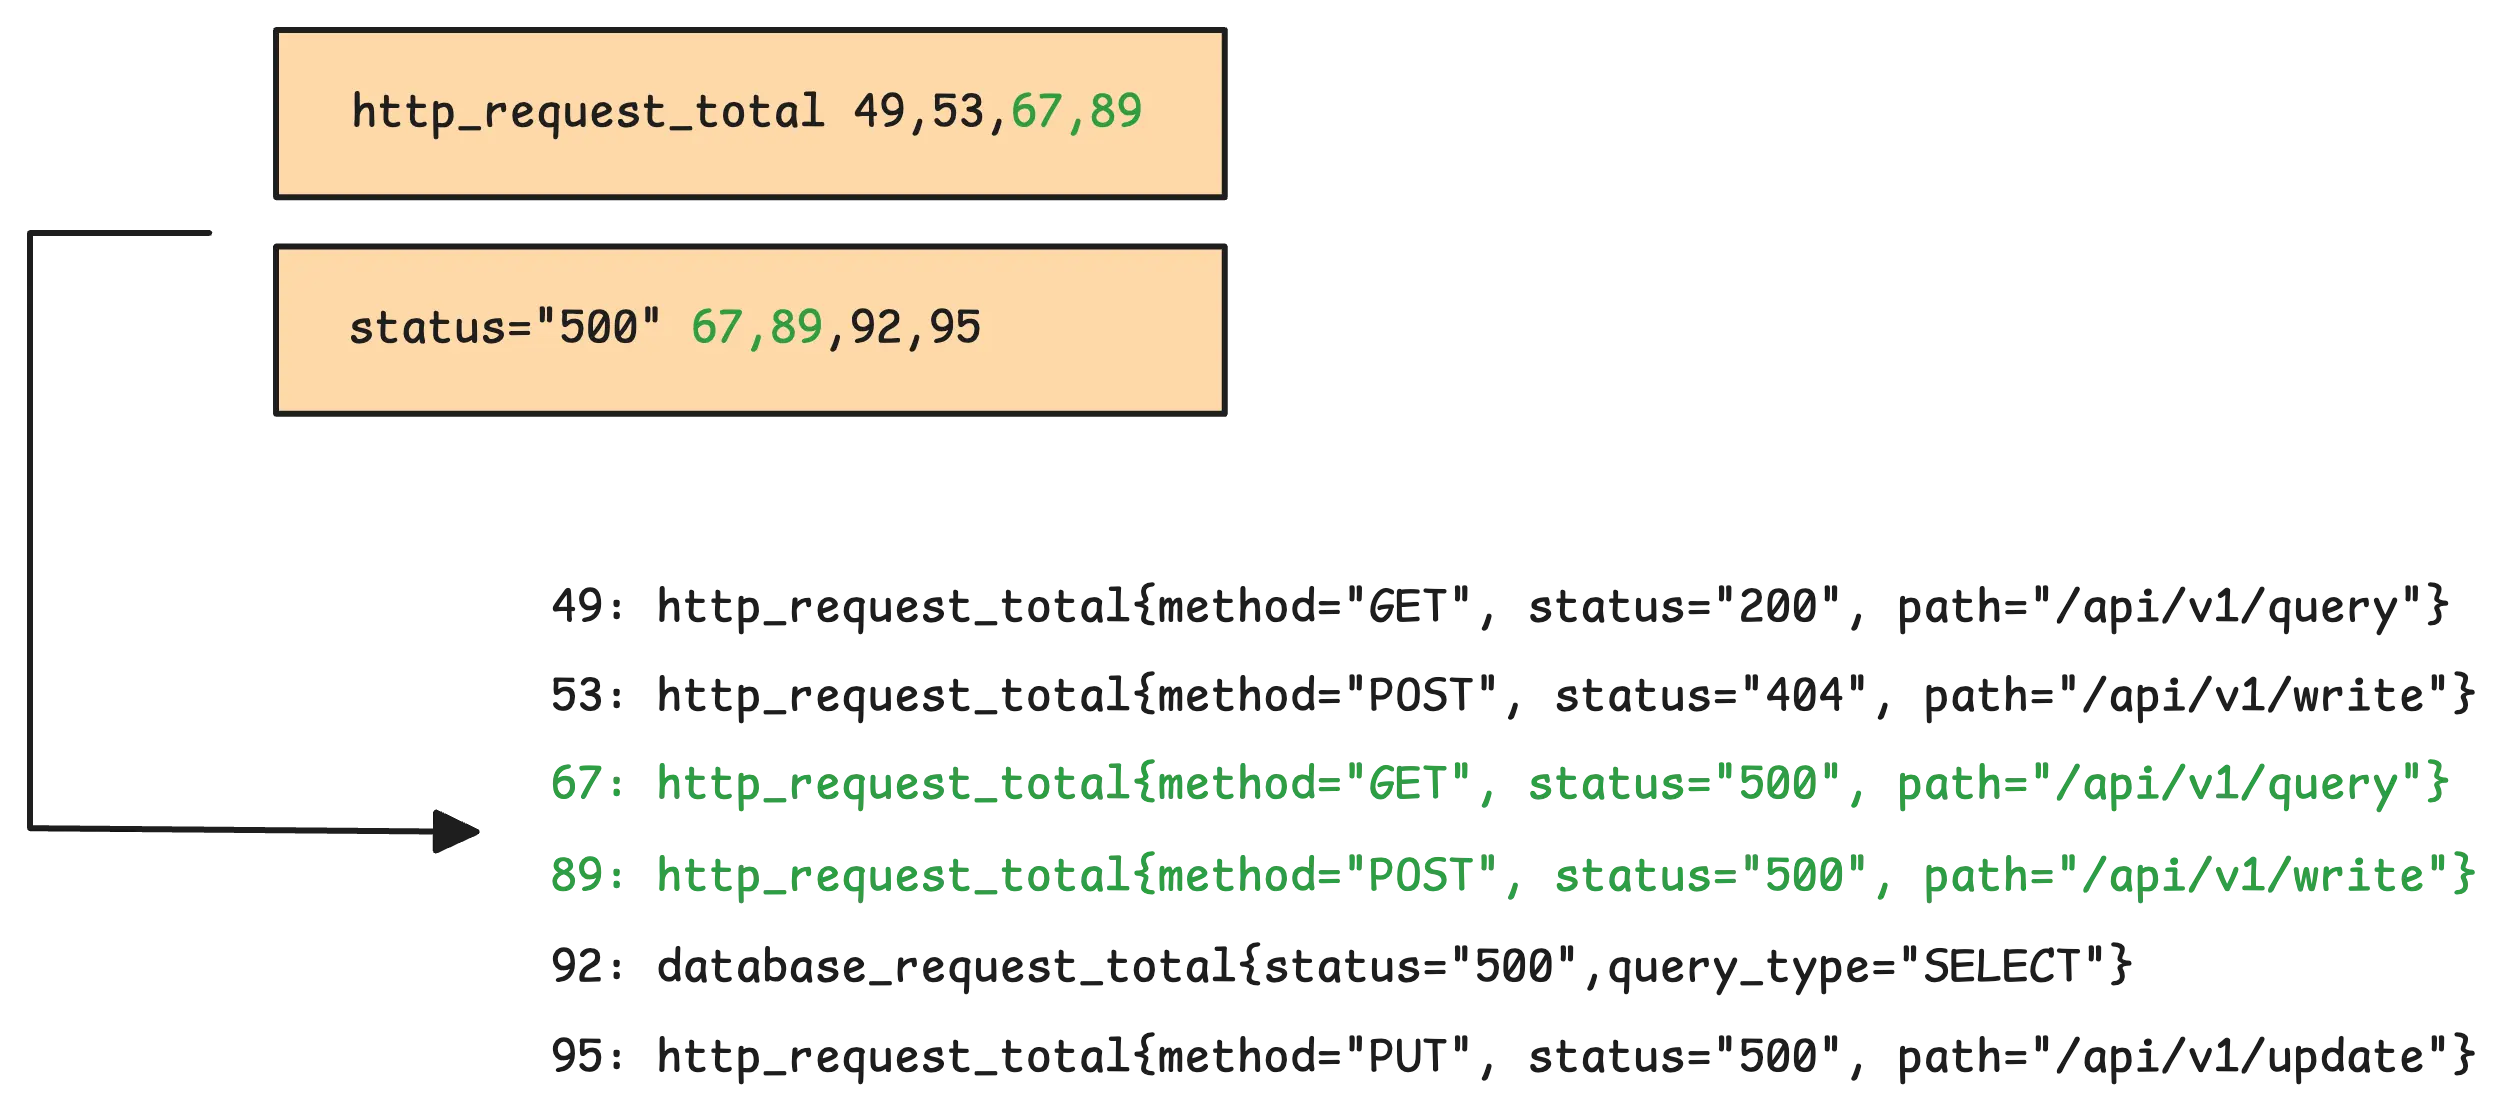
Intersecting metric IDs to match tags

Intersecting metric IDs to match tags

But what happens if the tag is status!=500 instead of status=500?

In that case, instead of intersecting, vmstorage subtracts the set of metric IDs for status=500 from the set of metric IDs for http_request_total.

After identifying the metric IDs that meet all the criteria, IndexDB uses these IDs to look up the corresponding TSIDs in the metric ID to TSID global index. This mapping also has a cache, which takes up 6.25% of vmstorage’s total memory (not configurable) and is persistent on disk (/<-storageDataPath>/cache/metricID_tsid).

Find Values & Timestamps of Timeseries

#

All timeseries data stored in a block shares the same TSID, which is the unique identifier found in the block header. The goal at this stage is to locate all relevant blocks and send them over to vmselect.
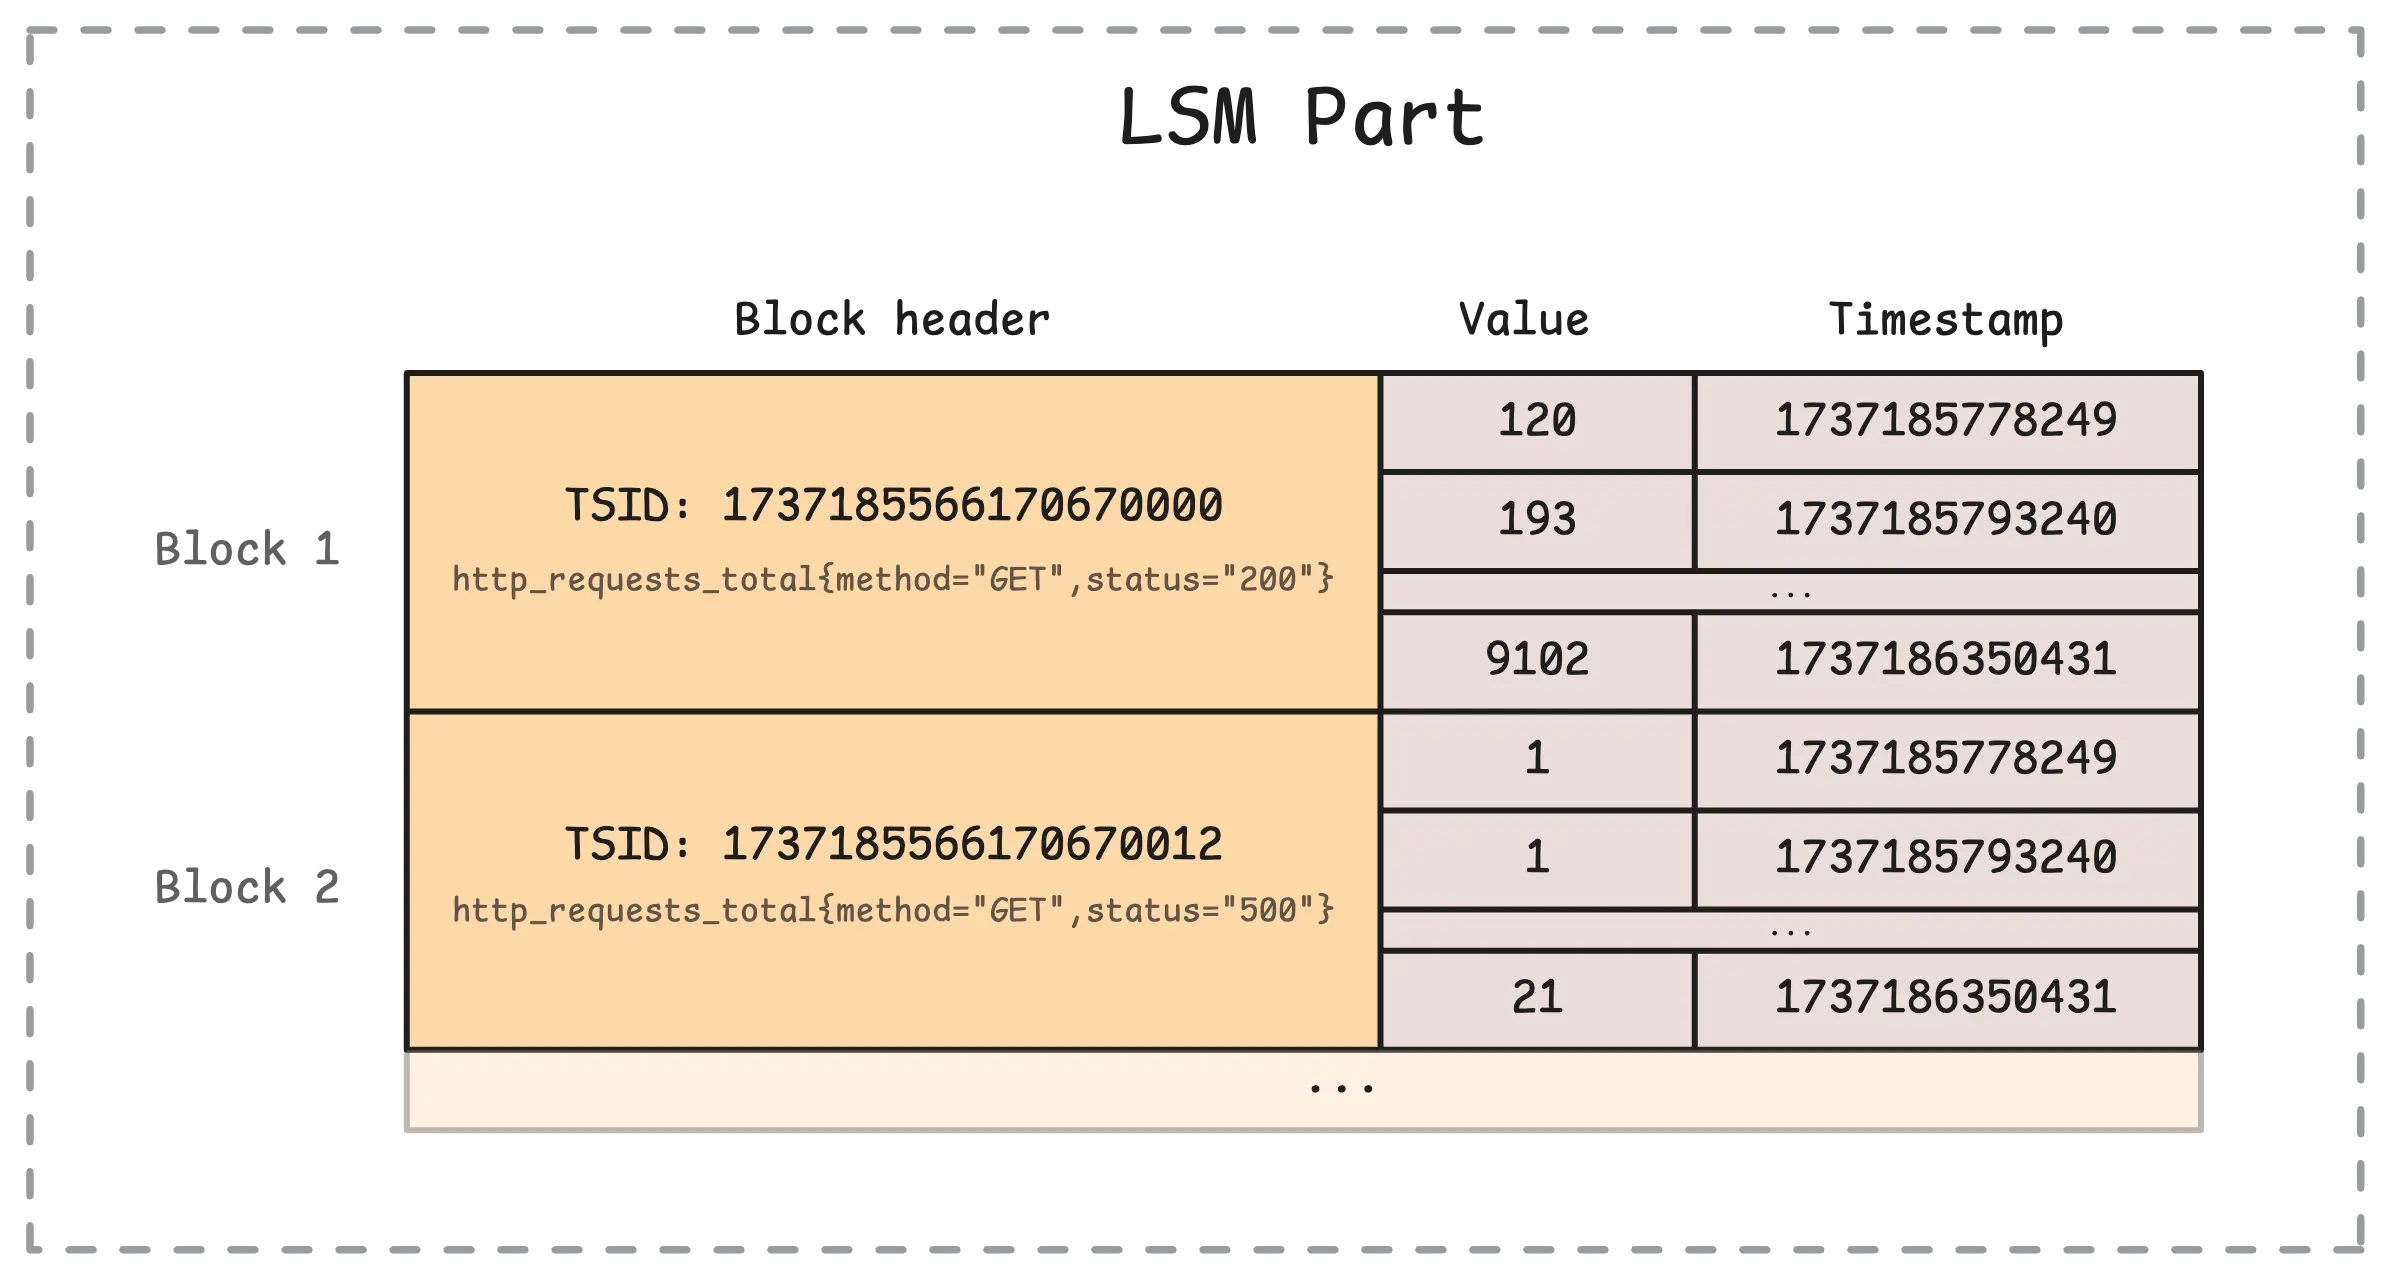
Blocks store timeseries data with unique TSIDs

Blocks store timeseries data with unique TSIDs

The process of locating blocks in the main storage is similar to how it’s done in IndexDB, so we can skip rehashing those steps here.

Once a block with a matching metric ID is found, vmstorage needs to retrieve the corresponding metric name. This is done by querying IndexDB’s metric ID to metric name global index. The process starts by checking a cache to avoid unnecessary lookups. This cache is persistent on disk (/<-storageDataPath>/cache/metricID_metricName) and uses 10% of total memory. If the metric name isn’t in the cache, vmstorage searches the current IndexDB and, if needed, checks previous IndexDBs as well.

Finally, vmstorage sends the blocks, along with the metric names, to vmselect for further processing.

  • How many blocks were found and sent to vmselect: vm_vmselect_metric_blocks_read_total
  • How many rows from those blocks were sent: vm_vmselect_metric_rows_read_total

Now that all the concepts are clear, the summary of this article is quite straightforward:
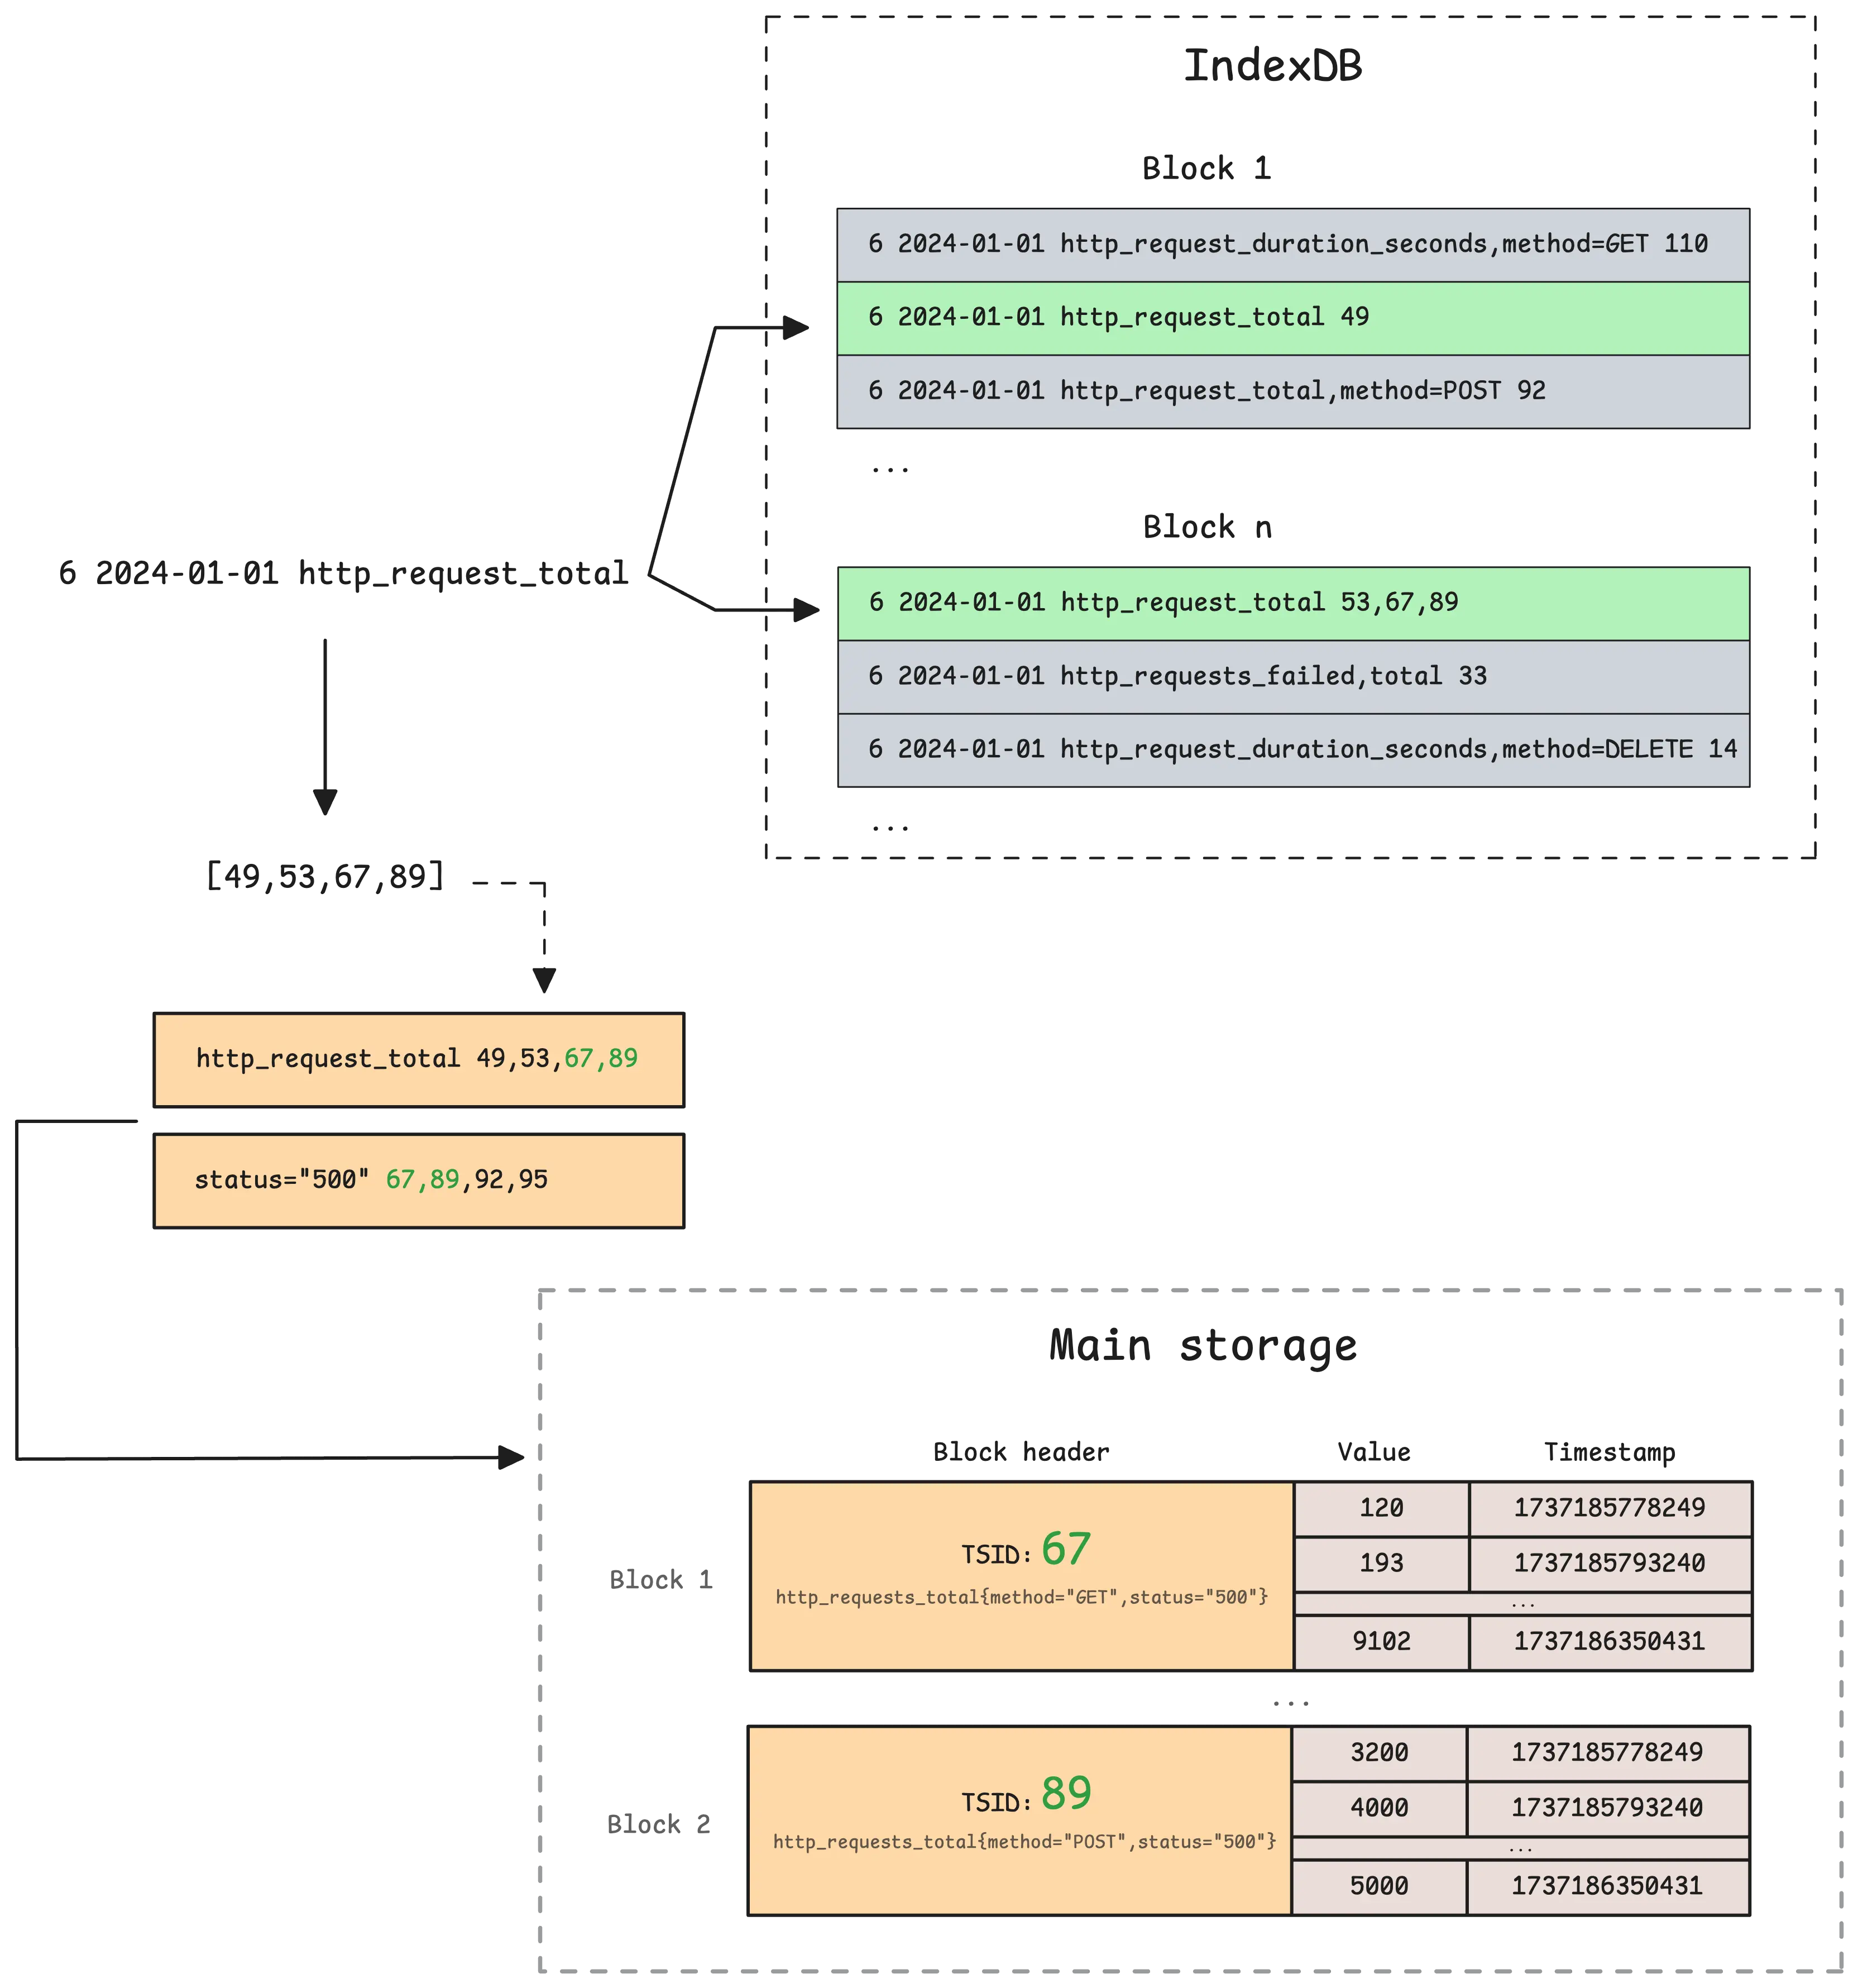
How vmstorage handles query requests from vmselect

How vmstorage handles query requests from vmselect

And… congratulations on making it this far. While waiting for the next article in this series, you can read more on Monitoring with VictoriaMetrics.

Who We Are

#

Need to monitor your services to see how everything performs and to troubleshoot issues? VictoriaMetrics is a fast, open-source, and cost-efficient way to stay on top of your infrastructure’s performance.

If you come across anything outdated or have questions, feel free to send me a DM on X (@func25).