








Welcome to the third chapter of the handbook on Anomaly Detection for Time Series Data!
This series of blog posts aims to provide an in-depth look into the fundamentals of anomaly detection and root cause analysis. It will also address the challenges posed by the time-series characteristics of the data and demystify technical jargon by breaking it down into easily understandable language.
In this blog post (Chapter 3), we continue our exploration into anomaly detection for time series data, venturing into advanced techniques and model applications. We highlight the conceptual frameworks and methodologies (like time series forecasting, statistical proximity and more), their strengths, weaknesses and applicability based on the nature of the available data.
Blog Series Navigation:
Anomaly detection methods can generally be classified into three main categories, each distinguished by the type of training data they use and the specific techniques they employ:
Within each category, we explore several key topics:
In supervised anomaly detection, we work with datasets where instances are pre-labeled as normal (is_anomaly=0) or abnormal (is_anomaly=1), based on well-defined criteria that distinguish these two categories. This approach involves training models on these labeled datasets, enabling them to classify unseen data instances as either “normal” or “anomalous” by comparing them against learned data patterns. Typically, these tasks are addressed as imbalanced binary classification problems, where the output can be:
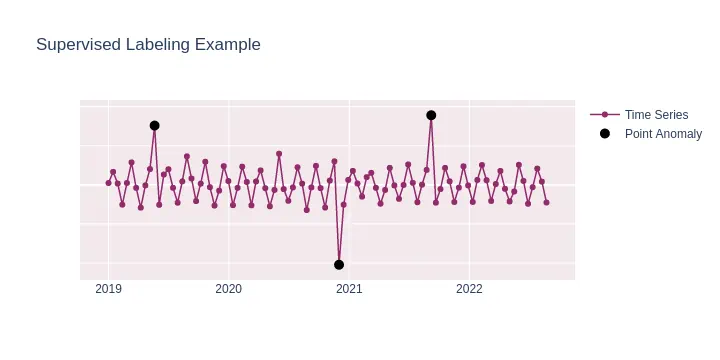
{0, 1}.[0, 1], indicating the model’s confidence or degree of certainty in its prediction.Here is how labeled anomalies (is_anomaly=1, black points) look like on example data.
All other points are automatically considered “normal” (is_anomaly=0)
Guidelines
Employ these techniques and machine learning models when you possess a high-quality labeled dataset and have a clear understanding of what constitutes an anomaly in the business context.
While supervised learning excels in handling anomalies of known types, it may not effectively identify entirely new behaviors that deviate from established patterns.
Be mindful that these datasets often exhibit a significant imbalance in the distribution of normal and anomalous instances.
Note: The effectiveness and accuracy of these models may diminish over time if they are not retrained regularly. For instance, a model trained a year ago, having encountered only a few anomalies, may not perform optimally with current data trends.
Logistic Regression: A simple yet effective model for binary classification tasks. In scikit-learn, this can be implemented using LogisticRegression. This model is particularly useful for datasets with linear decision boundaries.
Random Forest: Offers robust performance by combining multiple decision trees to improve the model’s ability to handle complex datasets with non-linear relationships. Use RandomForestClassifier from scikit-learn for implementation.
Support Vector Machine (SVM): Effective in high-dimensional spaces and is particularly well-suited for cases where there is a clear and pronounced distinction between normal and abnormal. SVM can be implemented using SVC from scikit-learn.
Binary Classification: An anomaly is identified when the model predicts the class label as 1 (anomalous). For example, using Logistic Regression, an instance is classified as an anomaly if model.predict(instance) returns 1.
Probabilistic Output: Here, an anomaly is determined based on a threshold over probability of a first class (anomaly). For instance, using Logistic Regression, an instance is classified as an anomaly if model.predict_proba(instance)[1] > threshold.
In many cases, anomalies are not immediately apparent without deep domain knowledge or extensive analysis. However, certain domains present a more conducive environment for pre-labeling anomalies. These domains typically feature well-defined and observable anomalies that are consistent over time, making them easier to identify and label.
Financial Market Analysis: In financial time series data, anomalies can often be explicitly labeled as sudden spikes or drops in stock prices, unusual trading volumes, or irregular market movements. These labeled instances make it a suitable domain for supervised models to detect similar patterns in future data.
Energy Consumption Monitoring: In energy sectors, time series data of power usage often exhibit clear patterns. Anomalies such as unexpected surges or drops in energy consumption, often caused by equipment malfunctions or external factors, can be pre-labeled for training effective models.
Healthcare Monitoring Systems: In medical time series data, such as heart rate or blood pressure monitoring, anomalies like sudden spikes or irregular patterns can be indicative of medical conditions. These anomalies can be clearly labeled based on past patient data, enabling the training of models to detect similar anomalies in real-time monitoring.
Industrial Equipment Monitoring: In manufacturing and industrial settings, sensor data from equipment often follow predictable time series patterns. Deviations such as excessive vibration, temperature changes, or noise levels can be pre-labeled as anomalies, indicative of equipment malfunctions or maintenance needs.
Web Traffic Analysis: In the context of web analytics, anomalies in time series data such as sudden spikes in website traffic or abrupt drops can be indicative of events like server issues or viral content. These anomalies can be easily labeled and used to train more precise monitoring models.
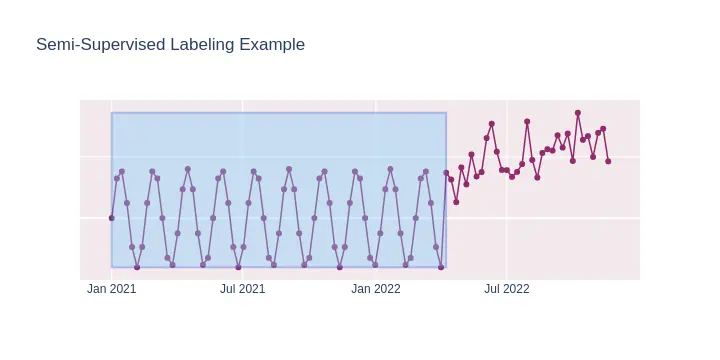
Semi-supervised anomaly detection techniques are predicated on having a training dataset comprising solely of instances labeled as “normal” (is_anomaly=0). In this setup, an unseen data instance is classified as normal if it closely aligns with the learned characteristics of the training data; deviations from these characteristics signal an anomaly.
This approach is often termed as novelty detection.
This illustration highlights the region of “normal” data within the transparent bounding box, where the time series exhibits expected behavior. Labeling such extended, consistent regions is generally more straightforward and less time-consuming than pinpointing numerous individual anomalies for a purely supervised learning approach we discussed earlier.
Guidelines
Opt for these approaches and machine learning models when your dataset is of high quality and almost exclusively contains data points that are not anomalies. This might necessitate the involvement of a subject matter expert to accurately identify and label periods in time series data as “normal”.
However, the effectiveness of semi-supervised anomaly detection hinges on the accuracy of the ’normal’ data labeling and may miss anomalies that subtly blend with the normal patterns.
For algorithms that offer both outlier and novelty detection modes, it is advisable to switch to the novelty mode in their configurations. An example is the Local Outlier Factor (LOF) algorithm in scikit-learn with novelty=True.
Example Algorithms
Local Outlier Factor (LOF): Effective for detecting local deviations in data, particularly useful when set in novelty=True mode for time series data.
One-Class SVM: This algorithm is suitable for capturing the “normal” data distribution in high-dimensional spaces, identifying anomalies as deviations from this learned distribution (the points that are “far away”).
In semi-supervised anomaly detection, collecting data is generally easier compared to supervised methods, as it primarily involves identifying periods or regions in the time series where data is predominantly or entirely normal, thus reducing the need for extensive manual labeling.
Environmental Monitoring: In domains like weather or pollution monitoring, vast amounts of “normal” data can be collected over time, against which anomalies such as sudden climatic changes or pollution spikes can be detected.
Predictive Maintenance: In industrial settings, sensor data from machinery during normal operation can be used to train models, which can then detect deviations indicating potential failures or maintenance needs.
Healthcare Monitoring Systems: Continuous monitoring data, like ECG or blood glucose levels, usually contain long periods of normal patterns, against which anomalies indicating medical conditions can be detected.
Transitioning from model predictions to anomaly scores in semi-supervised learning involves quantifying the deviation of a data point from the established “normal” pattern. The greater the deviation, the higher the anomaly score, indicating a higher likelihood of the instance being an anomaly.
Some models make the life easier by explicitly returning prediction labels (i.e. {-1, 1}) that can be used as anomaly label (-1)
Unsupervised anomaly detection techniques operate under the premise that a labeled training dataset does not exist. This approach is particularly suitable for scenarios where labeling data is impractical or impossible.
The core assumptions of underlying methods commonly are:
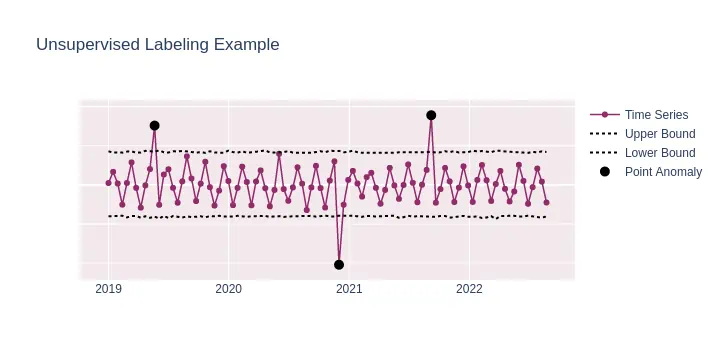
Anomalies are significantly rarer than normal data: This assumption underpins the effectiveness of various algorithms that identify anomalies as significant deviations from the majority of the data. Example algorithms include:
novelty=False modeSuch methods build some sort of confidence interval (or trusted region) around the normal points. Anomalies ( black points) that exceed this interval can be identified as such in an unsupervised approach.
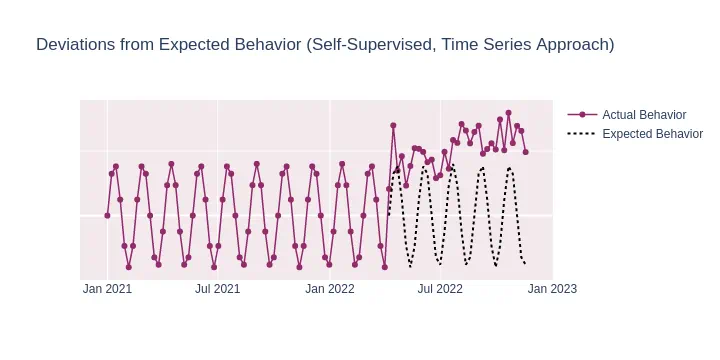
Modeling the underlying process and forecasting future behavior: By analyzing the past, these methods forecast future values of a time series and mark points that deviate significantly from these forecasts as anomalies. This approach can be simultaneously categorized as:
y == X) is used for learning and deriving forecasts.The graph illustrates the forecasted future (expected behavior) alongside the deviations (actual behavior). The magnitude of these deviations correlates with the severity of the anomaly score; larger deviations imply higher anomaly scores.
Guidelines
Opt for these techniques and models when a clean and/or labeled dataset is not available. This approach excels in environments where labeling is impractical, but it may struggle with nuanced anomalies closely resembling normal data.
Depending on your data’s complexity, such as the presence of trends or seasonalities, you might choose between 1. distribution-based algorithms (like Isolation Forest) and 2. time-series forecasting techniques. Here, anomaly scores are treated as deviations from the forecasted values, considering them as the “expected” normal behavior.
Example Algorithms for Time Series
Unsupervised anomaly detection is highly effective in domains where defining or labeling normal behavior in time series data is complex or elusive. Some of these domains include:
Energy Grid Monitoring: Fluctuations in energy consumption and production in power grids can be difficult to label as normal or abnormal due to their dependence on numerous variables. Unsupervised models can identify unusual patterns that may indicate issues or inefficiencies in the grid.
Seismic Activity Monitoring: Earthquake and volcanic activity data are prime examples of time series data where defining a “normal” pattern is challenging. Unsupervised techniques can detect anomalies indicating potential seismic events.
Traffic Flow Analysis: Urban traffic and public transportation systems exhibit complex time series patterns due to varying factors like time of day, weather, and events. Unsupervised models can identify irregular traffic patterns or disruptions.
Supply Chain and Inventory Management: In logistics, the flow of goods and inventory levels form complex time series that are hard to label manually. Unsupervised models can detect unusual patterns that might indicate supply chain disruptions or demand spikes.
Astronomical Data Analysis: Observational data in astronomy, such as light curves of stars, are complex time series where anomalies (like exoplanet transits or stellar flares) are difficult to label. Unsupervised techniques are key in identifying these rare events.
Note: These domains are characterized by the complexity and variability of their time series data, making unsupervised anomaly detection a vital tool for identifying significant deviations from intricate and often unpredictable patterns.
As we navigate the intricate world of anomaly detection, it becomes evident that there is no universal solution, particularly in the fields of monitoring and observability:
Such an approach enables us to develop solutions that are not only effective but also efficient, finely attuned to both the nuances of our data and the specifics of our operational requirements.
Would you like to test how VictoriaMetrics Anomaly Detection can enhance your monitoring? Request a trial here or contact us if you have any questions.
此内容由惯性聚合(RSS阅读器)自动聚合整理,仅供阅读参考。 原文来自 — 版权归原作者所有。