










With this blog post, we continue our quarterly “What’s New” series to inform a broader audience about the latest features and improvements made to VictoriaMetrics Anomaly Detection (or simply vmanomaly). This post covers Q3'24 progress along with early Q4 to accommodate a slight shift in the publishing schedule — why not take advantage of it?
Stay tuned for upcoming content on anomaly detection.
Series posts:
In Q3, we rolled out versions v1.13.3 to v1.18.0. Just to note, versions v1.16.0 through v1.18.0 were actually released in October ‘24, which technically falls in Q4. To name a few, these versions introduced:
infer stages, eliminating the need for explicit retraining.search.maxPointsPerTimeseries or search.maxQueryDuration from being reached.multitenant queries across VictoriaMetrics cluster.groupby parameter for multivariate models, allowing more context-specific anomaly detection.Please proceed to Table of Contents for a navigation over these changes description.
We also enhanced our documentation, including updates to the FAQ page with new sections like handling timezones, resource consumption, handling large queries and using online models for resource optimization. We also added new details to the QuickStart guide, especially the command line arguments section.
Additionally, we redesigned the self-monitoring page to make it clearer and easier to navigate. It now includes sections on both metrics generated by vmanomaly and logs generated, grouped by different stages.
Let’s explore what these changes mean for our users.
Introduced in v1.15.0, online models allow for incremental updates, enabling continuous adaptation without the need for frequent retraining. Unlike traditional offline models that rely on periodic, heavy retraining (fit), online models make incremental adjustments during each infer stage, even for a single datapoint.
fit stage, flattening peak resource demands and reducing the burden on VictoriaMetrics. This results in more efficient use of memory and computational resources.To learn more about how online models work and their advantages compared to offline models, please refer to the online model documentation here and in the FAQ section.
Return to ToC
Performance: We’ve optimized the reading, data processing, and model fitting stages, providing near-linear speedups on multicore instances. This improvement means faster operations with more CPU cores at the cost of a slight increase in RAM usage.
On-Disk Data Mode: Introduced an on-disk data dump mode, reducing RAM usage for resource-intensive setups. This is particularly useful for configurations involving multiple queries with large results or longer fit_window arguments in the scheduler. The feature stores data on the host filesystem, allowing more efficient memory usage during fit operations. Refer to this section for detailed configurations and examples.
Per-Query Configuration: Starting from v1.13.0, VmReader supports flexible per-query configurations, allowing users to customize parameters such as data granularity (step), valid data range (data_range), local timezone (tz), and data splitting strategy for longer queries (max_points_per_query).
The old configuration format:
# other config sections ...
reader:
  class: 'vm'
  datasource_url: 'http://localhost:8428'  # source victoriametrics/prometheus
  sampling_period: "10s"  # set it <= min(infer_every) in schedulers section
  queries:
    # old format {query_alias: query_expr}, prior to 1.13, will be converted to a new format automatically
    vmb: 'avg(vm_blocks)'
is automatically converted to the new format imputing backward-compatible defaults, with a warning in the logs:
Deprecated format for queries is used {query_alias: expression}. (<=1.13.0). Converting to new format with backward-compatible defaults for missing fields.
# other config sections ...
reader:
  class: 'vm'
  datasource_url: 'http://localhost:8428'  # source victoriametrics/prometheus
  sampling_period: '10s'
  queries:
    # old format {query_alias: query_expr}, prior to 1.13, will be converted to a new format automatically
    vmb:
      expr: 'avg(vm_blocks)'  # initial MetricsQL expression
      step: '10s'  # individual step for this query, will be filled with `sampling_period` from the root level
      data_range: ['-inf', 'inf']  # by default, no constraints applied on data range
      tz: 'UTC'  # by default, tz-free data is used throughout the model lifecycle
      # new query-level arguments will be added in backward-compatible way in future releases
For more information, refer to the per-query parameters documentation.
Handling Large Queries: To better manage large queries, we added the max_points_per_query parameter, which is configurable globally or on a per-query basis (details here). This feature allows vmanomaly to split long fit_window queries into smaller chunks, bypassing constraints like search.maxQueryDuration by distributing the workload across smaller subqueries that are subsequently aggregated into a single result within vmanomaly. This helps prevent query timeouts while ensuring smoother data processing. Examples can be found in the handling large queries FAQ section.
Timezone Awareness: To improve seasonality modeling, especially during DST transitions, we have added timezone-awareness to VmReader. The new tz argument allows precise timezone management, available at both global and per-query levels (see per-query parameters). For more information (like what models can benefit from such change and example configs), see the Handling Timezones section below.
Multitenant Queries Support: We’ve added support for multitenant value in the tenant_id argument, enabling queries across multiple tenants in a VictoriaMetrics cluster. This feature, available from v1.104.0, is applicable both when reading input data from vmselect via the VmReader and when writing results through vminsert via the VmWriter. For more details, refer to the tenant_id argument description in the component documentation.
Return to ToC
Starting from v1.16.0, multivariate models gained the ability to logically group input data using the new groupby argument.
Previously, multivariate models were either applied to high-level aggregated queries (e.g., by ()), creating a single, global anomaly detection profile, or used without distinguishing between different logical entities (e.g., country, instance). This approach had significant limitations:
groupby ArgumentThe new groupby argument (list[string]) allows users to group data logically within multivariate models. When specified, a separate model is trained for each unique combination of label values in the specified groupby columns. This provides more precise and context-specific anomaly detection while improving both processing efficiency and detection accuracy.
Consider a scenario where you want to perform multivariate anomaly detection at the machine level, avoiding interference across different hosts. You can use groupby: [host] to ensure that each host has its own dedicated anomaly detection model, thereby improving detection quality for each individual entity. Below is an example configuration:
# other config sections ...
reader:
  # other reader params ...
  # assume there are M unique hosts identified by the `host` label
  queries:
    # returns one time series for each CPU mode per host, total = N*M time series
    cpu: sum(rate(node_cpu_seconds_total[5m])) by (host, mode)
    # returns one time series per host, total = M time series
    ram: |
      (
       (node_memory_MemTotal_bytes - node_memory_MemAvailable_bytes)
       / node_memory_MemTotal_bytes
      ) * 100 by (host)
    # returns one time series per host for both network receive and transmit data, total = M time series
    network: |
      sum(rate(node_network_receive_bytes_total[5m])) by (host)
      + sum(rate(node_network_transmit_bytes_total[5m])) by (host)

models:
  iforest: # alias for the model
    class: isolation_forest_multivariate
    contamination: 0.01
    # the multivariate model can be trained on 2+ time series returned by 1+ queries
    queries: [cpu, ram, network]
    # train a distinct model for each unique value found in the `host` label
    # a total of M models will be trained, one for each host
    groupby: [host]
Return to ToC
Starting from v1.18.0, vmanomaly offers support for timezone-aware anomaly detection via the tz argument. This feature is crucial for models that depend on seasonality, such as ProphetModel and OnlineQuantileModel.
Seasonality patterns can be disrupted by timezone shifts, particularly during events like Daylight Saving Time (DST). Without proper handling, these changes can lead to inaccurate anomaly predictions due to misaligned seasonal cycles. The tz argument ensures that models continue to operate accurately by maintaining consistent periodic patterns, even when time shifts occur.
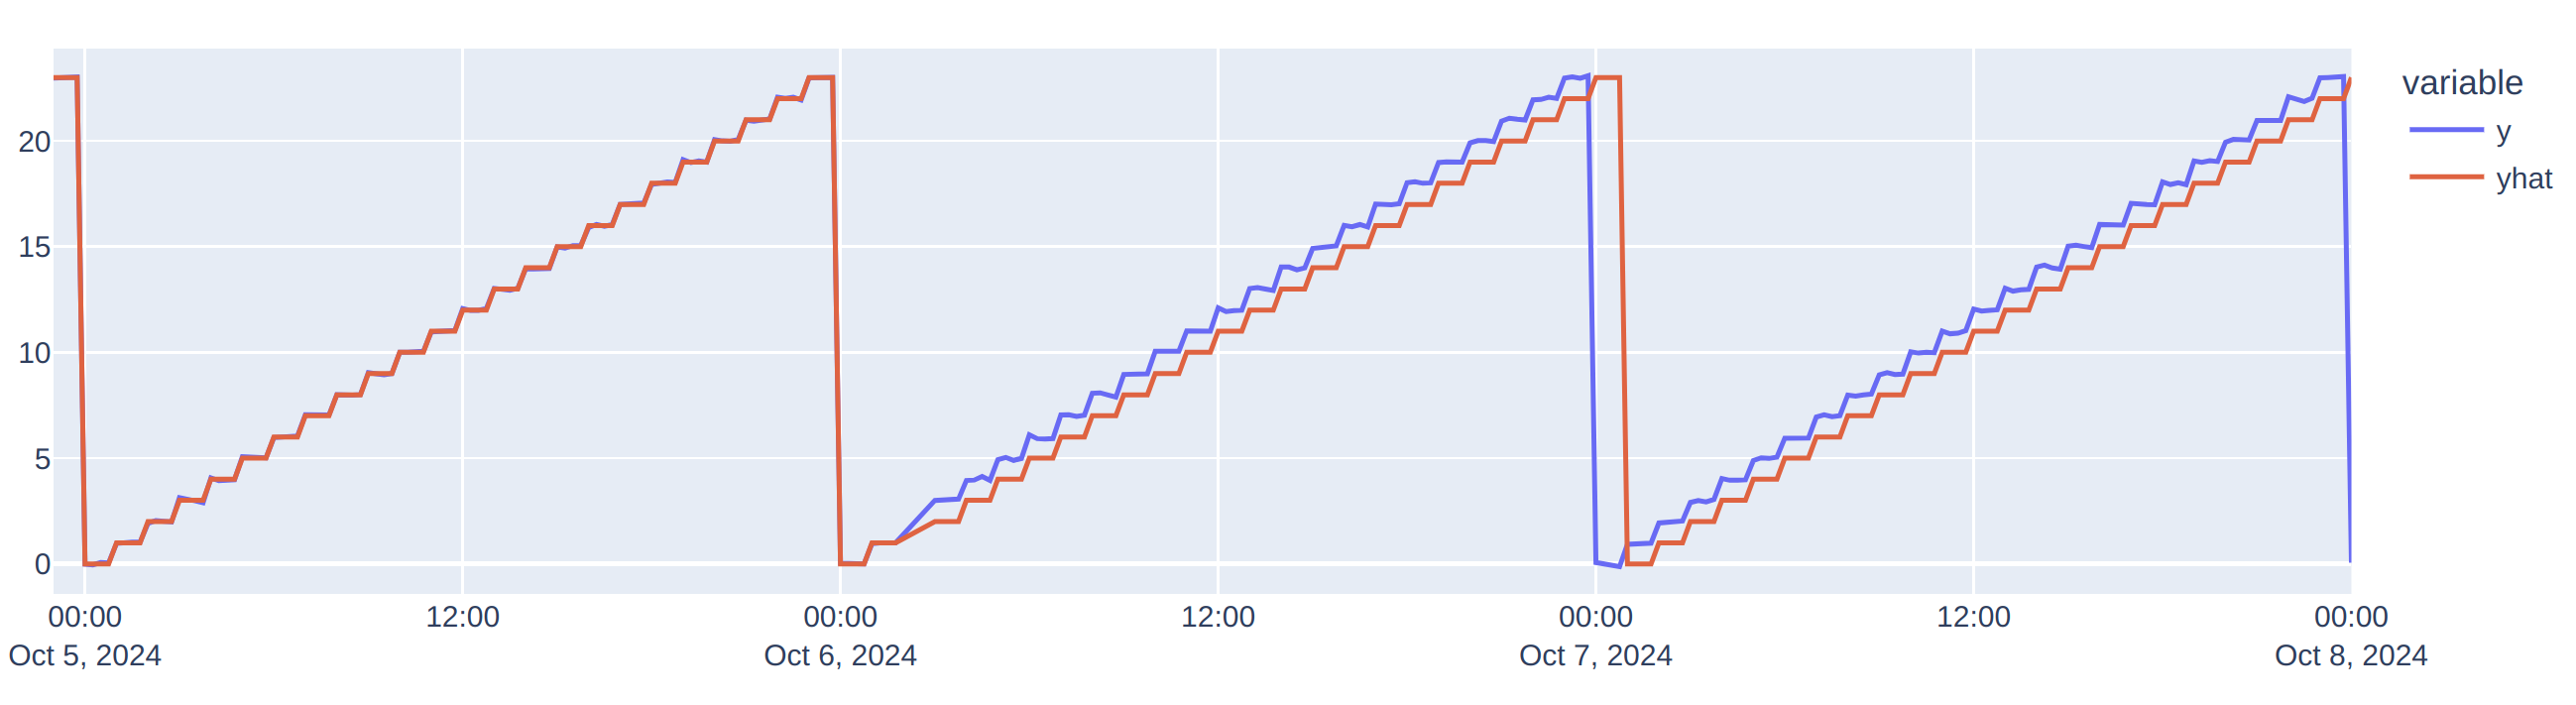
Consider a simple example of seasonality that resets each day at midnight local time (e.g., a resource usage counter reset). During a DST change — such as a shift from 1:59 AM to 3:00 AM in Australia/Sydney — a tz-naive model would still treat the consecutive datapoints as if no time adjustment occurred. This leads to an incorrect application of the learned seasonal pattern for the “2 AM” data point, resulting in a shifted prediction (yhat line) that persists until the next DST reversal.
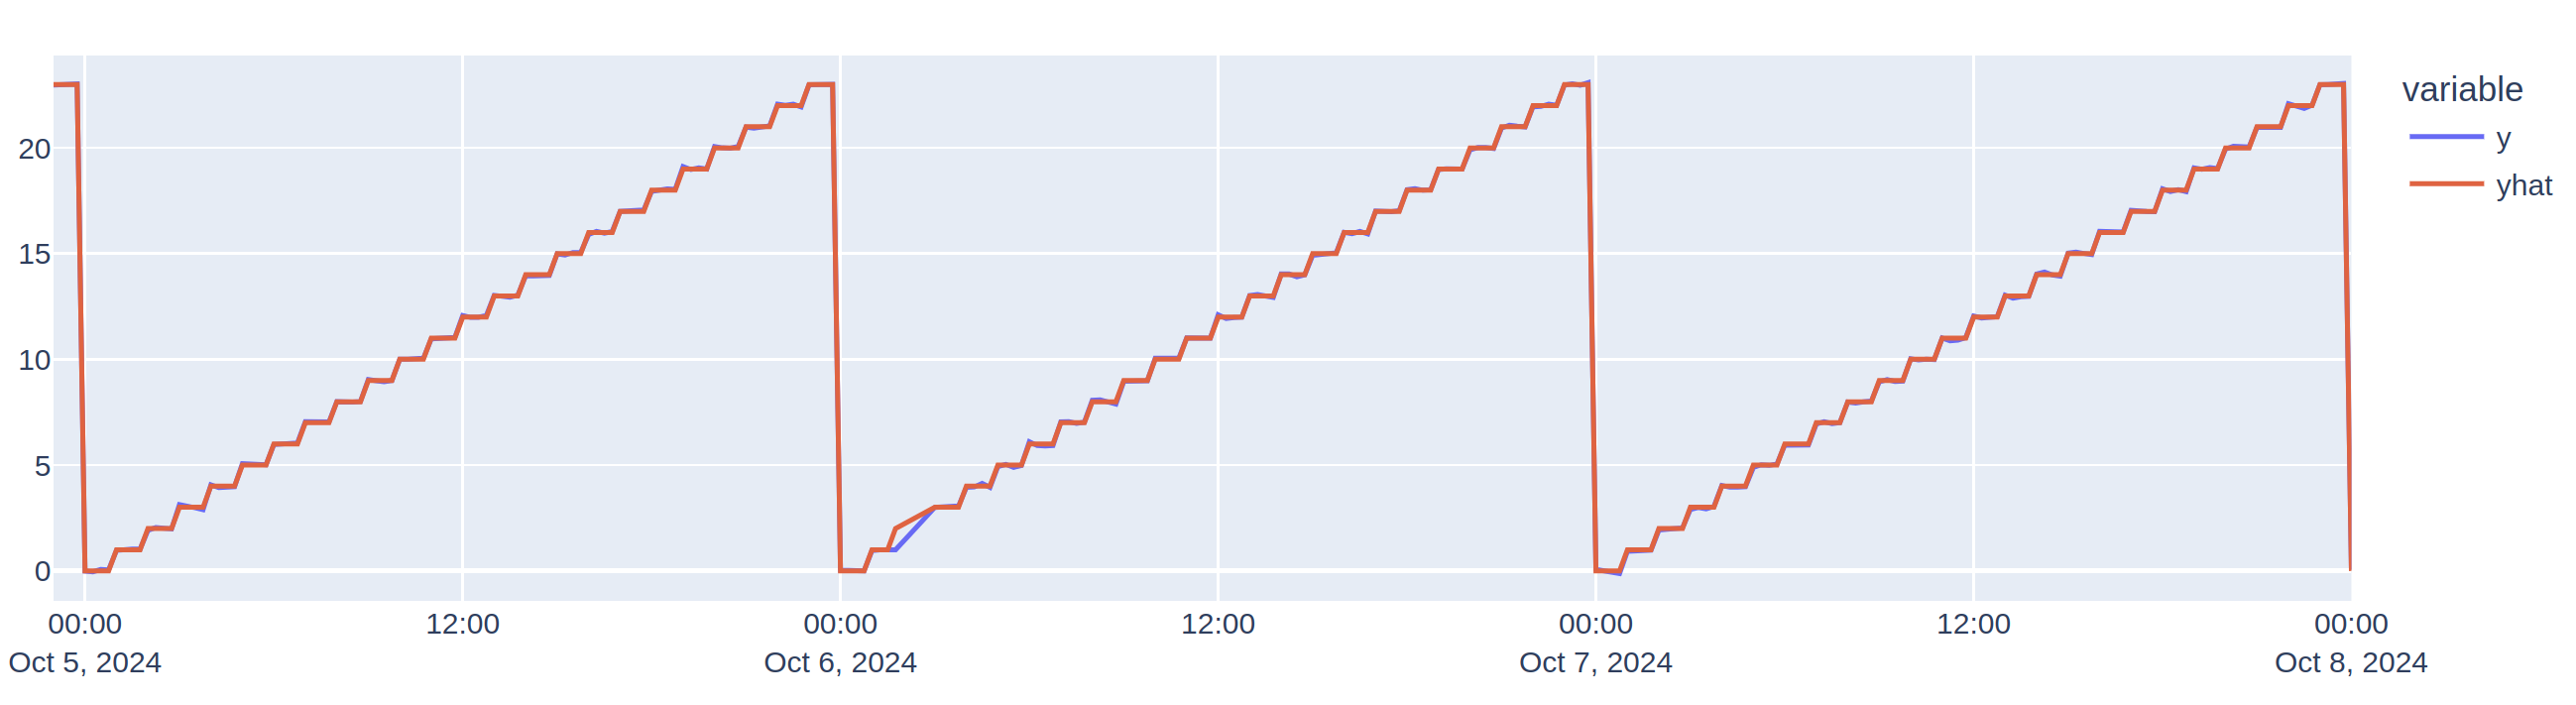
In contrast, a tz-aware model recognizes the DST change and correctly adjusts its seasonal pattern, aligning predictions with local time, resulting in accurate outputs and no further shifts in yhat predictions.
tz globally in the reader section to apply timezone settings to all queries.tz at the query level to override the global setting for specific queries.This flexibility allows users to control how timezones are applied, ensuring seasonal cycles align correctly with local time, improving model reliability during transitions like DST.
Example Configuration:
reader:
  datasource_url: 'your_victoriametrics_url'
  tz: 'America/New_York'  # global setting for all queries
  queries:
    your_query:
      expr: 'avg(your_metric)'
      tz: 'Europe/London'  # per-query override
models:
  seasonal_model:
    class: 'prophet'
    queries: ['your_query']
    # other model params ...
Return to ToC
Starting from v1.16.3, vmanomaly supports mutual TLS (mTLS) to ensure secure communication across its components — such as VmReader, VmWriter, and Monitoring/Push.
mTLS enables both client and server to authenticate each other using certificates, enhancing security by ensuring that only authorized entities can communicate with mTLS-enabled VictoriaMetrics.
To configure mTLS in vmanomaly, you can use the following parameters:
verify_tls: Specifies the CA bundle for TLS verification, or set it to True to use the system’s default certificate store.tls_cert_file: Path to the client certificate for authentication.tls_key_file: Path to the client certificate key.Below is an example showing how to enable mTLS with custom certificates:
reader:
  class: "vm"
  datasource_url: "https://your-victoriametrics-instance-with-mtls"
  queries:
    vm_blocks_example:
      expr: 'avg(rate(vm_blocks[5m]))'
      step: 30s
  sampling_period: 30s
  verify_tls: "path/to/ca.crt"  # path to CA bundle for TLS verification
  tls_cert_file: "path/to/client.crt"  # path to the client certificate
  tls_key_file:  "path/to/client.key"  # path to the client certificate key
    # additional reader parameters ...

# other config sections, like models, schedulers, writer, ...
Return to ToC
Would you like to test how VictoriaMetrics Anomaly Detection can enhance your monitoring? Request a trial here or contact us if you have any questions.
此内容由惯性聚合(RSS阅读器)自动聚合整理,仅供阅读参考。 原文来自 — 版权归原作者所有。