


惯性聚合 高效追踪和阅读你感兴趣的博客、新闻、科技资讯
阅读原文 在惯性聚合中打开

推荐订阅源

The Cloudflare Blog
U
Unit 42
OSCHINA 社区最新新闻
OSCHINA 社区最新新闻
腾讯CDC
罗磊的独立博客
博客园 - 聂微东
博客园_首页
雷峰网
雷峰网
云风的 BLOG
云风的 BLOG
Jina AI
Jina AI
奇客Solidot–传递最新科技情报
奇客Solidot–传递最新科技情报
D
DataBreaches.Net
The GitHub Blog
The GitHub Blog
人人都是产品经理
人人都是产品经理
Y
Y Combinator Blog
量子位
Microsoft Azure Blog
阮一峰的网络日志
阮一峰的网络日志
小众软件
小众软件
月光博客
月光博客
T
The Exploit Database - CXSecurity.com
Google DeepMind News
H
Help Net Security
O
OpenAI News
Blog — PlanetScale
Blog — PlanetScale
S
Security Affairs
S
Security @ Cisco Blogs
Microsoft Security Blog
T
The Blog of Author Tim Ferriss
AI
AI
MongoDB | Blog
MongoDB | Blog
G
Google Developers Blog
MyScale Blog
MyScale Blog
Cyber Security Advisories - MS-ISAC
D
Docker
Hugging Face - Blog
Hugging Face - Blog
D
Darknet – Hacking Tools, Hacker News & Cyber Security
S
Schneier on Security
Cloudbric
Cloudbric
H
Heimdal Security Blog
J
Java Code Geeks
N
News and Events Feed by Topic
Hacker News - Newest:
Hacker News - Newest: "LLM"
宝玉的分享
宝玉的分享
有赞技术团队
有赞技术团队
S
SegmentFault 最新的问题
让小产品的独立变现更简单 - ezindie.com
爱范儿
爱范儿
I
Intezer
GbyAI
GbyAI

VictoriaMetrics: Simple & Reliable Monitoring for Everyone on VictoriaMetrics

Operator now has Long-Term Support (LTS) version Multi-tiered Observability: A Practical Way to Handle Diverse Workloads VictoriaMetrics April 2026 Ecosystem Updates Not All Telemetry Requires Premium Pricing VictoriaMetrics at KubeCon Amsterdam: Community Highlights What's new in VictoriaMetrics Anomaly Detection (Q1 2026) What's New in VictoriaMetrics Cloud Q1 2026? Logs, MCP Server, Better Alerting, and... a Secret Project VictoriaMetrics at KubeCon: Optimizing Tail Sampling in OpenTelemetry with Retroactive Sampling VictoriaMetrics March 2026 Ecosystem Updates Observability Lessons From OpenAI Benchmarking Kubernetes Log Collectors: vlagent, Vector, Fluent Bit, OpenTelemetry Collector, and more VictoriaMetrics February 2026 Ecosystem Updates VictoriaMetrics at FOSDEM, Cloud Native Days France, and CfgMgmtCamp Ghent VictoriaLogs in VictoriaMetrics Cloud: Fast, Cost-Effective Log Management is Here What’s new in VictoriaMetrics Anomaly Detection (2025) VictoriaMetrics January 2026 Ecosystem Updates VictoriaLogs Basics: What You Need to Know, with Examples & Visuals What's New in VictoriaMetrics Cloud Q4 2025? New tiers, more deployment options, IaC and alerting rules. Vibe coding tools observability with VictoriaMetrics Stack and OpenTelemetry How a US Software Provider Improved Traffic Alerting with VictoriaMetrics Anomaly Detection VictoriaMetrics 2025 Developer Experience: A Year in Review Spotify’s performance & control across large monitoring environments with VictoriaMetrics VictoriaMetrics Achieves Red Hat OpenShift Operator Certification Our latest updates across the VictoriaMetrics Observability ecosystem New Capacity Tiers in VictoriaMetrics Cloud Announcing 1B+ Downloads & Product Development With Logs, Traces, Metrics AI Agents Observability with OpenTelemetry and the VictoriaMetrics Stack Discarding gRPC-Go: The Story Behind OTLP/gRPC Support in VictoriaTraces What's New in VictoriaMetrics Cloud Q3 2025? From new region in Asia to proactive alerts How DreamHost Slashed Memory Usage by 80% and Scaled to 76 Million Time Series Upcoming Conferences & Meetups: Where to Meet Our Team VictoriaMetrics Long-Term Support (LTS): H2 2025 Update Creating a Sustainable Open Source Business Model - Introduction Full-Stack Observability with VictoriaMetrics in the OTel Demo Alerting Best Practices vmanomaly Deep Dive: Smarter Alerting with AI (Tech Talk Companion) VictoriaLogs Practical Ingestion Guide for Message, Time and Streams Monotonic and Wall Clock Time in the Go time package Hello Singapore! VictoriaMetrics Cloud Expands to Asia Pacific MCP Server Integration & Much More: What's New in VictoriaMetrics Cloud Q2 2025 FIPS 140-3 Compatible Builds for VictoriaMetrics Enterprise Components VictoriaLogs Unleashed: Cluster Version Now Available for Exceptional, Linear Scaling Integrations made easy with VictoriaMetrics Cloud Developer's Note: Research on Distributed Tracing, Comparing With Tempo and ClickHouse vmagent: Key Features Explained in Under 15 Minutes Go synctest: Solving Flaky Tests vmalert: Maximize Your Monitoring (Tech Talk Companion) Celebrating 14K Stars on GitHub: Spring Update vmalert: Maximize Your Monitoring VictoriaMetrics Connects with the Open Source Community at LinuxFest Northwest 2025 Graceful Shutdown in Go: Practical Patterns VictoriaLogs: Gaps, Gains & Growth Prometheus Monitoring: Functions, Subqueries, Operators, and Modifiers Don’t default to microservices: You’ll thank us later! Container CPU Requests & Limits Explained with GOMAXPROCS Tuning gRPC in Go: Streaming RPCs, Interceptors, and Metadata From Chaos to Clarity with VictoriaLogs Prometheus Alerting 101: Rules, Recording Rules, and Alertmanager Heading to London: Meet Our Team at KubeCon Europe 2025 Inside vmselect: The Query Processing Engine of VictoriaMetrics Meet Our Team at Scale 22x Practical Protobuf - From Basic to Best Practices VictoriaLogs Status Update: Heading Towards the Cluster Version 24th of February 2025 Statement: VictoriaMetrics Stands with Ukraine! Prometheus Metrics Explained: Counters, Gauges, Histograms & Summaries Prometheus Monitoring: Instant Queries and Range Queries Explained 300%+ Growth in 2024: Join Our Team in 2025! FOSDEM 2025 recap How Protobuf Works—The Art of Data Encoding OpenTelemetry, Prometheus, and More: Which Is Better for Metrics Collection and Propagation? How vmstorage Handles Query Requests From vmselect How vmstorage's IndexDB Works VictoriaMetrics Tech Talk Stream: A Deep Dive into Blackbox Monitoring How HTTP/2 Works and How to Enable It in Go VictoriaMetrics Cloud: What's New in Q4 2024? How vmstorage Processes Data: Retention, Merging, Deduplication,... How vmstorage Handles Data Ingestion From vminsert When Metrics Meet vminsert: A Data-Delivery Story From net/rpc to gRPC in Go Applications VictoriaMetrics helps IHI Terrasun Win Big in Vegas on $1.2B Clean Energy Project Piros | VictoriaMetrics Partner Allenta | VictoriaMetrics Partner CloudRaft | VictoriaMetrics Partner Sensedia & VictoriaMetrics: API-compatible Efficient Storage Scalable Prometheus: Why DSV Chose VictoriaMetrics Sensor Factory | VictoriaMetrics Partner Erythix | VictoriaMetrics Partner Groove X & VictoriaMetrics: Faster Device Health Monitoring Scaled & Performant Monitoring at Spotify with VictoriaMetrics Grammarly & VictoriaMetrics: 10× Lower Costs & Direct Access Zelarsoft | VictoriaMetrics Partner DFKI & VictoriaMetrics: Efficient Long-Term Metric Storage Niubits | VictoriaMetrics Partner Megazone Cloud | VictoriaMetrics Partner Cogito Software | VictoriaMetrics Partner Bajau | VictoriaMetrics Partner Find Out Why Dig Security Chose VictoriaMetrics! Ness | VictoriaMetrics Partner Alpha Data | VictoriaMetrics Partner SIOS Technology | VictoriaMetrics Partner
VictoriaMetrics Cloud: What's New in Q1 2025?
Jose Gomez-Selles · 2025-04-25 · via VictoriaMetrics: Simple & Reliable Monitoring for Everyone on VictoriaMetrics

Time flies, and just like that, we are already in April! The first quarter of 2025 has been packed with exciting updates for VictoriaMetrics Cloud. If you joined our latest Quarterly Virtual Meetup, you might have already seen some of these announcements alongside other great improvements across all things VictoriaMetrics.

In this post, we’ll take a closer look at what’s new in VictoriaMetrics Cloud: a revamped Organizations feature for better collaboration, seamless OpenTelemetry integration, a powerful new Explore tab, and additional API endpoints to enhance automation and control, together with many improvements based on your invaluable feedback. Let’s dive in!

Don’t forget to try it for free today by signing up for VictoriaMetrics Cloud.

Organizations: Collaborate Effectively

#

One of the most requested features has arrived! Users can now create and manage Organizations within VictoriaMetrics Cloud. This means you can now invite collaborators, assign specific roles and permissions, and organize deployments under a structured access model. This makes it easier for teams to collaborate, control access, and scale their observability collaboration.
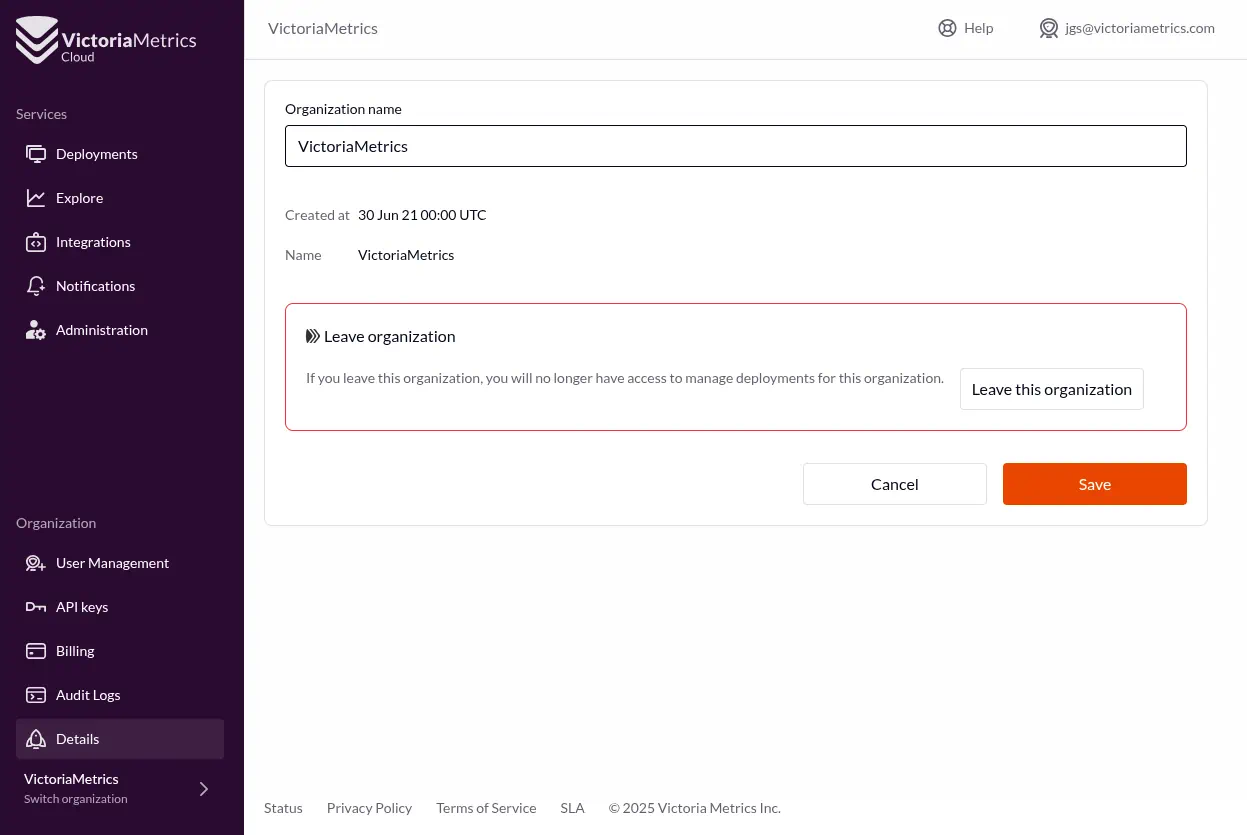
New Organizations layout New Organizations layout

To improve usability, we have also redesigned the interface to clearly separate organization-related settings from deployment management. This new layout makes navigating your monitoring environment more intuitive.

OpenTelemetry Integration: Easier Than Ever

#

VictoriaMetrics has long supported OpenTelemetry, and now we’ve made it even easier to integrate! As usual for all VictoriaMetrics Cloud use cases, you just need to pick an endpoint and a Bearer Token (for authorization), and you’ll be all set to start sending your OpenTelemetry metrics.

But those of us who grew up copy-pasting from stack-overflow (instead of ChatGPT), really love to get easy snippets to start with and later (maybe at some point in life) read the docs. That’s why if you navigate to the integrations page in VictoriaMetrics Cloud, we’ll guide you through the process. Just pick your deployment and Access Token, and we’ll do all the leg work for you.

Basic OpenTelemetry Helm Chart integration Basic OpenTelemetry Helm Chart integration

Here’s an example of an OpenTelemetry collector basic configuration in deployment mode, installed via Helm Chart, that scrapes Kubernetes metrics (making use of the almighty Cluster Metrics Preset) and sends them to a VictoriaMetrics Cloud instance. In this snippet, both Bearer Token and endpoints are just examples (for obvious reasons).

VictoriaMetrics Cloud also offers seamless integration examples and guidance via the OpenTelemetry Operator.

Push Metrics from OpenTelemetry Collector (Helm Chart)

#


mode: deployment
presets:
  # Enables K8s cluster receiver
  clusterMetrics:
    enabled: true

config:
  extensions:
    # We are using the token directly, but a filename may
    # also be provided.
    # Used to authenticate with VictoriaMetrics Cloud,
    # and needs to be included in the otlp exporter
    bearertokenauth:
      scheme: "Bearer"
      token: v3ry-c0mpl1c4t3D-4nd-s3cure-t0k3n
    # ...other extensions go here.

  receivers:
    otlp:
      protocols:
        grpc:
          endpoint: 0.0.0.0:4317
        http:
          endpoint: 0.0.0.0:4318
    # ...other receivers go here.

  exporters:
    debug: {}
    # Here we define the VictoriaMetrics Cloud endpoint
    # with auth included.
    otlphttp/cloud:
      compression: gzip
      encoding: proto
      endpoint: https://example.com/opentelemetry
      auth:
        authenticator: bearertokenauth
    # ...other exporters go here

  service:
    extensions: [bearertokenauth, health_check]
    pipelines:
      # Basic pipeline to collect metrics and send
      # them to VictoriaMetrics Cloud.
      metrics:
        receivers: [otlp]
        processors: []
        exporters: [otlphttp/cloud]
      # ...more pipelines go here.

image:
  repository: "otel/opentelemetry-collector-contrib"

Expanded VictoriaMetrics Cloud API

#

For those looking into automating their workflows, we’ve introduced several new API endpoints, enabling you to manage your cloud resources programmatically. You can find the full documentation in Swagger format or check out the detailed guide here.
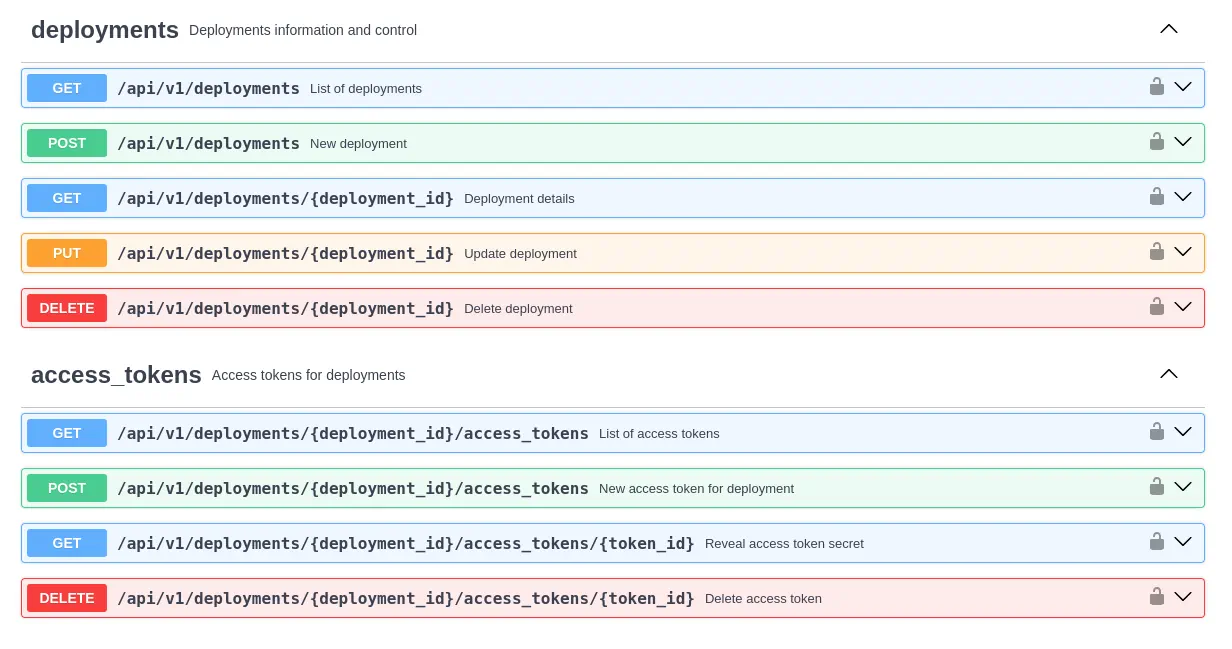
New APIs available in VictoriaMetrics Cloud New APIs available in VictoriaMetrics Cloud

The new endpoints include access to general infrastructure data such as supported cloud providers, regions, and instance types. You can also perform deployment actions (list, create, update, or delete deployments) as well as manage your access tokens with full control, including revealing secrets and revoking tokens as needed.

Explore Tab: Visualize and Analyze Your Metrics

#

We’re introducing a new Explore tab powered by the VictoriaMetrics UI! This feature helps users inspect data, build queries, and gain insights with ease. In this way, we fully separate the deployment management activities from observing your own data.

If you are curious about what you can do in the Explore table, here you can find a breakdown of the functionalities included:

Query Your Own Metrics

#

The Query section allows you to visualize your metrics in a variety of formats: graphs, tables, or JSON. You can run multiple queries at once, prettify them for readability, use autocomplete to accelerate your workflow, and trace queries to understand execution behavior more deeply.

Explore Valuable Insights

#

In the Insights section, you’ll find tools to explore your Prometheus metrics by job and instance. You can also inspect the cardinality of your time series data to help optimize resource usage and cost. Plus, you’ll discover your most frequently used and heaviest queries.

We are working on bringing the Unused Metrics functionality to VictoriaMetrics Cloud, which will identify which metrics are never queried, so you can reduce your storage footprint and costs. Stay tuned!

Analyze, Debug, and Learn

#

For advanced users, the Tools section provides built-in tools for analyzing query performance. The query analyzer breaks down execution details, while our WITH templating feature in MetricsQL simplifies building complex queries. You’ll also find step-by-step examples for debugging metric relabeling making even the scariest parts of observability more approachable (and even fun!).
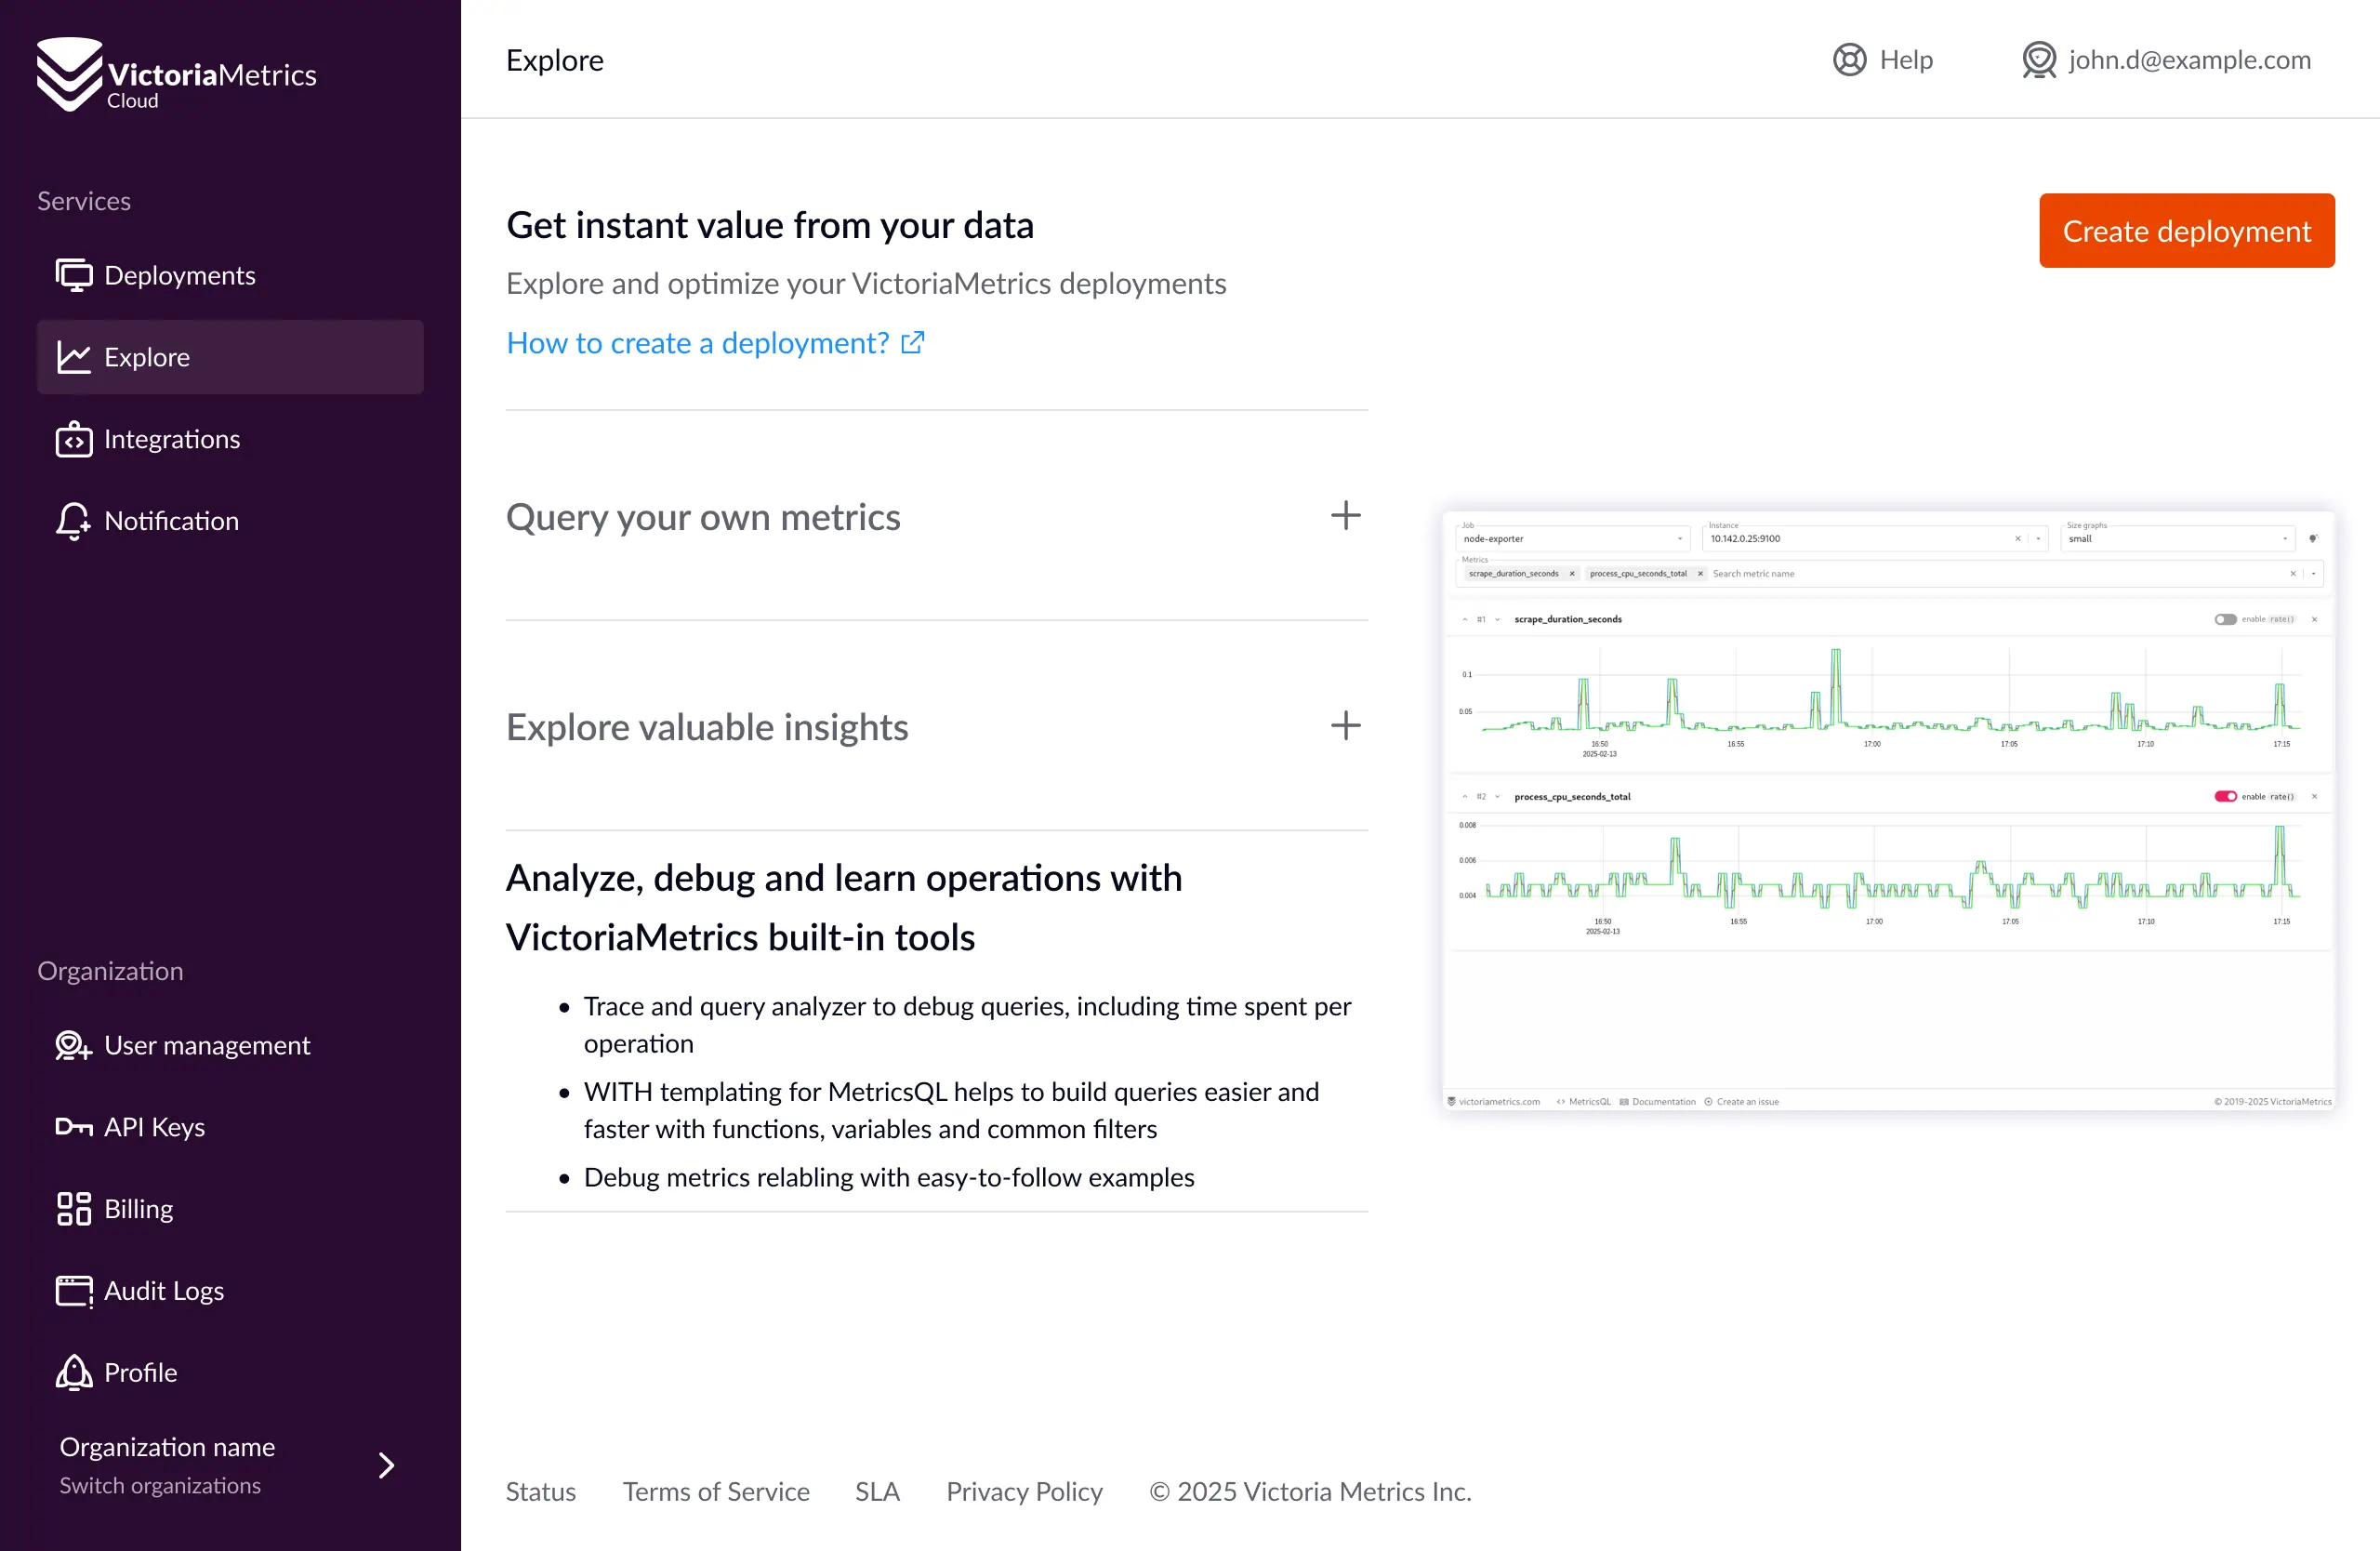
Explore metrics in VictoriaMetrics Cloud Explore metrics in VictoriaMetrics Cloud

Other Improvements

#

Improved Experience for Terminated Deployments

#

We’ve enhanced the handling of terminated deployments while always informing users in case they experience any issue with their third-party billing accounts. Rest assured, we take backups before deleting any installation and allow you to re-deploy easily once billing issues are resolved.

IPv6 Support

#

Users can now send or access VictoriaMetrics data via IPv6, including the UI.

Documentation Enhancements

#

We continue enhancing our documentation! While we’re working on a full revamp, check out these updates:

What’s Next?

#

We’re continuously enhancing VictoriaMetrics Cloud, and here’s a sneak peek at what’s coming soon:

  • VictoriaLogs is coming to VictoriaMetrics Cloud: The new and fast log management solution that everybody is talking about. Don’t forget to give it a try with example data at https://play-vmlogs.victoriametrics.com/ ! Read how it outperforms other solutions or how it compares to other log databases such as Loki or ElasticSearch.
  • PrivateLink Automation: Currently available on demand as an add-on feature (see FAQ), soon to be fully integrated into the UI.
  • More insights on unused metrics: Helping users optimize storage and reduce costs.
  • Multi Tenancy and access control Before the end of the year, we’re also enhancing tenant-based filtering and access control. This will come with improvements in both the UI and API, allowing different tenants to securely read or write specific subsets of data, which expands multi-tenant observability use cases and access boundaries.

Thanks for reading and for being part of the VictoriaMetrics community. As always, your input helps shape the future of our products.

Want to experience the latest improvements for yourself? Sign up for VictoriaMetrics Cloud and try it today!