








Following our 2025 updates, here we recap how VictoriaMetrics Anomaly Detection evolved in Q1 2026.
Stay tuned for upcoming content on anomaly detection.
Series posts:
For those who might not be familiar: VictoriaMetrics Anomaly Detection (vmanomaly) is our anomaly detection product available to enterprise customers. It helps teams detect unexpected changes in timeseries-like data, whether it comes from metrics, logs-derived metrics, or traces-derived metrics. The goal is to simplify alerting, reduce maintenance overhead, and improve signal quality across the observability stack. Learn more from the documentation.
In general, Q1 2026 was less about a single foundational launch and more about improving the full vmanomaly workflow that was outlined in the 2025 recap: simpler product onboarding, better UI ergonomics, AI assistance directly inside the UI, broader playground coverage, and more model-agnostic tools for reducing false positives in production.
The quarter continued the direction established in 2025:
make anomaly detection easier to try, operate, and adapt to real-world use cases - from PoC to production.
In Q1'26, vmanomaly shipped:
v1.28.4 to v1.29.3v1.4.1 to v1.6.1, including new features, easier authentication flows and bug fixes.server section of the config for fine-tuning UI appearance for internal usersThe UI kept receiving steady improvements during Q1'26. The main theme here was making backtesting and configuration finetuning smoother for day-to-day users:
Sorting and filtering of series returned by “Execute Query” and “Detect Anomalies” (click on “Table View” toggle in the legend or add &legend_view=table to the default state of the UI)

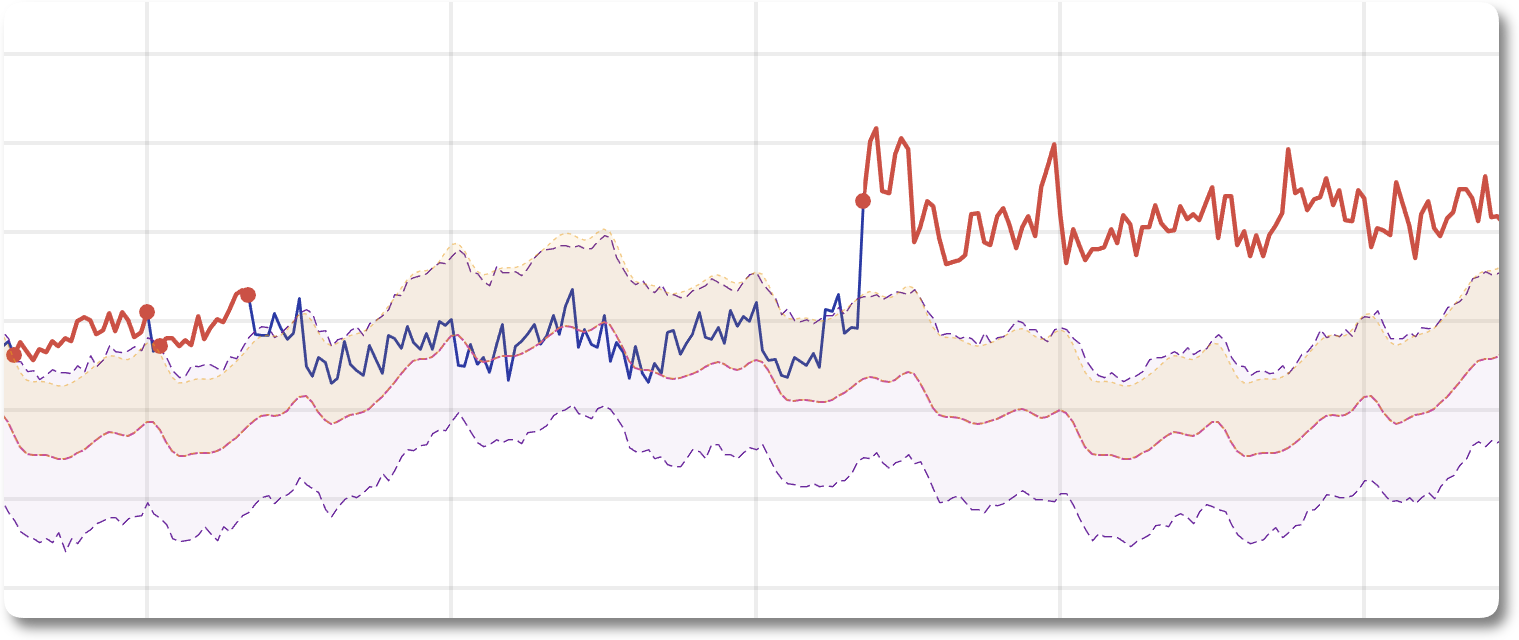
Anomaly streaks (consecutive anomalies) are now plotted as line segments instead of individual points, making it easier to visually identify longer-term patterns
Added support for UI to use reader-wise settings (credentials, TLS, etc.) for connecting to data sources, which otherwise would require having vmauth in front of both UI and data sources, just for the UI to be able to connect to them. See Authentication section for details. See config example below:
server:
  path_prefix: '/vmanomaly'  # optional path prefix for all HTTP routes

  # see https://docs.victoriametrics.com/anomaly-detection/ui/#default-state section for details on constructing the value from UI state
  ui_default_state: '#/?anomaly_threshold=1.0&anomaly_consecutive=true&fit_window=3d'  # optional default UI state opened on /vmui/
  max_concurrent_tasks: 4  # maximum number of concurrent anomaly detection tasks processed by backend

  use_reader_connection_settings: true  # if set to true, UI will use connection settings from reader configuration below when connecting to data sources, allowing it to connect with the same credentials, TLS settings, etc. without requiring having vmauth in front of both UI and data sources.

# other vmanomaly configuration sections, like reader, scheduler, models, etc.
reader:
  datasource_url: %{DS_URL}
  user: %{DS_USER}
  password: %{DS_PASSWORD}
  # or
  # bearer_token: %{DS_BEARER_TOKEN}
  verify_tls: false
  # other reader settings
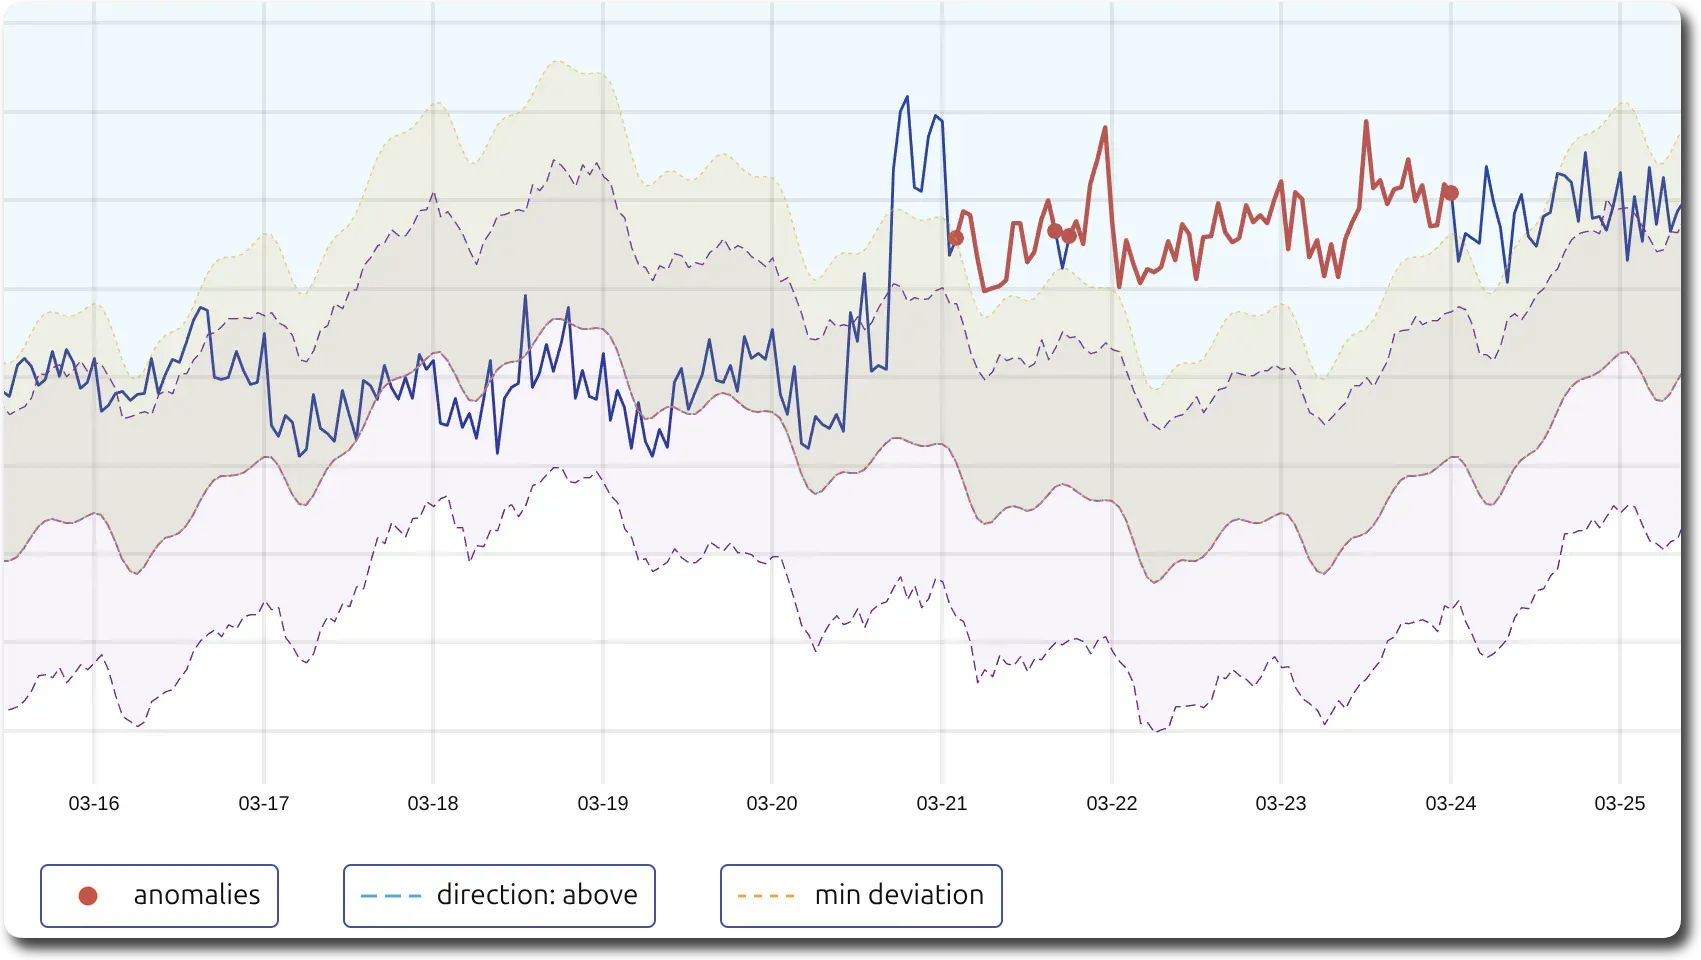
Better visualization of business arguments and how they affect anomaly detection behavior, such as detection direction (upward/downward blue area), expected value, and deviation thresholds (yellow bonds around the expected value). This is turned on by toggling the “Business Arguments” option in the legend or adding &show_business_boundaries=true to the default state of the UI.
This extends the UI work introduced in Q4'2025, but shifts the emphasis from “the UI exists” to “the UI is becoming a more practical daily workflow tool based on regular user feedback”.
One of the most notable Q1'26 additions is AI copilot inside the UI. Starting from v1.29.3, copilot can see and interact with the current UI state, making it possible to suggest contextually better
While doing so, it can also provide full documentation Q&A including UI elements and configuration options.
When connected to the vmanomaly MCP server, the assistant can also use the toolset, such as config validation, documentation Q&A, and alerting-rule generation.
This is an important step in turning the MCP integration from a separate power-user tool into part of the main product workflow, so that all users can benefit from AI assistance without needing to switch in-between interfaces.
Here’s a quick demo of how it takes server configuration and the current UI state into account when adjusting the state to requested changes:
Another Q1'26 direction was further reducing false positives with simple business-aware controls. Service gained a new model-agnostic argument for working with relative deviation from expected value, complementing the broader effort to make anomaly detection decisions closer to business significance rather than raw statistical distance alone. Works well for queries which return metrics of unknown in advance scale, where even small absolute deviations can be significant, and where confidence intervals produced by Machine Learning part, may not fully capture the expected variability of the metric.
Example: Consider a scenario of monitoring incoming traffic to websites, and the volume is usually unknown in advance (from tens to thousands visitors per second).
min_dev_from_expected may not work well for reducing false positives, as it will be either too high to fully hide small in absolute number (yet big in relative change) deviations for low-traffic websites, or too low to avoid false positives for high-traffic websites.min_rel_dev_from_expected tto values like (20, 40) - will ensure that traffic changes less than 20% drop or 40% increase won’t be considered anomalous, even if they exceed confidence intervals, thus, reducing false positives for small absolute deviations that are relatively significant.# other components like writer, schedulers, monitoring ...
reader:
# ...
queries:
# the usage of min_rel_dev should reduce false positives here
need_to_include_min_rel_dev:
expr: small_abs_values_metricsql_expression
# min_rel_dev is not really needed here
normal_behavior:
expr: no_need_to_exclude_small_deviations_metricsql_expression
models:
zscore_with_min_rel_dev:
class: 'zscore_online'
z_threshold: 3
min_rel_dev_from_expected: [10, 20] # set different thresholds for both directions, meaning that relative deviations less than 10% when y < yhat and less than 20% when y > yhat won't be considered anomalous, even if they exceed confidence intervals, thus, reducing false positives for small absolute deviations that are relatively significant
queries: ['need_to_include_min_rel_dev'] # use such models on queries where domain experience confirm usefulness
zscore_wo_min_rel_dev:
class: 'zscore_online'
z_threshold: 3
# if not set, equals to setting min_rel_dev_from_expected == 0 (meaning no filtering is applied)
# min_rel_dev_from_expected: [0, 0]
queries: ['normal_behavior'] # use the default where it's not needed
In 2025, we launched public playgrounds for trying vmanomaly without a full enterprise deployment. Q1'26 extends that with the third playground, this time focused on traces-derived metrics.
Public playgrounds now cover:
All three expose a pre-filled default UI state, which makes it easier to open the playground and immediately explore how anomaly detection behaves on example data.
Q1'26 also included documentation updates around the server section of the configuration. Now it’s easier to fine-tune the UI appearance and related behavior for internal users. This is especially helpful for teams that want to use vmanomaly as an internal tool for exploring anomalies without necessarily exposing every detail to end-users, by adjusting the default UI state, setting proper authentication flows, path prefixes, and more.
Not every useful quarterly change deserves a flashy headline. To make it short, Q1'26 releases also included a broad batch of bug fixes and resource optimizations for models, writer throughput, and the UI/server components.
We have several work-in-progress items that are expected to be released in the next few weeks, including:
Agentic skills for vmanomaly, to become part of the public skills repository
On our path to make all the models online - able to learn from streaming data without the need for repetitive retraining - an online Prophet-like model combining flexibility with better resource efficiency is under development and expected to be released in the next few weeks to replace offline Prophet in the configuration. This will allow to have a single model for a wider range of use cases, without the need to choose between the flexibility of Prophet and the efficiency of more basic online models.
The roadmap direction for Q2-Q4'26, includes:
vmanomaly MCP server and skills (once released) for easier product onboarding and cross-product interactionnode-exporter, allowing to set up anomaly detection with a few clicks on the most important signals for common use cases (configs, alerting rules, etc.)Stay tuned!
I am Fred Navruzov and have previously worked as a Data Science Lead at Ukrainian and international companies such as Competera, Rozetka, and TiltingPoint. Since 2023, I have been leading the Anomaly Detection team at VictoriaMetrics.
此内容由惯性聚合(RSS阅读器)自动聚合整理,仅供阅读参考。 原文来自 — 版权归原作者所有。