








The OpenTelemetry Astronomy Shop is a widely used demonstration environment designed to illustrate the concepts and practical implementation of observability in distributed systems. Built as a microservice-based e-commerce application, the demo provides developers with a near real-world environment where they can explore how telemetry data—metrics, logs, and traces—can be collected, processed, and visualized. Its value lies in offering a hands-on way to understand OpenTelemetry (OTel) as a standard for instrumenting modern applications.
OTLP works and offers seamless integration with any other compatible solution, with no vendor lock-in. However, until now, the demo shipped with only a Prometheus datasource. To enable developers to experiment with the VictoriaMetrics databases, our engineers forked the OTel demo repository and extended it with the VictoriaMetrics observability ecosystem. Our contribution adds VictoriaMetrics for metrics, VictoriaLogs for logs, VictoriaTraces for distributed traces, thus making it possible to experiment with all 3 signals.
Getting started with this enhanced demo is straightforward. Developers only need to clone the forked demo: VictoriaMetrics-Community/opentelemetry-demo and launch the environment with a single command. The services start automatically, and Grafana is preconfigured with VictoriaMetrics datasource, VictoriaLogs datasource, VictoriaTraces in Grafana (via Grafana Jaeger datasource).

Metrics can be explored using MetricsQL query language, logs can be searched through LogsQL , and traces can be visualized with VictoriaTraces—all accessible from the Grafana interface. In this way, the demo not only illustrates how OpenTelemetry instrumentation works but also demonstrates how a single, scalable backend can handle diverse observability signals.
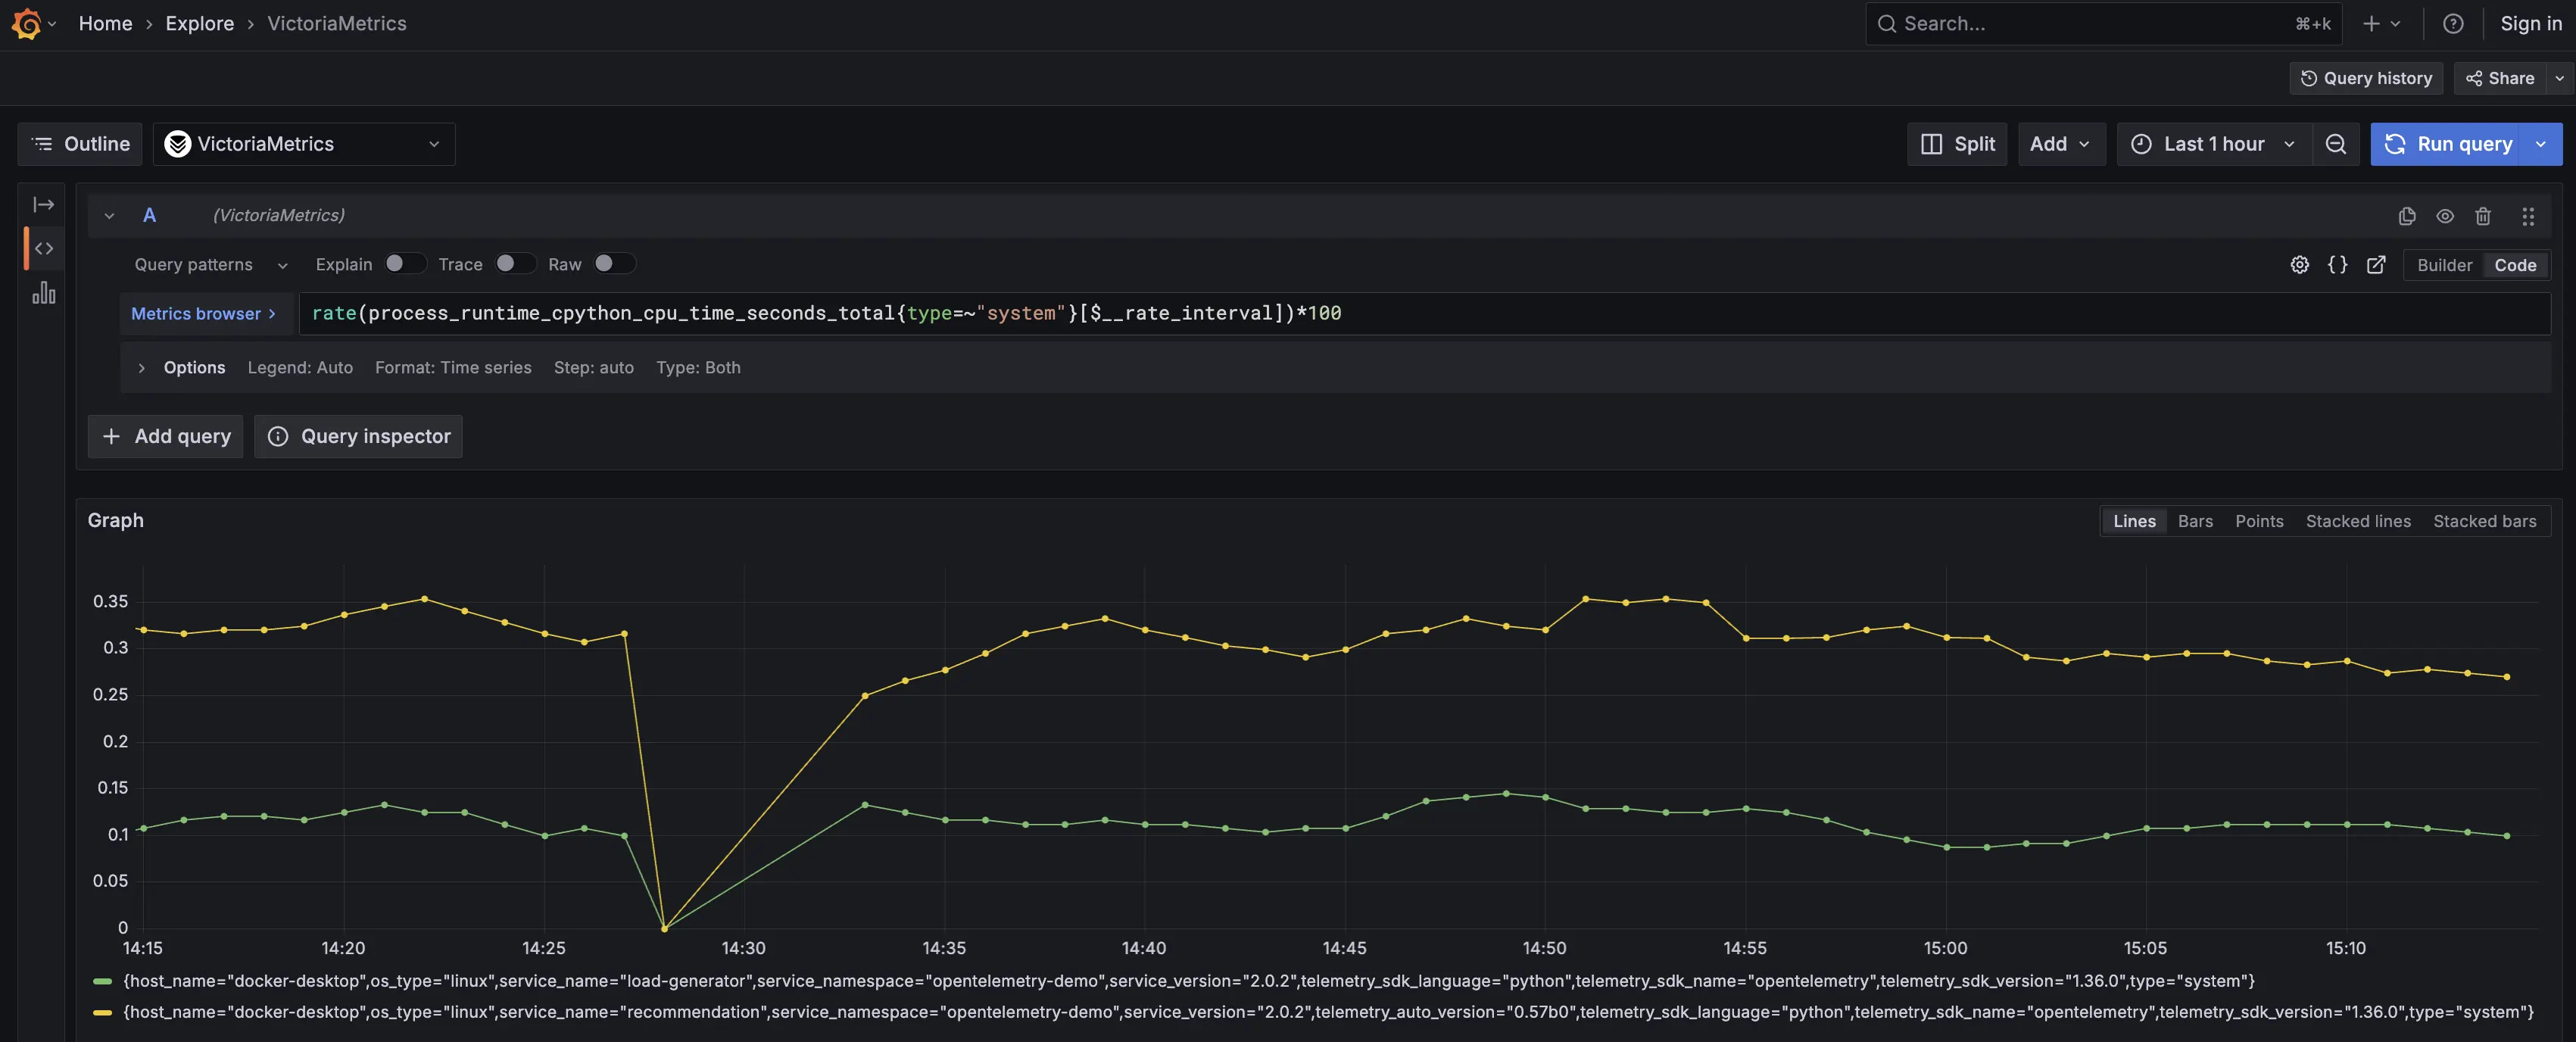
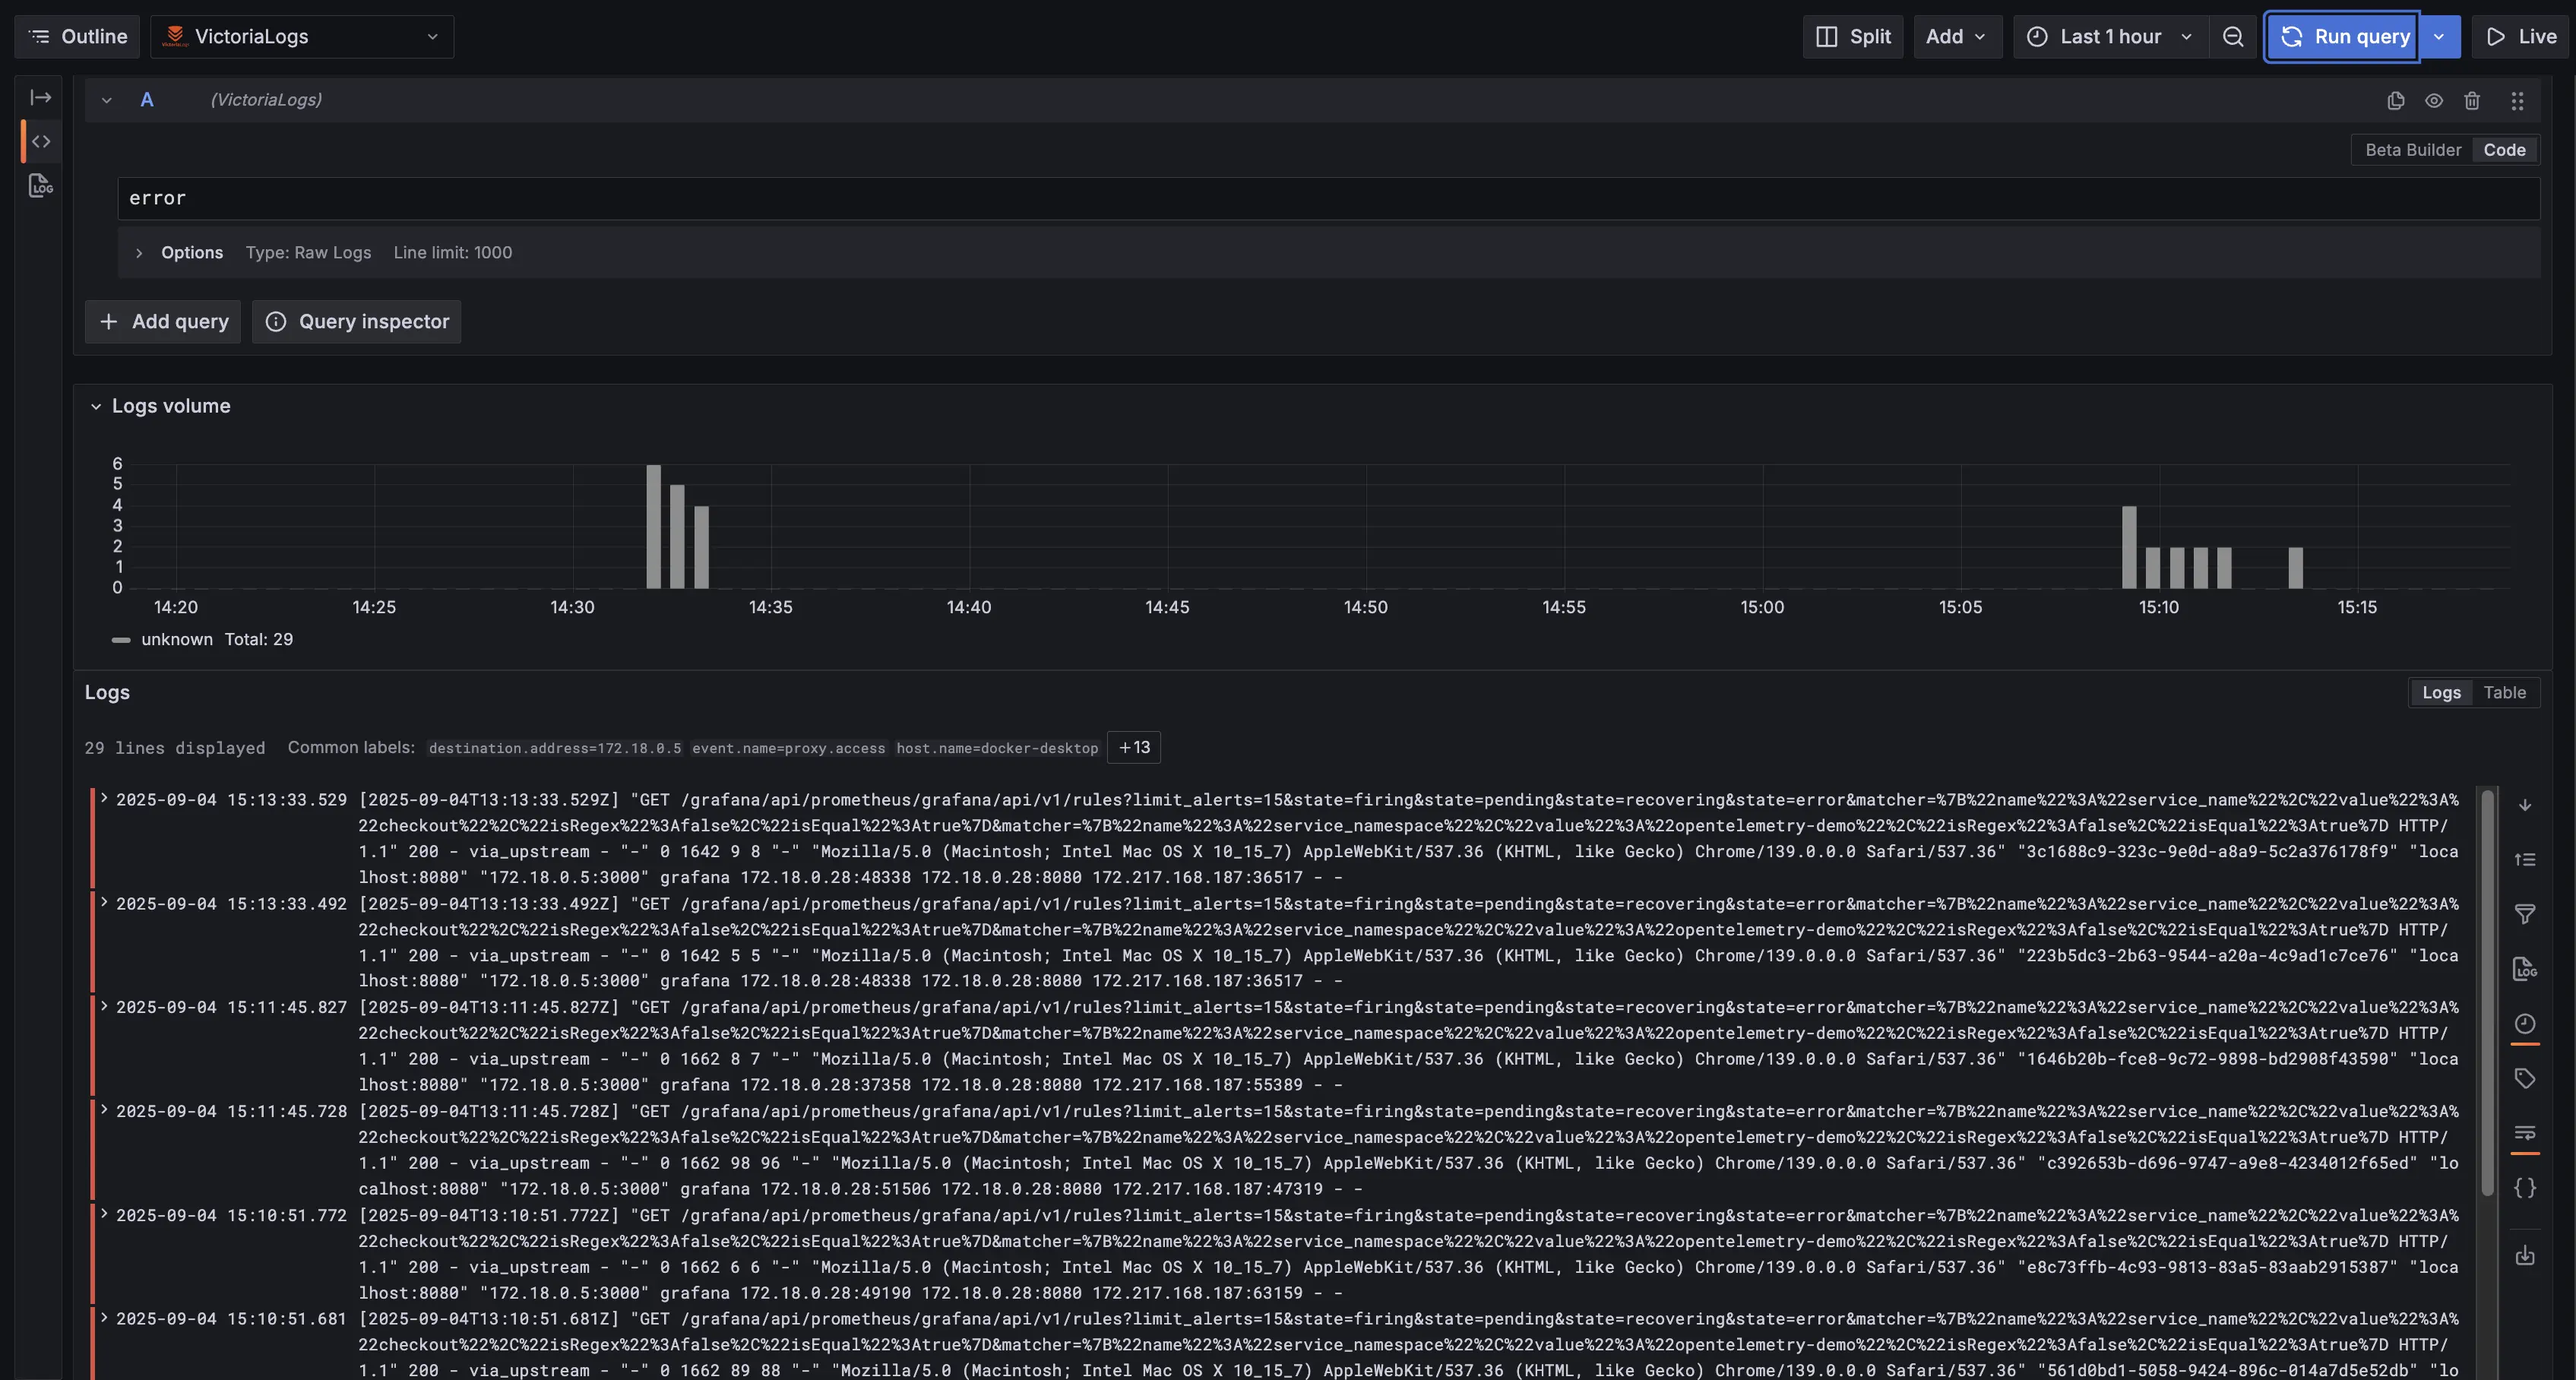
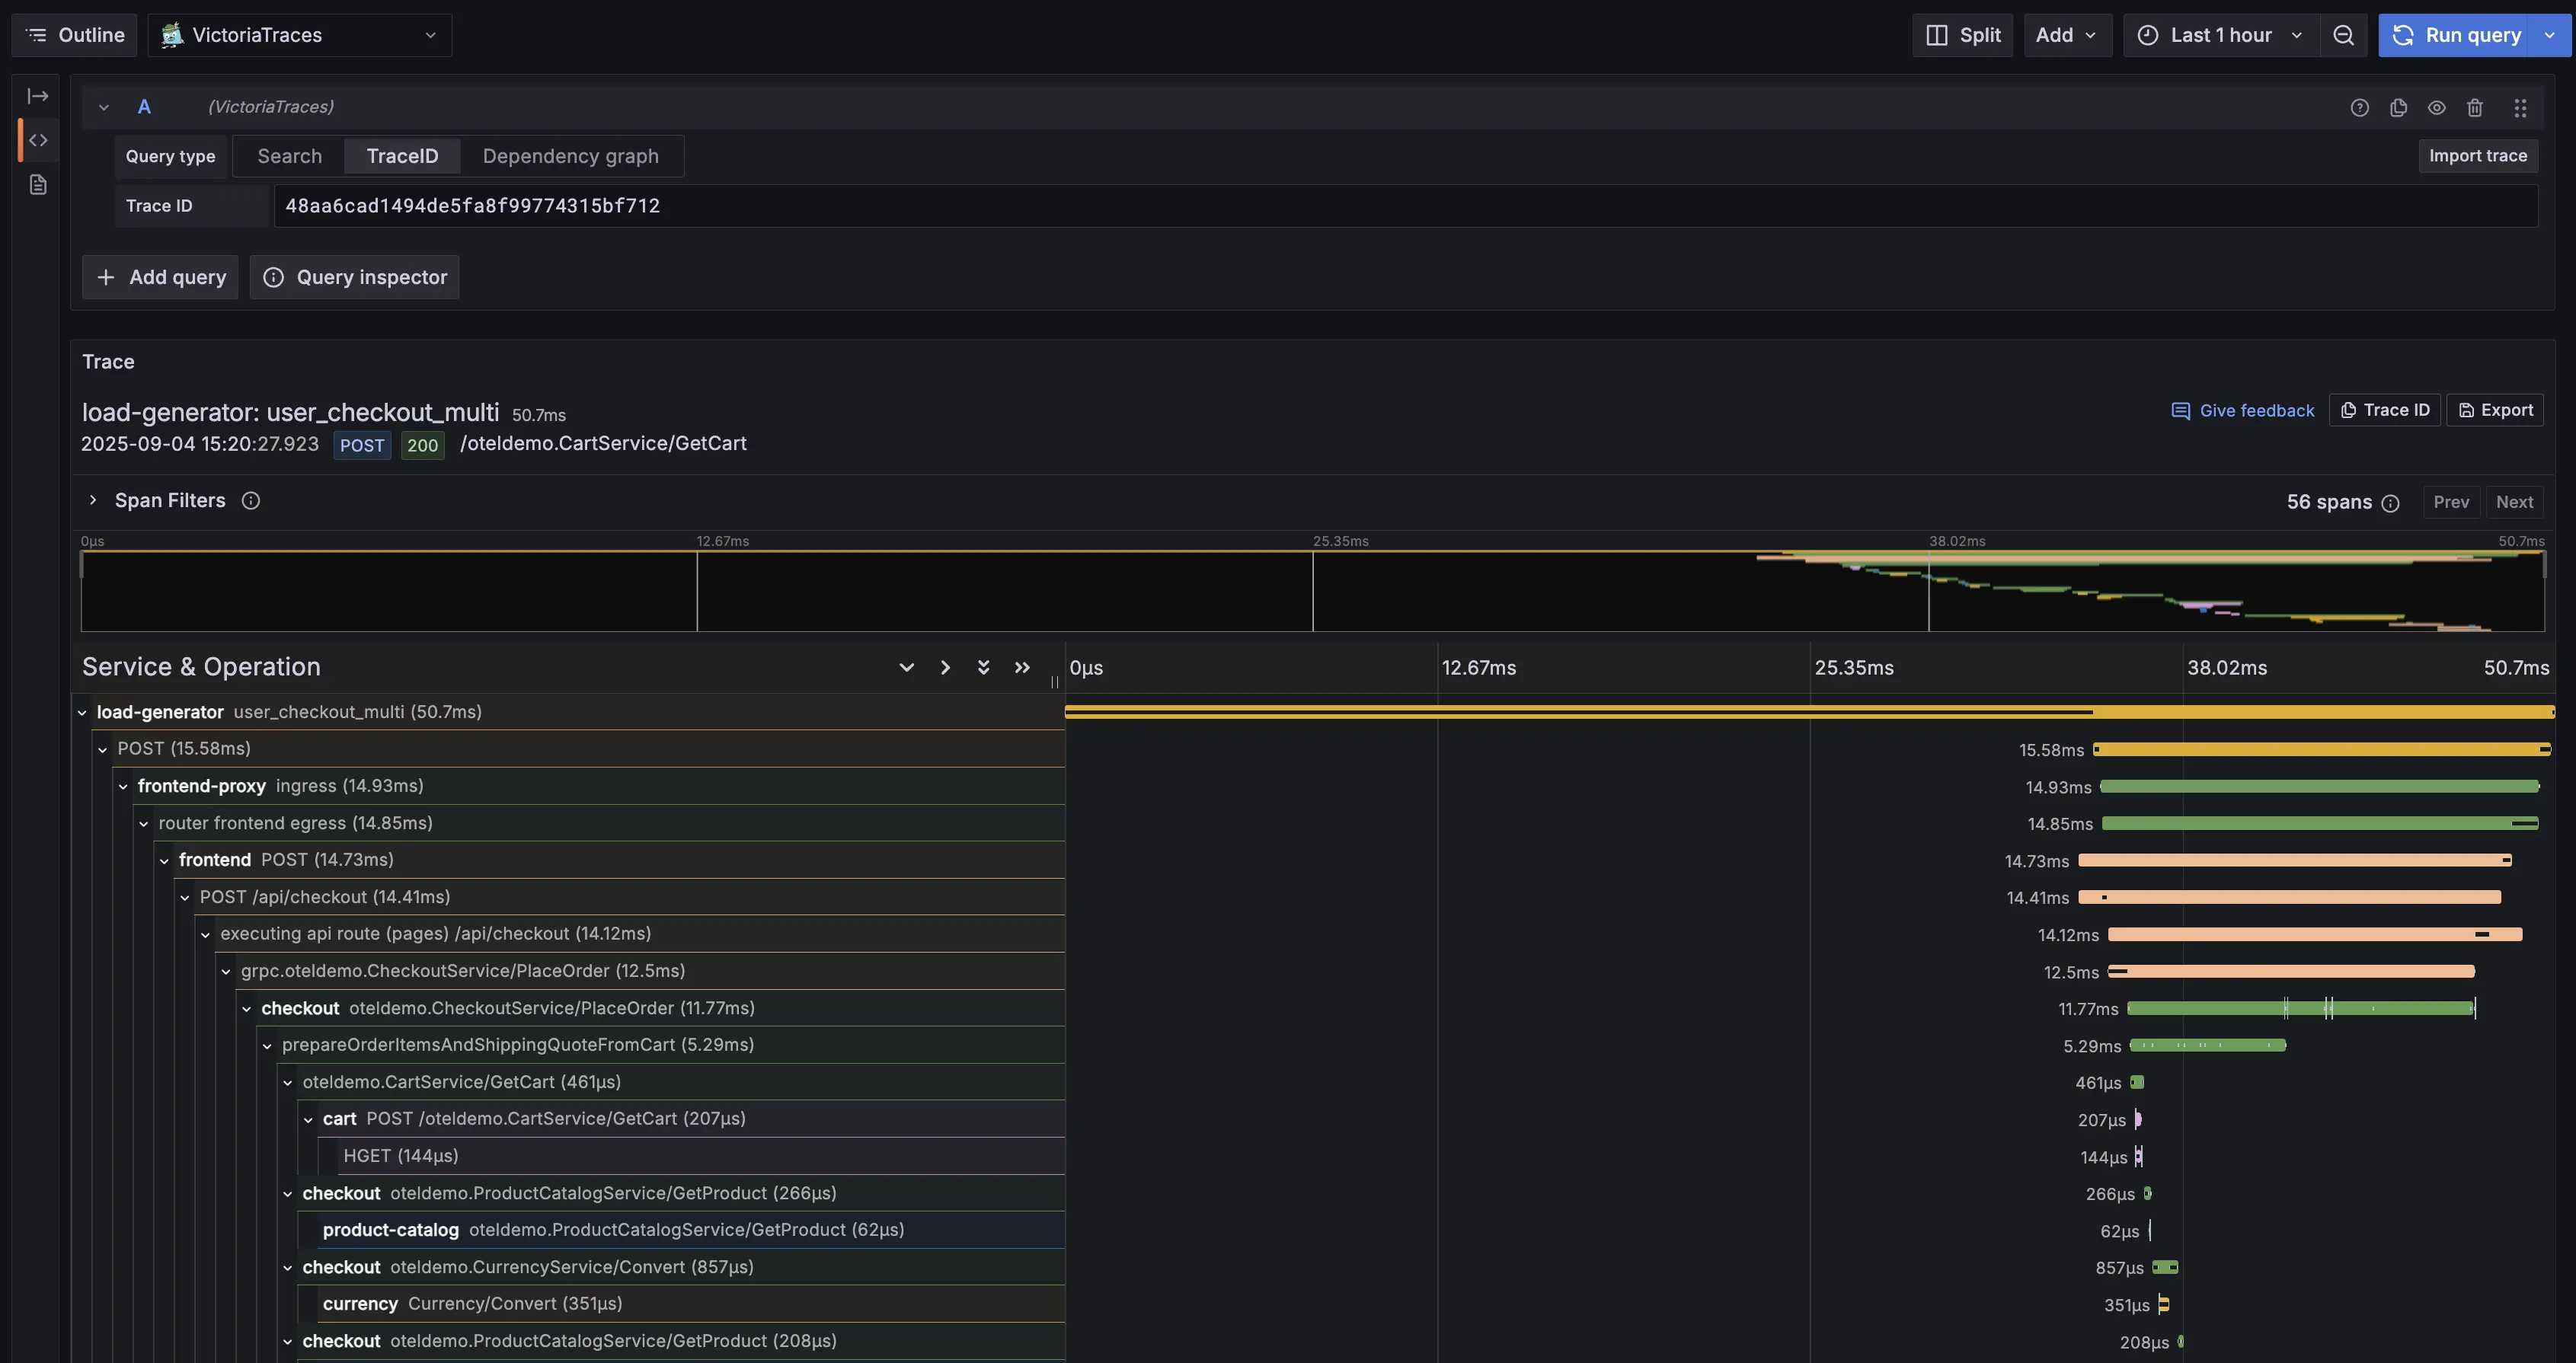
The benefits of this integration extend beyond convenience. By replacing the Prometheus-only setup with a full-stack VictoriaMetrics backend, the demo now mirrors production-ready observability architectures more closely. VictoriaMetrics is recognized for its scalability, cost efficiency, and performance, which means that the lessons developers learn in the demo can be directly applied to real-world environments. The unified stack also reduces complexity, since there is no longer a need to maintain separate systems for metrics, logs, and traces.
To showcase the new functionality, we have provided several examples within the demo. Developers can run MetricsQL queries in Grafana to analyze application performance, inspect structured logs to debug service behavior, and follow distributed traces across microservices to understand request flows. These features together create a richer, more holistic learning experience than was previously possible.
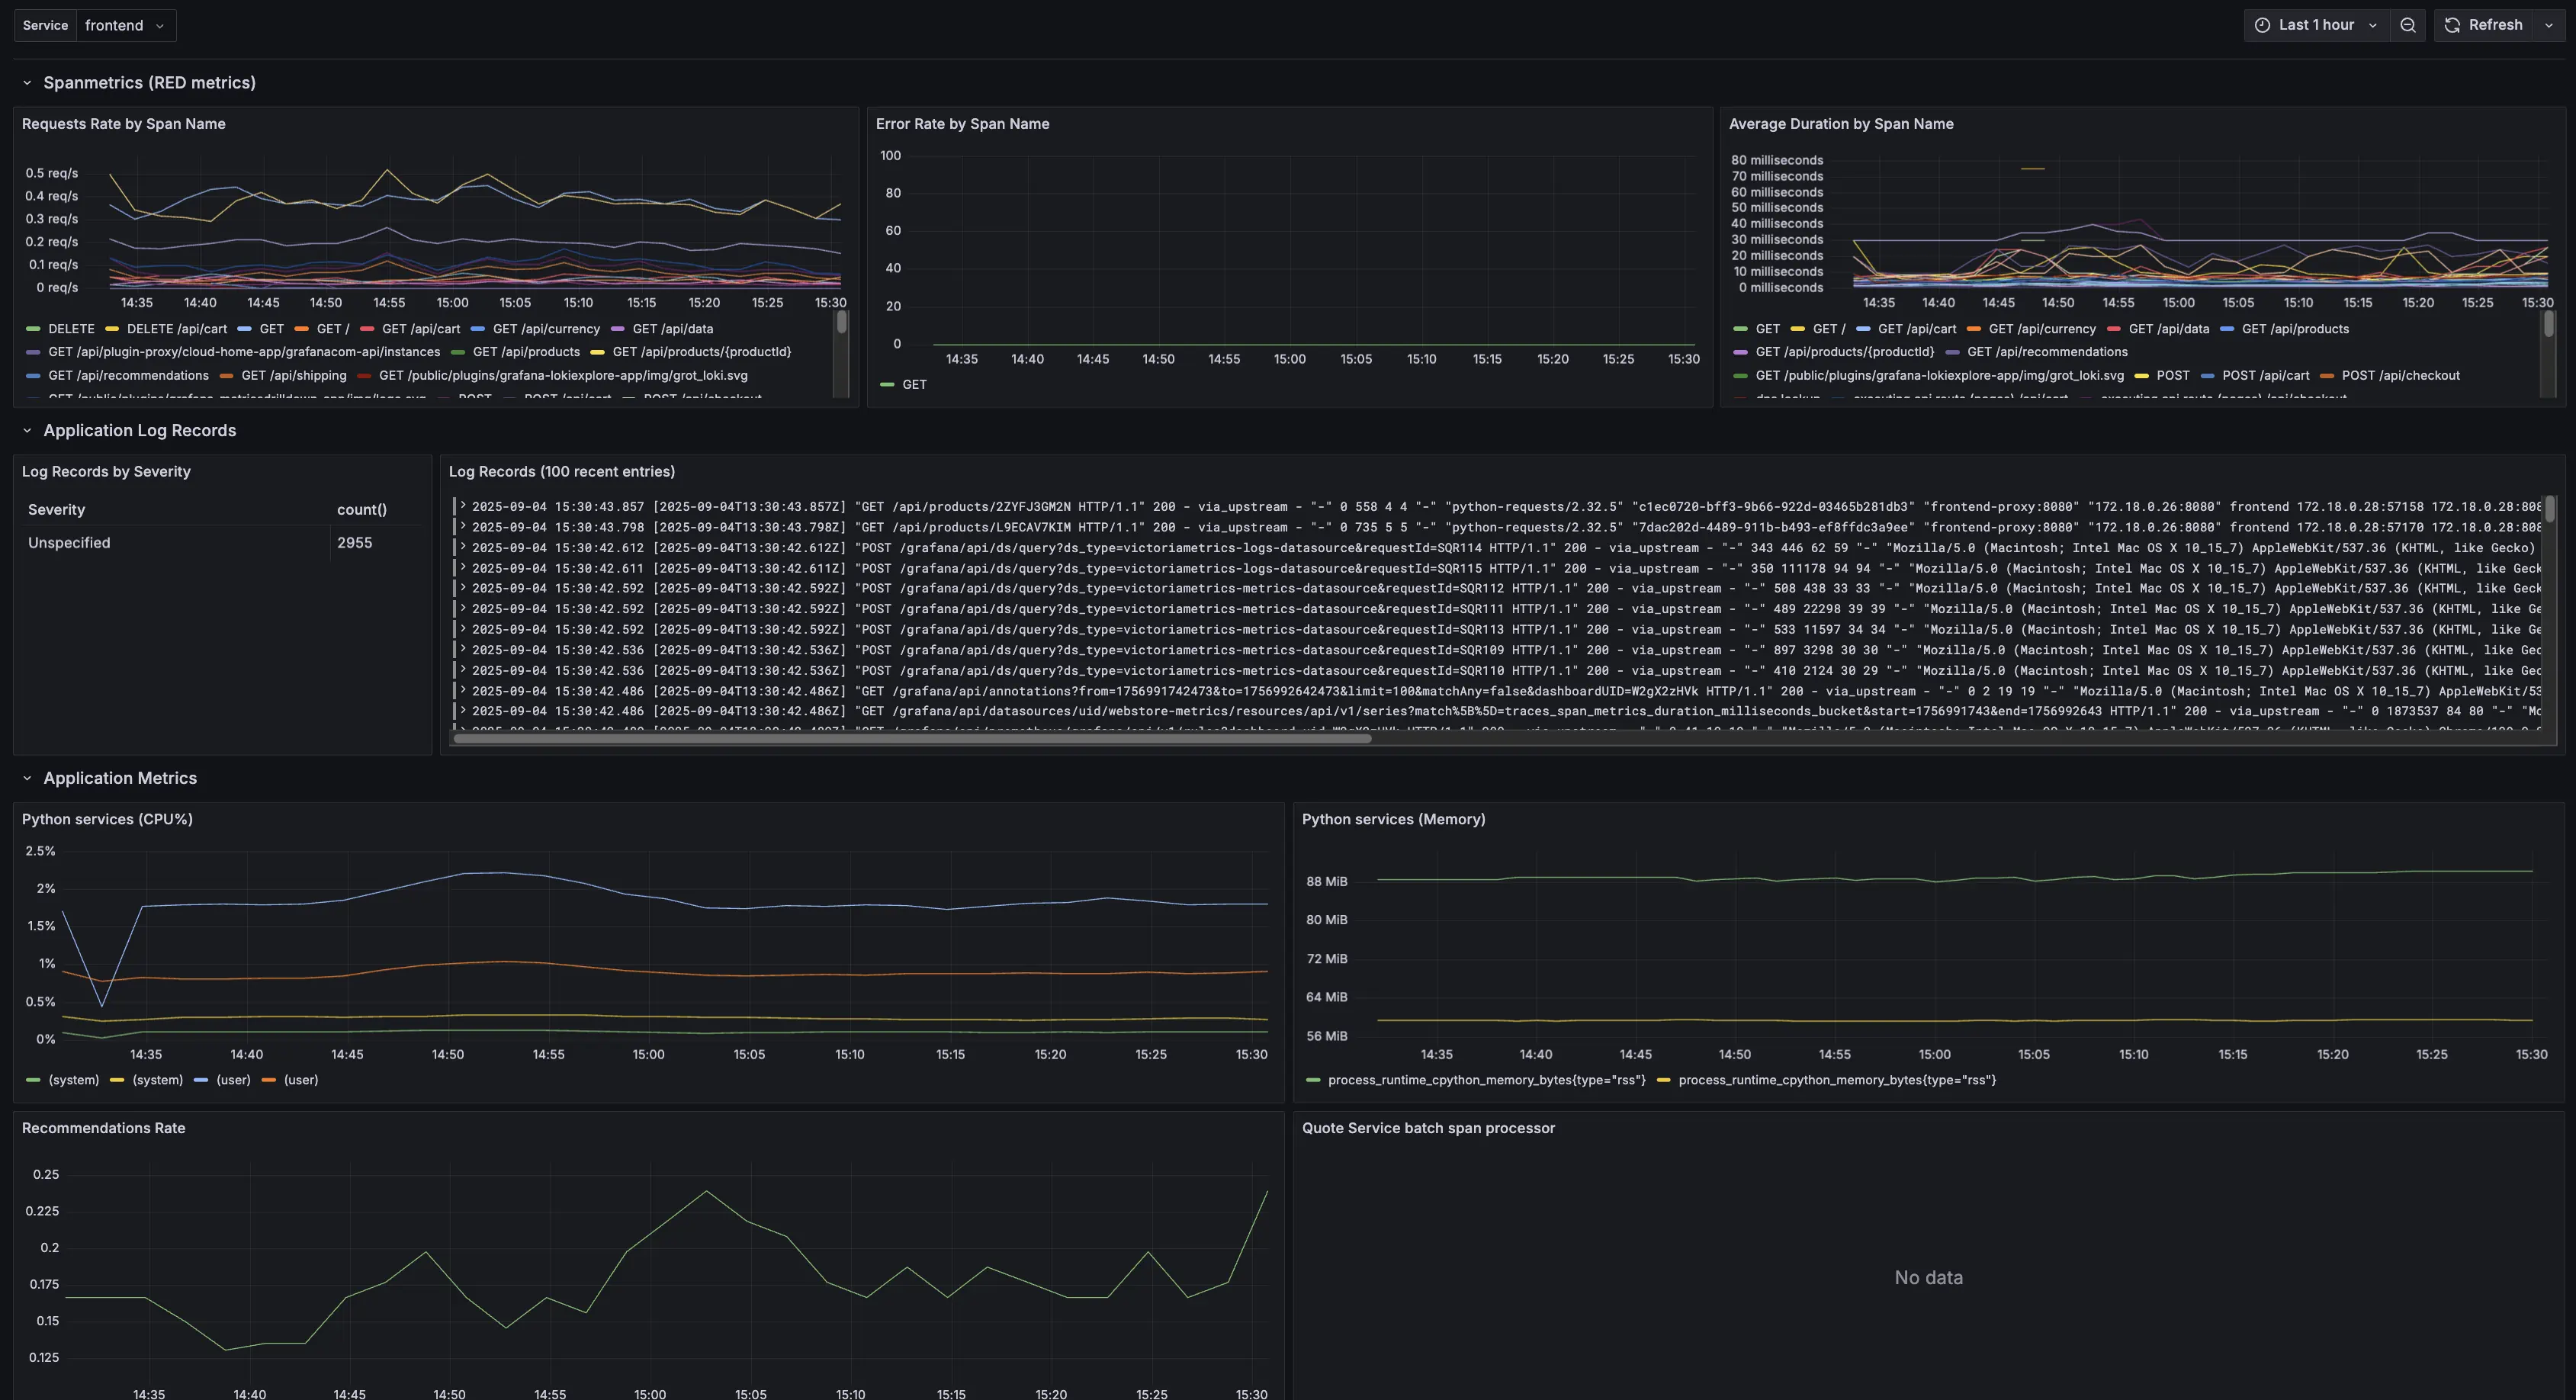
An important component of the enhanced demo is the OpenTelemetry Collector Grafana dashboard. This dashboard provides a consolidated view of key performance indicators for the system by presenting RED metrics—rate, errors, and duration—derived from the spanmetrics connector in the OpenTelemetry Collector. Developers can select a service of interest and immediately examine its RED metrics in order to evaluate performance and reliability. If the chosen service emits logs, these logs are displayed alongside the metrics, offering valuable context for troubleshooting and analysis. In addition, custom metrics produced by individual services are integrated into the same view, further enriching the observability landscape. It is worth noting that, due to the nature of telemetry aggregation, chart panels may require several minutes after the demo is first launched before meaningful data becomes visible.
This dashboard thus serves as a crucial entry point for developers, bringing together metrics and logs in a single interface and demonstrating how the OpenTelemetry Collector can generate actionable insights when paired with the VictoriaMetrics backend.
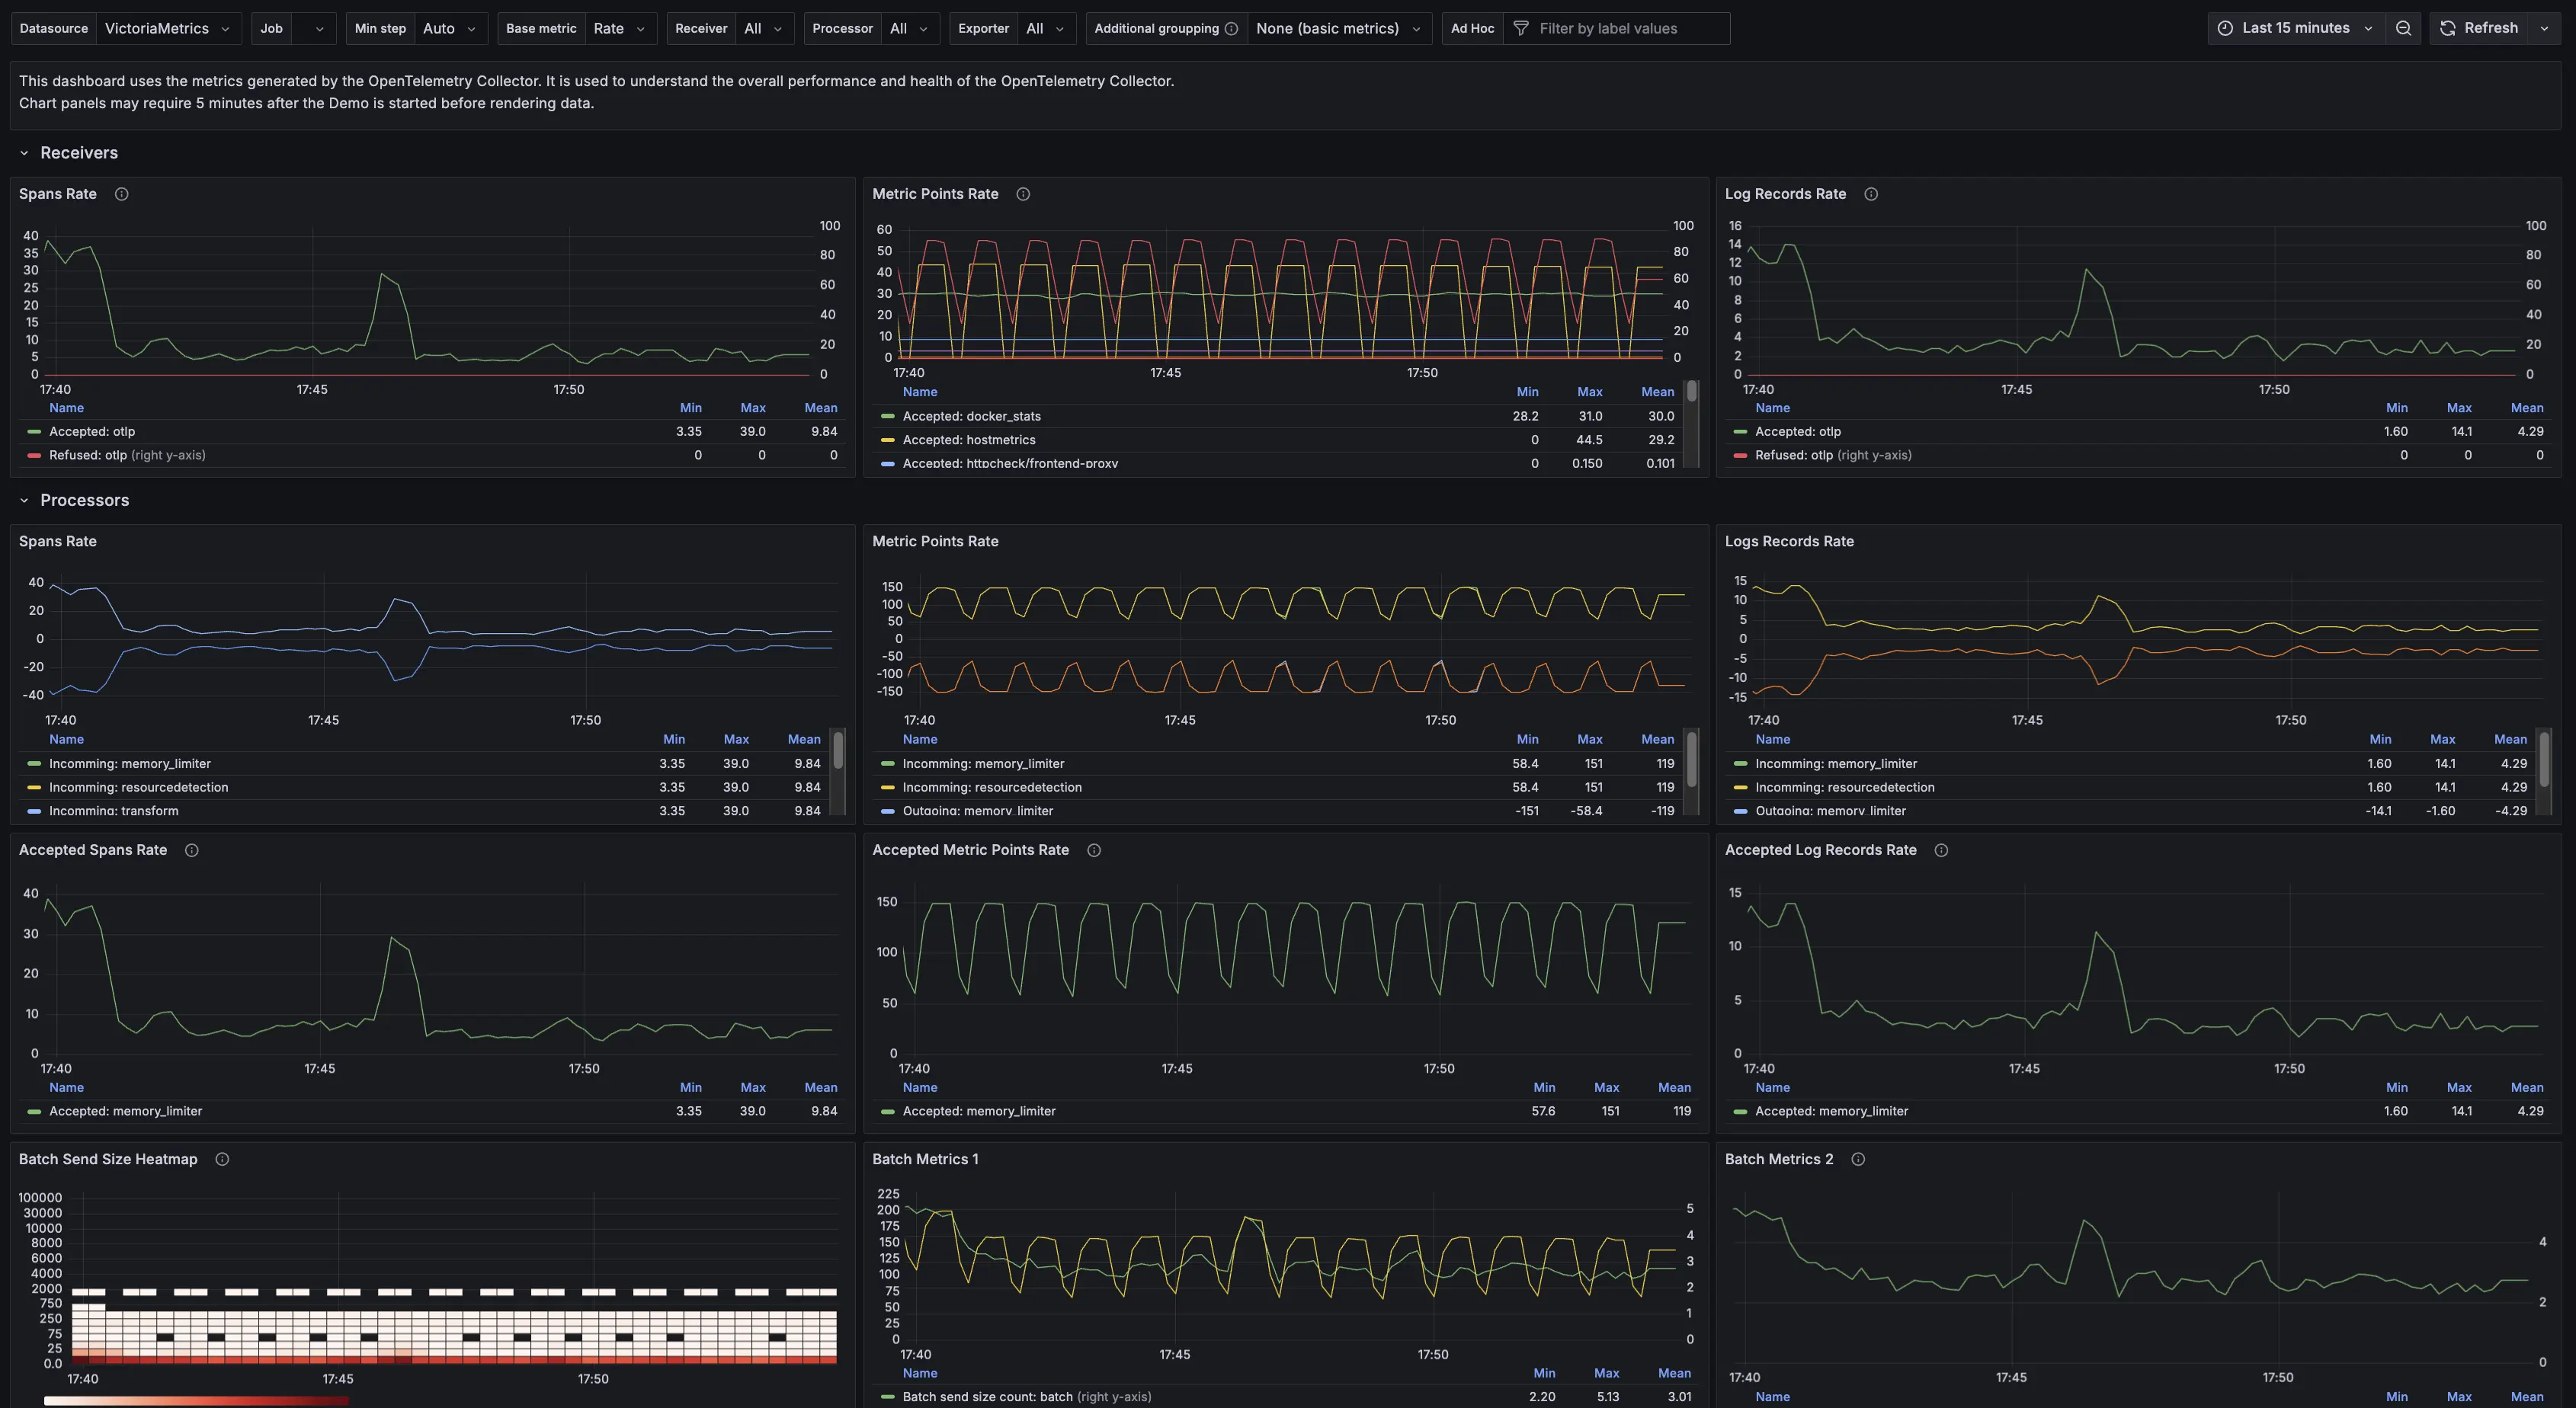
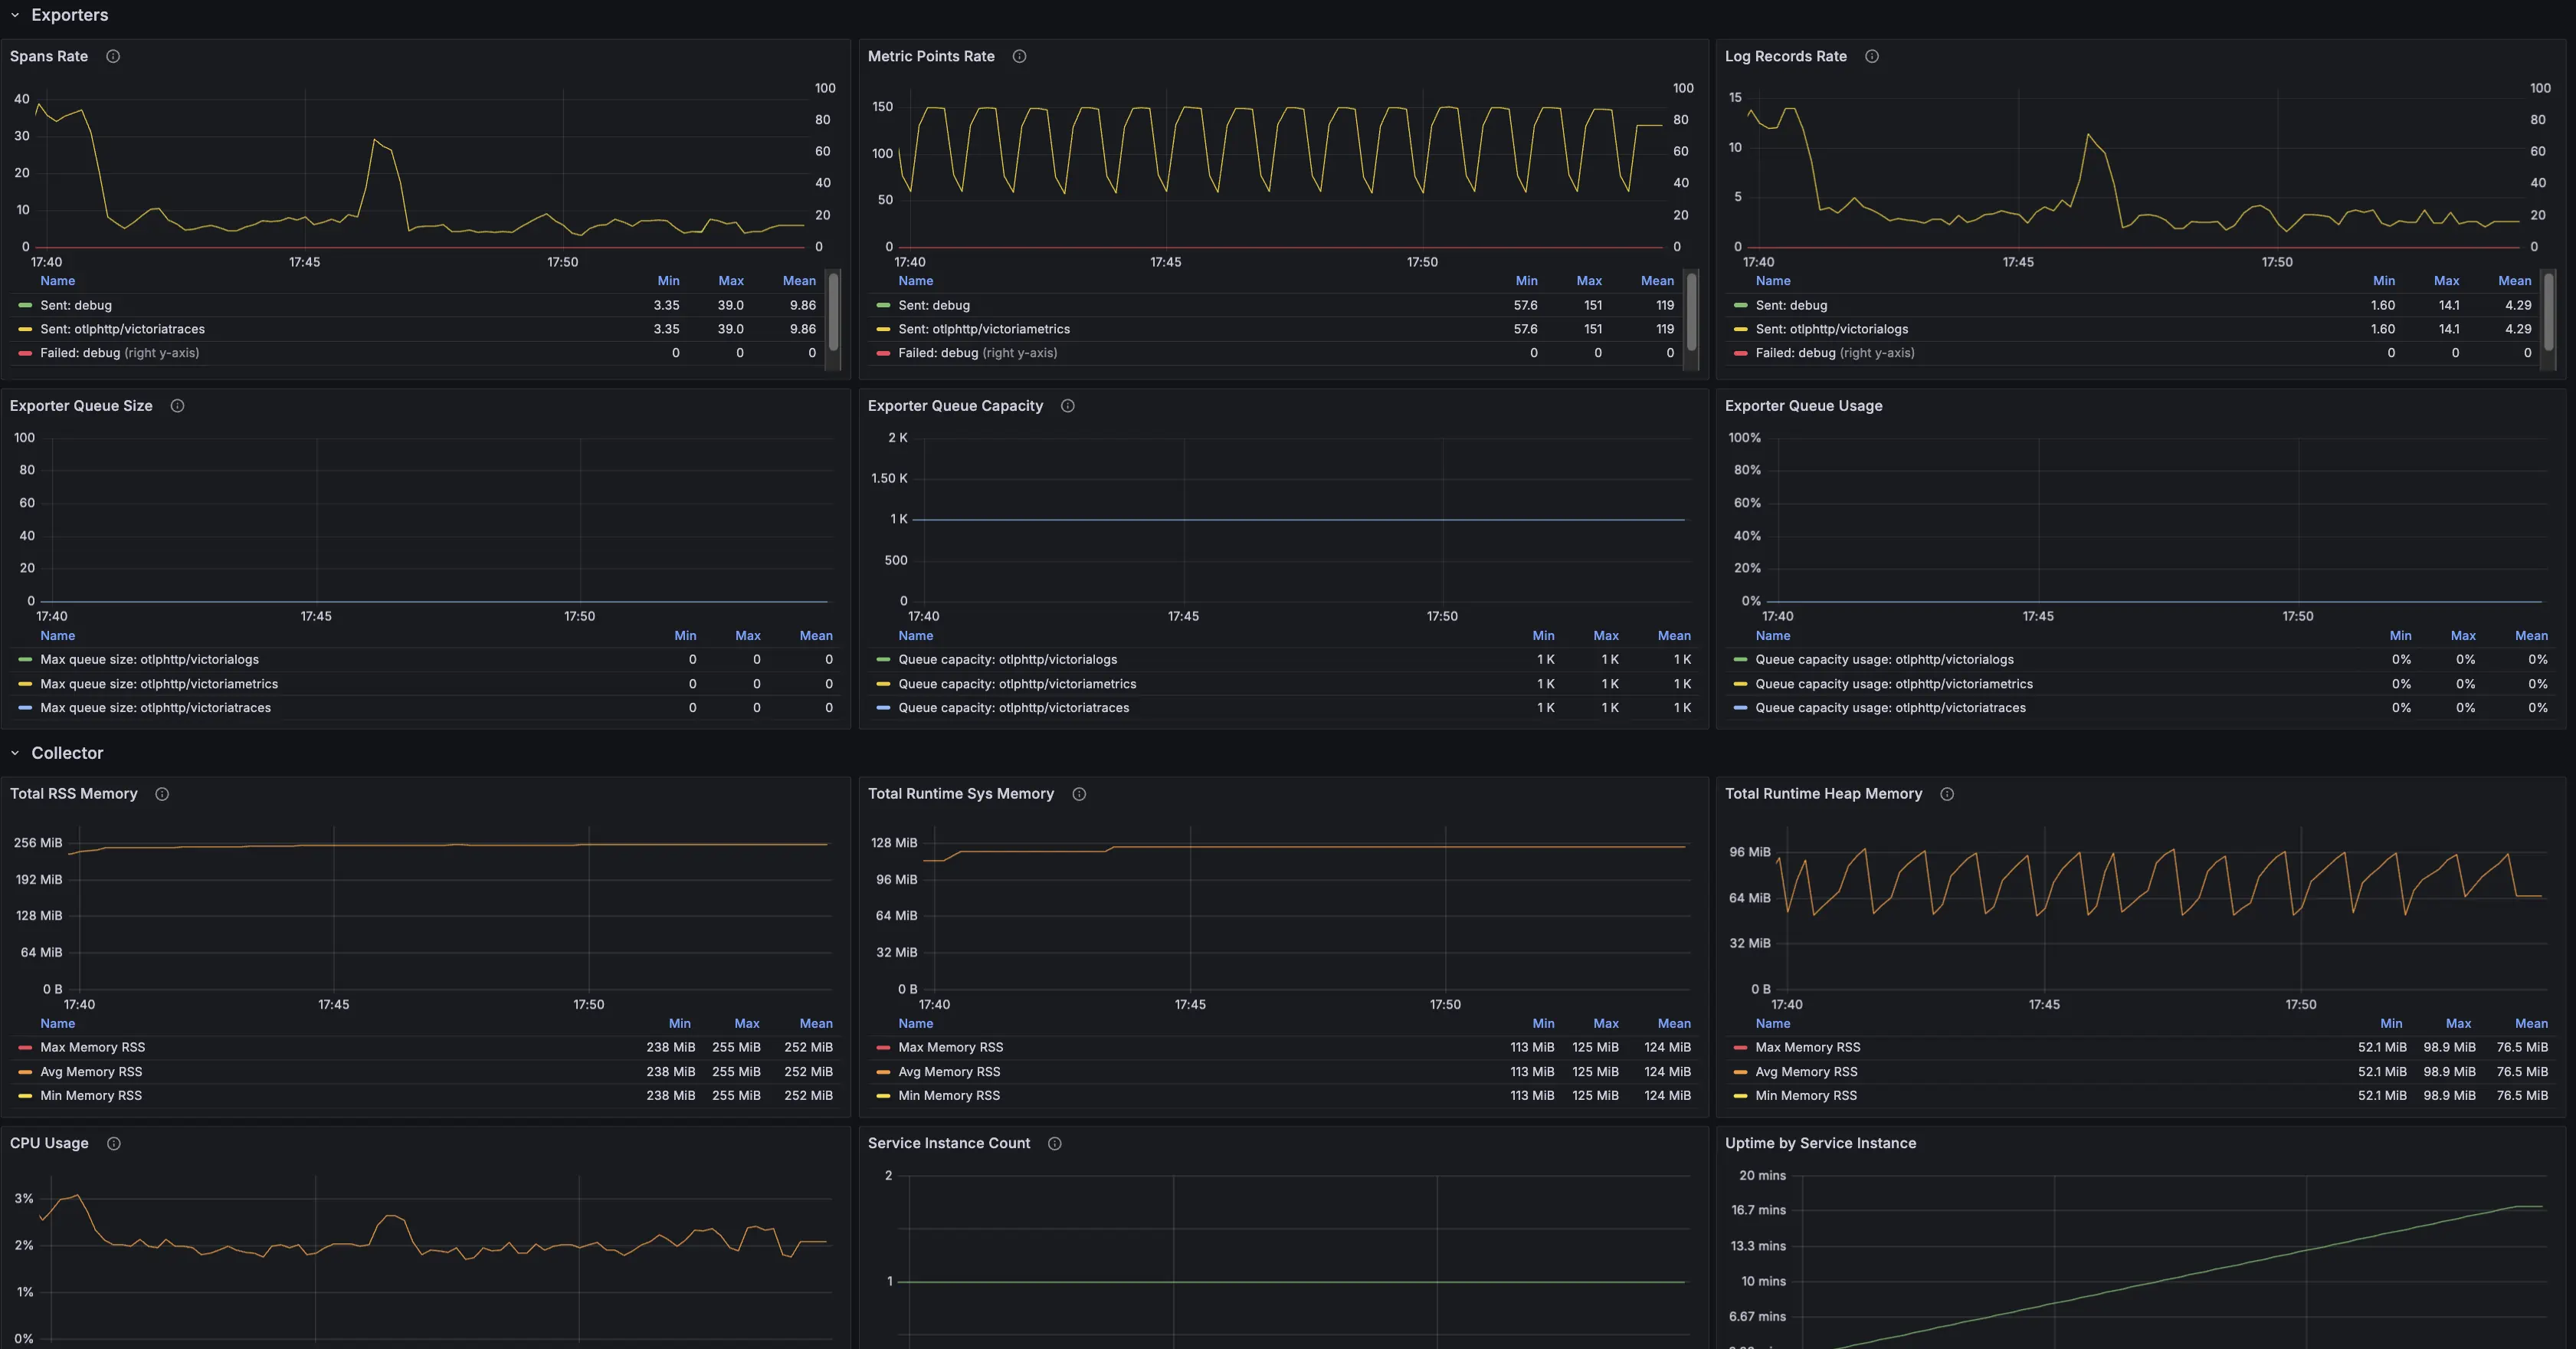
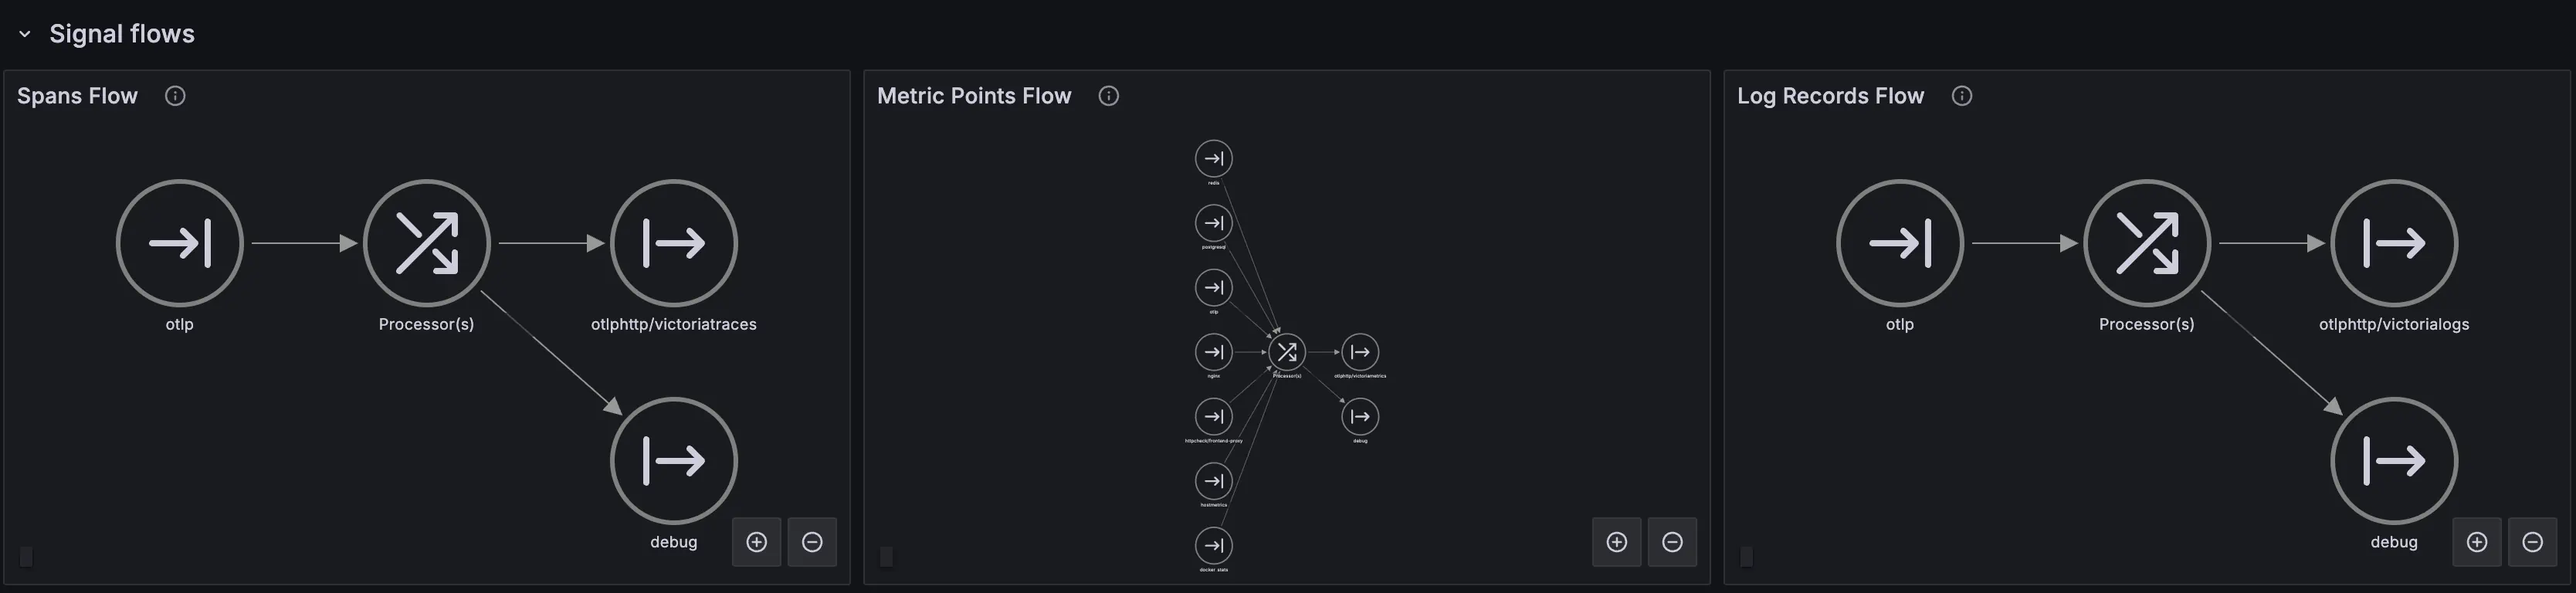
The VictoriaMetrics fork of the OpenTelemetry Astronomy Shop demo provides insights into the VictoriaMetrics observability stack through the integration of VictoriaMetrics, VictoriaLogs, and VictoriaTraces. We invite the community to explore the demo, experiment with the extended capabilities and contribute to further improvements.
By doing so, developers will not only deepen their understanding of OpenTelemetry but also experience firsthand how simple and effective unified observability with VictoriaMetrics can be.
Check out our VictoriaMetrics, VictoriaLogs, VictoriaTraces for more details and get involved with our community. If you spot anything outdated or have questions, don’t hesitate to reach out. You can drop me a DM on LinkedIn.
此内容由惯性聚合(RSS阅读器)自动聚合整理,仅供阅读参考。 原文来自 — 版权归原作者所有。