








January has passed, and the VictoriaMetrics teams have been busy with releases spanning the complete VictoriaMetrics Observability Stack to make the solution faster to run, easier to operate at scale, and better integrated with modern cloud-native stacks.
This roundup covers releases for:
- VictoriaMetrics
- VictoriaLogs
- VictoriaTraces
- VictoriaMetrics Cloud
- VictoriaMetrics Kubernetes Operator
VictoriaMetrics v1.131.0 to v1.134.0 — introduction of partition index, dashboard refinements, and ingestion/query optimizations
#
This month brings four new releases to VictoriaMetrics. Here are the highlights:
- Partition indices auto-delete when partitions exceed retention, reducing storage maintenance overhead.
- Dashboards show larger panels with improved grouping for queue visibility.
- New metrics track rollup cache efficiency, client cancellations, and persistent queue capacity; retention now supports month-based (
M) settings. - Multi-level queries run faster with lower ingestion CPU use, smarter cluster rerouting, and more graceful handling of short spikes of concurrent requests.
- Bug fixes and optimizations across ingestion, querying, storage, and UI reduce index creation overhead and improve stability.
Improvements in v1.134.0
- Better single-node dashboard: the top stats panels are now larger and aligned with the cluster dashboard. Troubleshooting panels were reviewed and are now grouped by
job, while Drilldown panels are grouped byjobandinstance. See #10187-comment and #10260 for the complete list of changes. - New Rollup cache metrics: we added the
vm_rollup_result_cache_requests_totalmetric tovmsingleandvmselect. This helps analyze rollup cache efficiency. A newRollup result cache miss ratiopanel was added to the cluster dashboard. - More visibility into client-canceled requests in vmauth: vmauth now exposes
vmauth_http_request_errors_total{reason="client_canceled"}, making client-side cancellations (timeouts, closed browser tabs) visible in metrics. This helps explain user-facing errors that were previously invisible. - Explicit month-based retention configuration: the
-retentionPeriodflag now supports months via theMunit. For example,3Mmeans three months (93 days). - Bug fixes: this release includes multiple stability and correctness fixes across ingestion, querying, storage, and UI components. Notable improvements include reduced CPU spikes during daily index creation.
Highlights of v1.133.0
- The partition index has been improved by Artem Fetishev (@rtm0) and the team. IndexDBs are now deleted when their partitions fall outside the retention window. Read more about the motivation behind this feature at #7599 and what to expect at #8134.
vmauthnow waits for-maxQueueDurationbefore returning 429 (Too many requests), reducing error responses during short spikes of traffic.vmauthrequest-related metrics have been fixed; now showing more accurate information about the request lifecycle.
Highlights for VictoriaMetrics v1.132.0
- Dashboards: multiple dashboards were enhanced with new panels and diagnostics, including “Memory usage” breakdowns, “Major page fault rates”, and improved flag/configuration visibility. Also, we added links for community and enterprise support and improved troubleshooting and documentation.
- Ingestion performance: reduced CPU usage when ingesting Influx line protocol (with escaped characters) and OpenTelemetry metrics (4-6x).
- Cluster stability: improved slowness-based rerouting in
vminsert. Rerouting now targets only the slowest storage node and activates only when the cluster has spare capacity, preventing rerouting storms. - Added support for Zabbix Connector ingestion.
Main improvements for v1.131.0
- Multi-level vmselect queries run faster. Internal tests showed a 30% reduction in latency.
- Backup tagging support. New
-backupTypeTagNameflag adds a tag with the backup type (hourly, daily, weekly, monthly, latest) to each backup object. This simplifies automated cleanup via S3 lifecycle policies. - Refined
Raw Querypanel in VMUI. The step selector was removed, and points are displayed as distinct samples, with clustering in dense regions. This change simplifies sample inspection and reduces the risk of deduplication issues.
VictoriaLogs v1.40.0 to v1.43.0 — Kubernetes collector refinements and 10x OpenTelemetry parsing speedup
#
January brings four new releases for VictoriaLogs. These are the key improvements:
- Collect logs from Kubernetes Pods with 10x faster OpenTelemetry parsing.
- Get sample logs in alerts and automatic tenant syncing, so on-call engineers see the complete context immediately and query the right environment.
- Parse Kubernetes system logs into structured fields for faster querying, grouping, and troubleshooting.
- Return
histogram()stats as VictoriaMetrics-style buckets for direct use in alerting rules and Grafana heatmaps without manual conversion. - Selectively attach Pod/Node metadata and filter logs early via LogsQL, shrinking log size, reducing API server load, and stopping noisy or sensitive data shipment.
Multiple improvements for Kubernetes in v1.42.0 and v1.43.0
- Kubernetes Collector: you can now choose whether Pod/Node labels and annotations are attached to each log line with new flags like
-kubernetesCollector.includePodLabels,-kubernetesCollector.includePodAnnotations,-kubernetesCollector.includeNodeLabels,-kubernetesCollector.includeNodeAnnotations, allowing logs to be smaller and cleaner. This feature lets you avoid shipping noisy or sensitive metadata while still filtering by it. - Kubernetes Collector: new
-kubernetesCollector.excludeFilterlets you drop logs early using a normal LogsQL filter over Kubernetes metadata (namespace, pod/container name, labels/annotations, etc.), so unwanted workloads never get read from disk or sent downstream. - Kubernetes Collector: pod watching now uses Kubernetes
resourceVersionand resumes from the last seen version after a dropped watch connection, so reconnects don’t trigger full “re-list everything” calls, and the API server load stays much lower in large clusters. - Kubernetes Collector: Kubernetes “system logs” in Klog format are automatically parsed into structured fields (e.g.,
level,thread_id,source_line, plus key/value pairs) instead of a single raw text message, which makes querying and grouping easier. - HTTP querying API:
/select/logsql/stats_queryand/select/logsql/stats_query_rangenow returnhistogram()stats as VictoriaMetrics-style histogram buckets (*_bucketseries withvmrangelabels), so you can use histogram stats directly in vmalert recording rules and Grafana heatmaps.
Highlights for VictoriaLogs v1.40.0
- vlagent can now read logs directly from Kubernetes Pods. This gives you a fast, lightweight Kubernetes log collector that works with VictoriaLogs and other log backends. In addition, it will continue to receive first‑class optimizations for VictoriaLogs, as it is built and maintained by the same logs team.
- We improved parsing speed for logs ingested via the OpenTelemetry protocol by up to 10x (e.g., it reduces CPU usage by up to 10x).
- Log statistics APIs can now return a sample log line together with counts. When an alert fires, you can include an actual example log message in the alert, so on‑call engineers see concrete context immediately instead of only a number.
- The web interface now displays the current VictoriaLogs version. This makes it easier to coordinate upgrades, compare environments, and work with support without having to guess which version is deployed.
- The UI automatically keeps the selected tenant in sync with account and project information from the server. This reduces the risk of accidentally querying the wrong tenant or wondering why “there is no data” when you’re in the wrong context.
- VictoriaLogs now runs on the latest Go version, which includes upstream security and stability fixes. In practice, this means fewer runtime‑level vulnerabilities and crashes, and less need for emergency patching.
VictoriaTraces v0.7.0 is out — 30% less CPU usage and improved accuracy
#
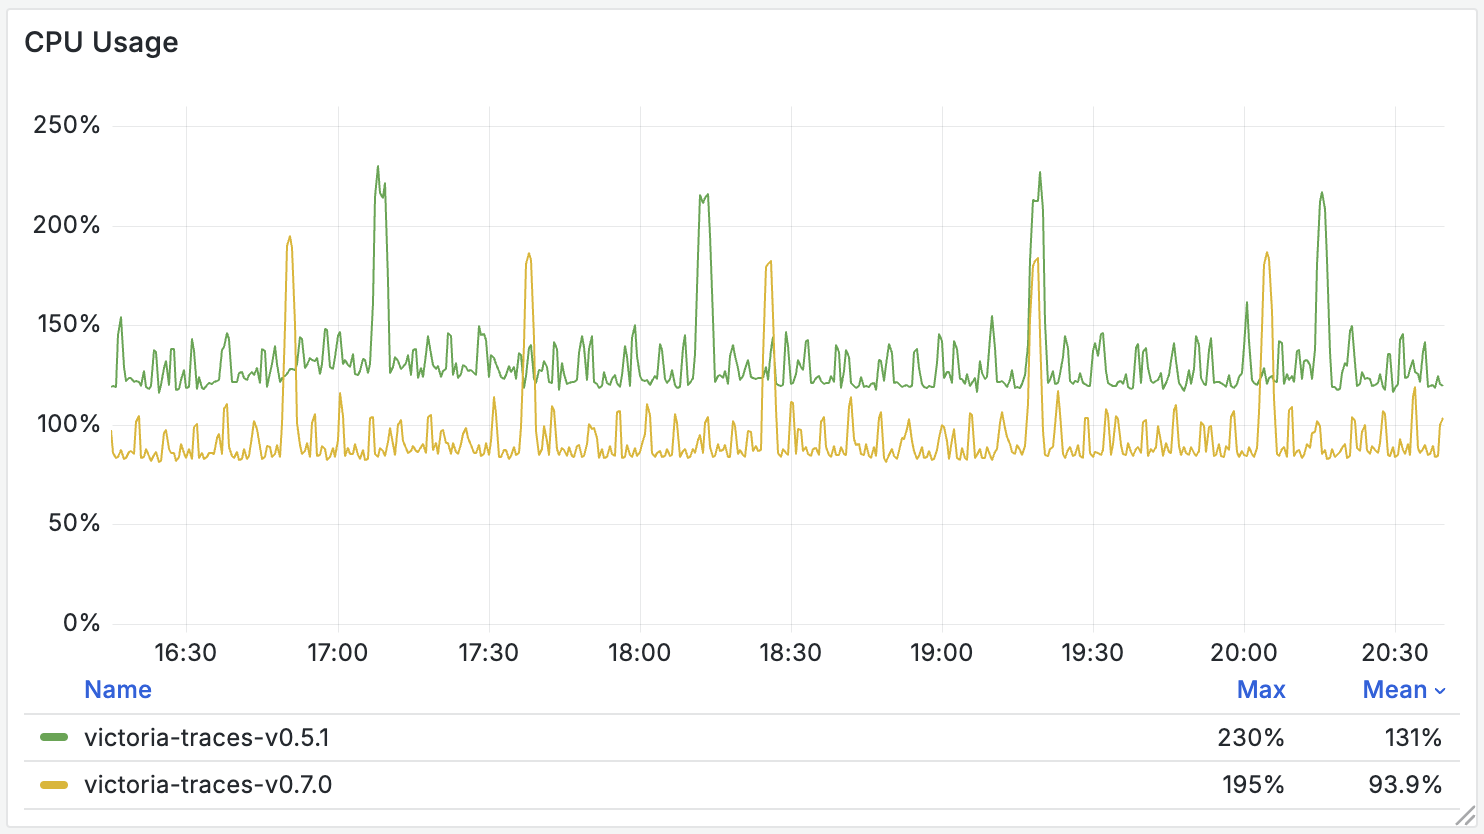
The v0.7.0 release adds health metrics for the service graph background task (vt_servicegraph_task_duration_seconds).
In addition, we have focused on providing performance optimizations over the last two versions:
- A 30% reduction in CPU usage (compared to v0.5.1 and prior versions).
- An enhanced TraceID index with improved accuracy, enabling faster trace ID lookup queries.
VictoriaMetrics Cloud — new capacity tiers, multi‑region support, and IaC management
#
The Cloud team shipped a lot in the last quarter of 2025. Here are the highlights:
- New Capacity Tiers for Single instances follow a linear progression in computing power and costs, giving more flexibility as you scale observability needs.
- AWS us-east-1 (N. Virginia) region now available with PrivateLink support and lower latency for observability data.
- Notification Groups let teams customize alerts by interest category at the organization or user level, reducing alert fatigue.
- Terraform provider enables Infrastructure as Code management of deployments, access tokens, rules, and regions without manual API calls.
- Nine new Alerting Rule integrations from Awesome Prometheus Alerts provide out-of-the-box rules for common failure scenarios.
- The data read rate metric shows scanning effort per time unit to help decide when upgrading tiers.
- VictoriaLogs coming to VictoriaMetrics Cloud during February 2026 with backups and tier definitions finalized.
Read the full blog post: What’s New in VictoriaMetrics Cloud Q4 2025? New tiers, more deployment options, IaC, and alerting rules.
VictoriaMetrics Kubernetes Operator updated to v0.67.0 — simplified setup and more options
#
Highlights of v0.67.0 through v0.66.0
- We simplified the PVC storage setup for vmsingle, vlsingle, and vtsingle.
- vlagent:
VLAgentnow supports daemonset mode to ingest Kubernetes logs on the nodes directly. - vlagent: collector supports additional options for flexible log collection setups.
- vmoperator: invalid objects are now measured in the
operator_bad_objects_totalmetric for all object types instead of the deprecatedoperator_alertmanager_bad_objects_countandoperator_vmalert_bad_objects_count. The deprecated metrics will be removed in the next release. - vmoperator: all cluster storage can now be scaled up with HPA.
- vmagent: a scrape target can now be limited to
sampleLimit.
What’s Next
#
For the full details on each release and its upgrade instructions, check the changelogs:
- VictoriaMetrics: 1.134.0, 1.133.0, 1.132.0, and 1.131.0.
- VictoriaLogs: 1.43.0, 1.42.0, 1.41.0, and 1.40.0.
- VictoriaTraces: 0.7.0.
- VictoriaMetrics Operator: 0.67.0, 0.66.1, and 0.66.0.
Across the VictoriaMetrics ecosystem, we continue working on performance improvements, better cloud-native integration, operational simplicity at scale, and reliability.
Thank you for using VictoriaMetrics — stay tuned for more updates.