

惯性聚合 高效追踪和阅读你感兴趣的博客、新闻、科技资讯
阅读原文 在惯性聚合中打开

推荐订阅源

T
Threatpost
IT之家
IT之家
Hugging Face - Blog
Hugging Face - Blog
Engineering at Meta
Engineering at Meta
爱范儿
爱范儿
博客园 - Franky
博客园 - 【当耐特】
MyScale Blog
MyScale Blog
雷峰网
雷峰网
月光博客
月光博客
云风的 BLOG
云风的 BLOG
博客园 - 司徒正美
CTFtime.org: upcoming CTF events
钛媒体:引领未来商业与生活新知
钛媒体:引领未来商业与生活新知
OSCHINA 社区最新新闻
OSCHINA 社区最新新闻
P
Proofpoint News Feed
The GitHub Blog
The GitHub Blog
N
Netflix TechBlog - Medium
WordPress大学
WordPress大学
罗磊的独立博客
Threat Intelligence Blog | Flashpoint
H
Hackread – Cybersecurity News, Data Breaches, AI and More
Y
Y Combinator Blog
Know Your Adversary
Know Your Adversary
宝玉的分享
宝玉的分享
L
Lohrmann on Cybersecurity
S
SegmentFault 最新的问题
L
LangChain Blog
K
Kaspersky official blog
P
Palo Alto Networks Blog
P
Privacy & Cybersecurity Law Blog
美团技术团队
Scott Helme
Scott Helme
B
Blog RSS Feed
T
Threat Research - Cisco Blogs
博客园_首页
L
LINUX DO - 热门话题
腾讯CDC
C
CERT Recently Published Vulnerability Notes
A
About on SuperTechFans
博客园 - 三生石上(FineUI控件)
J
Java Code Geeks
V
V2EX
Martin Fowler
Martin Fowler
T
The Exploit Database - CXSecurity.com
人人都是产品经理
人人都是产品经理
MongoDB | Blog
MongoDB | Blog
Latest news
Latest news
S
Schneier on Security
AWS News Blog
AWS News Blog

VictoriaMetrics: Simple & Reliable Monitoring for Everyone on VictoriaMetrics

Operator now has Long-Term Support (LTS) version Multi-tiered Observability: A Practical Way to Handle Diverse Workloads VictoriaMetrics April 2026 Ecosystem Updates Not All Telemetry Requires Premium Pricing VictoriaMetrics at KubeCon Amsterdam: Community Highlights What's new in VictoriaMetrics Anomaly Detection (Q1 2026) What's New in VictoriaMetrics Cloud Q1 2026? Logs, MCP Server, Better Alerting, and... a Secret Project VictoriaMetrics at KubeCon: Optimizing Tail Sampling in OpenTelemetry with Retroactive Sampling VictoriaMetrics March 2026 Ecosystem Updates Observability Lessons From OpenAI Benchmarking Kubernetes Log Collectors: vlagent, Vector, Fluent Bit, OpenTelemetry Collector, and more VictoriaMetrics February 2026 Ecosystem Updates VictoriaMetrics at FOSDEM, Cloud Native Days France, and CfgMgmtCamp Ghent VictoriaLogs in VictoriaMetrics Cloud: Fast, Cost-Effective Log Management is Here What’s new in VictoriaMetrics Anomaly Detection (2025) VictoriaMetrics January 2026 Ecosystem Updates VictoriaLogs Basics: What You Need to Know, with Examples & Visuals What's New in VictoriaMetrics Cloud Q4 2025? New tiers, more deployment options, IaC and alerting rules. Vibe coding tools observability with VictoriaMetrics Stack and OpenTelemetry How a US Software Provider Improved Traffic Alerting with VictoriaMetrics Anomaly Detection VictoriaMetrics 2025 Developer Experience: A Year in Review Spotify’s performance & control across large monitoring environments with VictoriaMetrics VictoriaMetrics Achieves Red Hat OpenShift Operator Certification Our latest updates across the VictoriaMetrics Observability ecosystem New Capacity Tiers in VictoriaMetrics Cloud Announcing 1B+ Downloads & Product Development With Logs, Traces, Metrics AI Agents Observability with OpenTelemetry and the VictoriaMetrics Stack Discarding gRPC-Go: The Story Behind OTLP/gRPC Support in VictoriaTraces What's New in VictoriaMetrics Cloud Q3 2025? From new region in Asia to proactive alerts How DreamHost Slashed Memory Usage by 80% and Scaled to 76 Million Time Series Upcoming Conferences & Meetups: Where to Meet Our Team VictoriaMetrics Long-Term Support (LTS): H2 2025 Update Creating a Sustainable Open Source Business Model - Introduction Full-Stack Observability with VictoriaMetrics in the OTel Demo Alerting Best Practices vmanomaly Deep Dive: Smarter Alerting with AI (Tech Talk Companion) VictoriaLogs Practical Ingestion Guide for Message, Time and Streams Monotonic and Wall Clock Time in the Go time package Hello Singapore! VictoriaMetrics Cloud Expands to Asia Pacific MCP Server Integration & Much More: What's New in VictoriaMetrics Cloud Q2 2025 FIPS 140-3 Compatible Builds for VictoriaMetrics Enterprise Components VictoriaLogs Unleashed: Cluster Version Now Available for Exceptional, Linear Scaling Integrations made easy with VictoriaMetrics Cloud Developer's Note: Research on Distributed Tracing, Comparing With Tempo and ClickHouse vmagent: Key Features Explained in Under 15 Minutes Go synctest: Solving Flaky Tests vmalert: Maximize Your Monitoring (Tech Talk Companion) Celebrating 14K Stars on GitHub: Spring Update vmalert: Maximize Your Monitoring VictoriaMetrics Connects with the Open Source Community at LinuxFest Northwest 2025 Graceful Shutdown in Go: Practical Patterns VictoriaLogs: Gaps, Gains & Growth Prometheus Monitoring: Functions, Subqueries, Operators, and Modifiers VictoriaMetrics Cloud: What's New in Q1 2025? Don’t default to microservices: You’ll thank us later! Container CPU Requests & Limits Explained with GOMAXPROCS Tuning gRPC in Go: Streaming RPCs, Interceptors, and Metadata From Chaos to Clarity with VictoriaLogs Prometheus Alerting 101: Rules, Recording Rules, and Alertmanager Heading to London: Meet Our Team at KubeCon Europe 2025 Inside vmselect: The Query Processing Engine of VictoriaMetrics Meet Our Team at Scale 22x Practical Protobuf - From Basic to Best Practices VictoriaLogs Status Update: Heading Towards the Cluster Version 24th of February 2025 Statement: VictoriaMetrics Stands with Ukraine! Prometheus Metrics Explained: Counters, Gauges, Histograms & Summaries Prometheus Monitoring: Instant Queries and Range Queries Explained 300%+ Growth in 2024: Join Our Team in 2025! FOSDEM 2025 recap How Protobuf Works—The Art of Data Encoding OpenTelemetry, Prometheus, and More: Which Is Better for Metrics Collection and Propagation? How vmstorage Handles Query Requests From vmselect How vmstorage's IndexDB Works VictoriaMetrics Tech Talk Stream: A Deep Dive into Blackbox Monitoring How HTTP/2 Works and How to Enable It in Go VictoriaMetrics Cloud: What's New in Q4 2024? How vmstorage Processes Data: Retention, Merging, Deduplication,... How vmstorage Handles Data Ingestion From vminsert When Metrics Meet vminsert: A Data-Delivery Story From net/rpc to gRPC in Go Applications Piros | VictoriaMetrics Partner Allenta | VictoriaMetrics Partner CloudRaft | VictoriaMetrics Partner Sensedia & VictoriaMetrics: API-compatible Efficient Storage Scalable Prometheus: Why DSV Chose VictoriaMetrics Sensor Factory | VictoriaMetrics Partner Erythix | VictoriaMetrics Partner Groove X & VictoriaMetrics: Faster Device Health Monitoring Scaled & Performant Monitoring at Spotify with VictoriaMetrics Grammarly & VictoriaMetrics: 10× Lower Costs & Direct Access Zelarsoft | VictoriaMetrics Partner DFKI & VictoriaMetrics: Efficient Long-Term Metric Storage Niubits | VictoriaMetrics Partner Megazone Cloud | VictoriaMetrics Partner Cogito Software | VictoriaMetrics Partner Bajau | VictoriaMetrics Partner Find Out Why Dig Security Chose VictoriaMetrics! Ness | VictoriaMetrics Partner Alpha Data | VictoriaMetrics Partner SIOS Technology | VictoriaMetrics Partner
Performance optimization techniques in time series databases: strings interning
Roman Khavronenko / Aliaksandr Valialkin · 2023-11-07 · via VictoriaMetrics: Simple & Reliable Monitoring for Everyone on VictoriaMetrics

This blog post is also available as a recorded talk with slides.

Table of Contents

Performance optimization techniques in time series databases:


VictoriaMetrics is an open-source time-series database (TSDB) written in Go, and I’ve had the pleasure of working on it for the past couple of years. TSDBs have stringent performance requirements, and building VictoriaMetrics has taught me a thing or two about optimization. In this blog post, I’ll share some of the performance tips I’ve learned during my time at VictoriaMetrics. You’ll get the most out of this post if you know a little Go, but you don’t need a background in TSDBs! The tips in this post should apply to any performance-sensitive application, and many of them apply beyond Go as well.

An intro to time-series databases

#

Before we can talk about optimizations for TSDBs, we need to take a look at what they are, and what problems they try to solve. In this section, we’ll cover some background on TSDBs in order to put the optimizations that we’ll later talk about into perspective.

Metrics

#

An example metric that you might store in a TSDB An example metric that you might store in a TSDB

In VictoriaMetrics, the data model is centered around the concept of a metric. A metric is an observation of some value at some point in time. The image above shows an example metric that collects information on a Go installation. Metrics consist of the following parts:

  • Name - The name of the metric describes what this metric measures.
  • Metadata - Information about the metric represented as label-value pairs.
  • Value - The observation itself.
  • Timestamp - The time the observation was recorded.

A combination of a metric name and its metadata defines a time series. In the real world, one could expect millions of unique time series to be processed and stored in a TSDB for a moderate load.

VictoriaMetrics provides a component vmagent, a metric collector. Metric collectors periodically collect time series from your services or other targets and forward them on to a TSDB. The collector visits a /metrics endpoint for each target to gather the metrics that the it exposes. For example, visiting http://service:port/metrics may yield the following time series:

go_gc_duration_seconds{quantile="0"} 7.3744e-05
go_gc_duration_seconds{quantile="0.25"} 0.000110502
go_gc_duration_seconds{quantile="0.5"} 0.000123689
go_gc_duration_seconds{quantile="0.75"} 0.00015938
go_gc_duration_seconds{quantile="1"} 0.004539404
go_goroutines 103
go_info{version="go1.16.4"} 1
go_memstats_alloc_bytes 1.0304216e+08
go_memstats_alloc_bytes_total 1.423416806112e+12

The above metrics are in “Prometheus exposition format”, a great, human-readable format popularized by Prometheus.

Workloads

#

Before optimizing an application, it’s critical to understand its workload. If you optimize for reads, but your application is write-heavy, then you won’t see a significant gain, and may even see a performance drop.

In the case of TSDBs, the workload is usually very write-heavy. It’s not uncommon for TSDBs to have to deal with millions of writes per second, while there are usually orders of magnitude fewer reads. Take a look at the following two graphs:
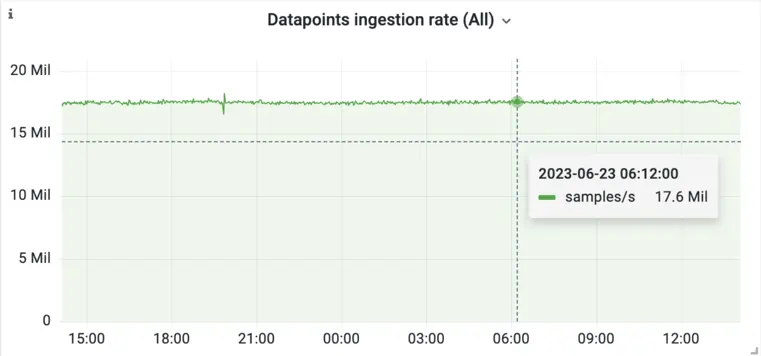
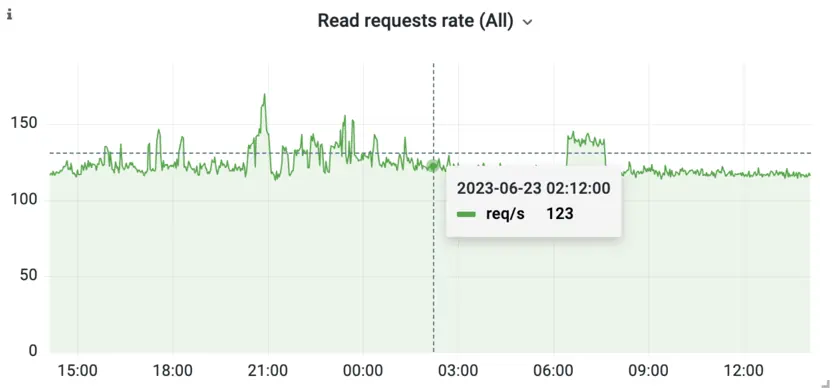
Comparison of write (left) and read (right) load one of VictoriaMetrics installations.

While 17 million ingested samples/s might seem like a lot, this example isn’t the biggest installation we have seen. Production applications generate a lot of data! The tremendous load that TSDBs see is a strong incentive to put work into optimization.

The other thing to notice in the above graphs is that reads are very unpredictable and sporadic. While writes represent consistent load generated by machines, reads may be triggered by humans which adds a degree of randomness to the load graph.

How can we build a system that is capable of dealing with this immense workload? The vast majority of the performance of a TSDB comes from its write-system design. VictoriaMetrics follows a few important principles in its design:

  • Log Structured Merge (LSM) data structure - LSMs are data structures that take into account the storage medium they are implemented on. They can help prevent write amplification, which could easily saturate even the fastest storage mediums.
  • Column-oriented storage - Storing each column of your data separately allows you to sort and compress your data separately, both of which enable optimizations that aren’t available with row-oriented storage.
  • Append-only writes - In general, the data that TSDBs store has already happened in time, and it’s likely that it will never change. For example, the weather forecast is unlikely to be updated in the past. This principle allows you to use data structures that are append-only. Append-only data structures trade flexibility for extra write speed.

System-level design is not something that most teams can apply when optimizing their applications. Chances are, you’re working on an existing codebase that isn’t a TSDB and so the above optimizations don’t really apply to you.

Don’t worry! In the rest of this article, you’ll find out about non-design-specific optimizations. These are things that you can apply to your codebase no matter its age or domain.

String interning

#

Metric metadata, consisting of the label-value pairs from earlier, is represented in VictoriaMetrics as a string. This gives users a lot of flexibility, as they can represent anything in metadata and introduce new labels and values whenever they like. In practice, however, metadata strings don’t change that often, creating a lot of repetition during collection.

Take, for example, the go_info metric from earlier. Its metadata had a Go version label-value pair. There are only so many potential Go versions, and it’s unlikely that the version of Go being used changes very often. But each time we collect this metric from our applications, we need to parse its metadata and allocate it in the memory until it is garbage-collected. Taking into account this metric could be exposed by not one, but by thousands of applications, the metrics collector will have to parse and allocate in memory same strings over and over!

To avoid storing the same string lots of times, what if we stored each unique string once and referred to it when we needed to? This is called string interning and it can save a significant chunk of memory:
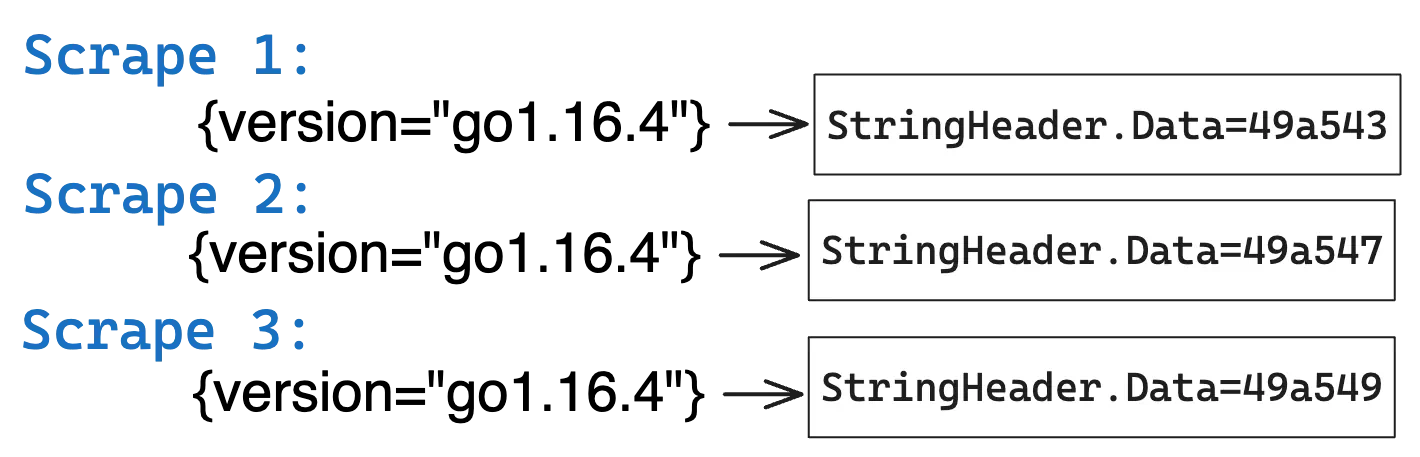
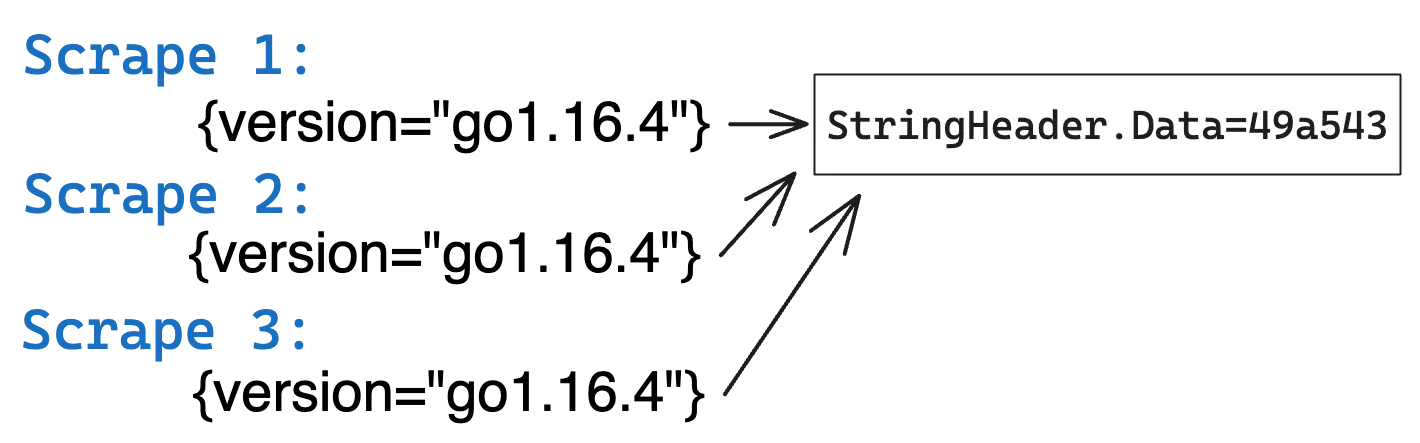
String interning being performed on the string ‘{version=”go1.16.4”}’.

In the above image, vmagent sees the same metadata string across multiple scrapes. In the left image, three copies of the same string are stored in memory, but in the right image only a single copy of the string is stored in memory. This allows saving memory by 3x.

The naive implementation of string interning uses a map, and it might look something like the code below:

var internStringsMap = make(map[string]string)

func intern(s string) string {
     m := internStringsMap
     if v, ok := m[s]; ok {
         return v
     }
     m[s] = s
     return s
}

This example works great for a single-threaded application, but vmagent has many threads that work across many targets concurrently. It’s possible to add a lock to the intern function, but that doesn’t scale nicely on multi-core systems as there is likely to be a lot of contention when accessing this map.

The solution to interning across multiple threads is to use sync.Map, a thread-safe implementation built into the Go standard library.

var internStringsMap  sync.Map

func intern(s string) string {
    m := &internStringsMap
    interned, _ := m.LoadOrStore(s, s)
    return interned.(string)
}

The best part is that sync.Map simplifies our original code! It comes with a LoadOrStore method that means we no longer need to check whether the string is already present in the map ourselves.

sync.Map is optimized for two use cases:

  • When a given key is only ever written once, but used many times, i.e., the cache has high hit ratio.
  • When multiple goroutines read, write and overwrite entries for disjoint sets of keys, i.e., each goroutine uses a different set of keys.

Whenever either of these two cases applies, sync.Map reduces lock contention and improves the performance of your application compared to if you’d used a regular Go map paired with a Mutex or RWMutex.

There are a couple of “gotchas” that you should be aware of when using sync.Map.

The map will grow over time

#

Unconstrained memory growth is dangerous. To prevent the map from growing infinitely, you need to either occasionally rotate the map by deleting it and recreating it, or implement some form of time to live (TTL) logic for your keys.

Sanity check the arguments to intern

#

The intern function performs really well when passing regular strings, but unless you lock down the interface, someone will eventually try to pass something that might break your function.

For example, in Go, byte slices are mutable. This means they could change at any time and are not suitable for use as a key in your map. This is usually a case of using “unsafe conversion to string”, a common optimization in Go. And, in the same time, the most common source of bugs.

Summary

#

In general, when implementing string interning, it’s a good idea to clone the strings that are passed to your function. This can help you get rid of some subtle bugs.

VictoriaMetrics uses string interning to reduce memory usage while parsing metric metadata. It’s a powerful technique that works best with read-intensive workloads that have few variants in the potential strings you see.

Stay tuned for the new blog post in this series!