




惯性聚合 高效追踪和阅读你感兴趣的博客、新闻、科技资讯
阅读原文 在惯性聚合中打开

推荐订阅源

Cyberwarzone
Cyberwarzone
Vercel News
Vercel News
freeCodeCamp Programming Tutorials: Python, JavaScript, Git & More
奇客Solidot–传递最新科技情报
奇客Solidot–传递最新科技情报
aimingoo的专栏
aimingoo的专栏
B
Blog RSS Feed
A
About on SuperTechFans
T
The Blog of Author Tim Ferriss
爱范儿
爱范儿
腾讯CDC
S
SegmentFault 最新的问题
Exploit-DB.com RSS Feed
The Hacker News
The Hacker News
J
Java Code Geeks
大猫的无限游戏
大猫的无限游戏
B
Blog
IT之家
IT之家
Spread Privacy
Spread Privacy
K
KPMG report finds enterprise disconnect between AI and its ROI | CIO
C
Cisco Blogs
Recent Announcements
H
Hacker News: Front Page
AI
AI
I
InfoQ
H
Heimdal Security Blog
T
Threatpost
Cisco Talos Blog
Cisco Talos Blog
Threat Intelligence Blog | Flashpoint
I
Intezer
W
WeLiveSecurity
SecWiki News
SecWiki News
MongoDB | Blog
MongoDB | Blog
宝玉的分享
宝玉的分享
博客园 - 【当耐特】
云风的 BLOG
云风的 BLOG
T
Threat Research - Cisco Blogs
V2EX - 技术
V2EX - 技术
N
News and Events Feed by Topic
cs.CV updates on arXiv.org
O
OpenAI News
阮一峰的网络日志
阮一峰的网络日志
T
Troy Hunt's Blog
www.infosecurity-magazine.com
博客园 - 司徒正美
Apple Machine Learning Research
雷峰网
雷峰网
T
Tor Project blog
有赞技术团队
有赞技术团队
Schneier on Security
Last Week in AI
Last Week in AI

VictoriaMetrics: Simple & Reliable Monitoring for Everyone on VictoriaMetrics

Operator now has Long-Term Support (LTS) version Multi-tiered Observability: A Practical Way to Handle Diverse Workloads VictoriaMetrics April 2026 Ecosystem Updates Not All Telemetry Requires Premium Pricing VictoriaMetrics at KubeCon Amsterdam: Community Highlights What's new in VictoriaMetrics Anomaly Detection (Q1 2026) What's New in VictoriaMetrics Cloud Q1 2026? Logs, MCP Server, Better Alerting, and... a Secret Project VictoriaMetrics at KubeCon: Optimizing Tail Sampling in OpenTelemetry with Retroactive Sampling VictoriaMetrics March 2026 Ecosystem Updates Observability Lessons From OpenAI Benchmarking Kubernetes Log Collectors: vlagent, Vector, Fluent Bit, OpenTelemetry Collector, and more VictoriaMetrics February 2026 Ecosystem Updates VictoriaMetrics at FOSDEM, Cloud Native Days France, and CfgMgmtCamp Ghent VictoriaLogs in VictoriaMetrics Cloud: Fast, Cost-Effective Log Management is Here What’s new in VictoriaMetrics Anomaly Detection (2025) VictoriaMetrics January 2026 Ecosystem Updates VictoriaLogs Basics: What You Need to Know, with Examples & Visuals What's New in VictoriaMetrics Cloud Q4 2025? New tiers, more deployment options, IaC and alerting rules. Vibe coding tools observability with VictoriaMetrics Stack and OpenTelemetry VictoriaMetrics 2025 Developer Experience: A Year in Review Spotify’s performance & control across large monitoring environments with VictoriaMetrics VictoriaMetrics Achieves Red Hat OpenShift Operator Certification Our latest updates across the VictoriaMetrics Observability ecosystem New Capacity Tiers in VictoriaMetrics Cloud Announcing 1B+ Downloads & Product Development With Logs, Traces, Metrics AI Agents Observability with OpenTelemetry and the VictoriaMetrics Stack Discarding gRPC-Go: The Story Behind OTLP/gRPC Support in VictoriaTraces What's New in VictoriaMetrics Cloud Q3 2025? From new region in Asia to proactive alerts How DreamHost Slashed Memory Usage by 80% and Scaled to 76 Million Time Series Upcoming Conferences & Meetups: Where to Meet Our Team VictoriaMetrics Long-Term Support (LTS): H2 2025 Update Creating a Sustainable Open Source Business Model - Introduction Full-Stack Observability with VictoriaMetrics in the OTel Demo Alerting Best Practices vmanomaly Deep Dive: Smarter Alerting with AI (Tech Talk Companion) VictoriaLogs Practical Ingestion Guide for Message, Time and Streams Monotonic and Wall Clock Time in the Go time package Hello Singapore! VictoriaMetrics Cloud Expands to Asia Pacific MCP Server Integration & Much More: What's New in VictoriaMetrics Cloud Q2 2025 FIPS 140-3 Compatible Builds for VictoriaMetrics Enterprise Components VictoriaLogs Unleashed: Cluster Version Now Available for Exceptional, Linear Scaling Integrations made easy with VictoriaMetrics Cloud Developer's Note: Research on Distributed Tracing, Comparing With Tempo and ClickHouse vmagent: Key Features Explained in Under 15 Minutes Go synctest: Solving Flaky Tests vmalert: Maximize Your Monitoring (Tech Talk Companion) Celebrating 14K Stars on GitHub: Spring Update vmalert: Maximize Your Monitoring VictoriaMetrics Connects with the Open Source Community at LinuxFest Northwest 2025 Graceful Shutdown in Go: Practical Patterns VictoriaLogs: Gaps, Gains & Growth Prometheus Monitoring: Functions, Subqueries, Operators, and Modifiers VictoriaMetrics Cloud: What's New in Q1 2025? Don’t default to microservices: You’ll thank us later! Container CPU Requests & Limits Explained with GOMAXPROCS Tuning gRPC in Go: Streaming RPCs, Interceptors, and Metadata From Chaos to Clarity with VictoriaLogs Prometheus Alerting 101: Rules, Recording Rules, and Alertmanager Heading to London: Meet Our Team at KubeCon Europe 2025 Inside vmselect: The Query Processing Engine of VictoriaMetrics Meet Our Team at Scale 22x Practical Protobuf - From Basic to Best Practices VictoriaLogs Status Update: Heading Towards the Cluster Version 24th of February 2025 Statement: VictoriaMetrics Stands with Ukraine! Prometheus Metrics Explained: Counters, Gauges, Histograms & Summaries Prometheus Monitoring: Instant Queries and Range Queries Explained 300%+ Growth in 2024: Join Our Team in 2025! FOSDEM 2025 recap How Protobuf Works—The Art of Data Encoding OpenTelemetry, Prometheus, and More: Which Is Better for Metrics Collection and Propagation? How vmstorage Handles Query Requests From vmselect How vmstorage's IndexDB Works VictoriaMetrics Tech Talk Stream: A Deep Dive into Blackbox Monitoring How HTTP/2 Works and How to Enable It in Go VictoriaMetrics Cloud: What's New in Q4 2024? How vmstorage Processes Data: Retention, Merging, Deduplication,... How vmstorage Handles Data Ingestion From vminsert When Metrics Meet vminsert: A Data-Delivery Story From net/rpc to gRPC in Go Applications VictoriaMetrics helps IHI Terrasun Win Big in Vegas on $1.2B Clean Energy Project Piros | VictoriaMetrics Partner Allenta | VictoriaMetrics Partner CloudRaft | VictoriaMetrics Partner Sensedia & VictoriaMetrics: API-compatible Efficient Storage Scalable Prometheus: Why DSV Chose VictoriaMetrics Sensor Factory | VictoriaMetrics Partner Erythix | VictoriaMetrics Partner Groove X & VictoriaMetrics: Faster Device Health Monitoring Scaled & Performant Monitoring at Spotify with VictoriaMetrics Grammarly & VictoriaMetrics: 10× Lower Costs & Direct Access Zelarsoft | VictoriaMetrics Partner DFKI & VictoriaMetrics: Efficient Long-Term Metric Storage Niubits | VictoriaMetrics Partner Megazone Cloud | VictoriaMetrics Partner Cogito Software | VictoriaMetrics Partner Bajau | VictoriaMetrics Partner Find Out Why Dig Security Chose VictoriaMetrics! Ness | VictoriaMetrics Partner Alpha Data | VictoriaMetrics Partner SIOS Technology | VictoriaMetrics Partner
How a US Software Provider Improved Traffic Alerting with VictoriaMetrics Anomaly Detection
Fred Navruzov · 2025-12-24 · via VictoriaMetrics: Simple & Reliable Monitoring for Everyone on VictoriaMetrics

Modern infrastructure teams face a common challenge: Traffic patterns that are highly variable, seasonal, and difficult to predict - especially when managing mature products that no longer receive active development. Traditional threshold-based alerting often fails in these environments, producing either blind spots or excessive noise.

Here we share anonymized feedback from one of our enterprise customers, who uses VictoriaMetrics Anomaly Detection (vmanomaly) to monitor traffic across multiple domains. At the customer’s request, identifying details have been omitted. The feedback highlights how fine-tuned anomaly detection helped reduce alert fatigue while improving confidence in incident detection.

Customer Background

#

“I am the Director of IT at an American-based company that provides software and services to personal computer original equipment manufacturers (PC OEMs). We have a number of domains that receive traffic for an established product, which no longer sees active development.”

The customer operates several domains with organic traffic patterns that vary significantly by volume and shape.

The Challenge: Variable Traffic and Alert Fatigue

#

Traffic varies by volume and patterns across domains, which further complicates the effort.

“We don’t want to pay for someone to watch graphs all day, and due to the organic nature of traffic - daily and weekly seasonality and variability across domains - setting static thresholds is a non-starter.”

Previous systems generated frequent false positives. Over time, this resulted in operational noise and declining trust in monitoring signals.

“Automated machine learning solutions from other vendors have just produced noise for us in the past. All this led to, was alert fatigue and decreased confidence in any alerts.”

Why VictoriaMetrics Anomaly Detection

#

The customer adopted VictoriaMetrics Anomaly Detection, using it as a dedicated system for detecting meaningful deviations rather than enforcing rigid thresholds.

“Being able to have a system reliably alert us that there is an actual anomaly with a traffic spike or drop is invaluable, as it frees my team up for other work.”

A key differentiator was the ability to fine-tune models using domain-specific knowledge to accurately reflect different traffic behaviors across domains, including configuring detection direction (spikes versus drops) and previewing alerting rule execution to ensure anomalies must persist before triggering alerts, rather than reacting to transient single-point deviations.

““With VictoriaMetrics Anomaly Detection, we are looking at using different models to match the different patterns.”

Model Tuning, Backtesting, and Visualization

#

After the initial configuration was in place, the team began evaluating the models against known historical anomalies used as ground truth.

“Once we have a model in a good spot, it is pretty simple to run it in backtesting mode and compare the anomalies detected against known historical ones to assess overall quality. Also, with recent updates to the vmanomaly UI, it is even easier to visualize where the models are too tight or too loose and adjust accordingly.”

As part of the onboarding process, we worked together to refine the existing model configuration and align it more closely with the expectations on anomaly profiles and traffic patterns.

“One session with the VictoriaMetrics Anomaly Detection Team and we massively improved the existing model, and then added a whole new model to monitor a less extreme pattern.”

Real-World Incident Detected

#

Cloudflare Incident - Request Drop

#

Cloudflare faced an outage that directly impacted dependent services, resulting in a noticeable off-season drop in request volume for affected customers.
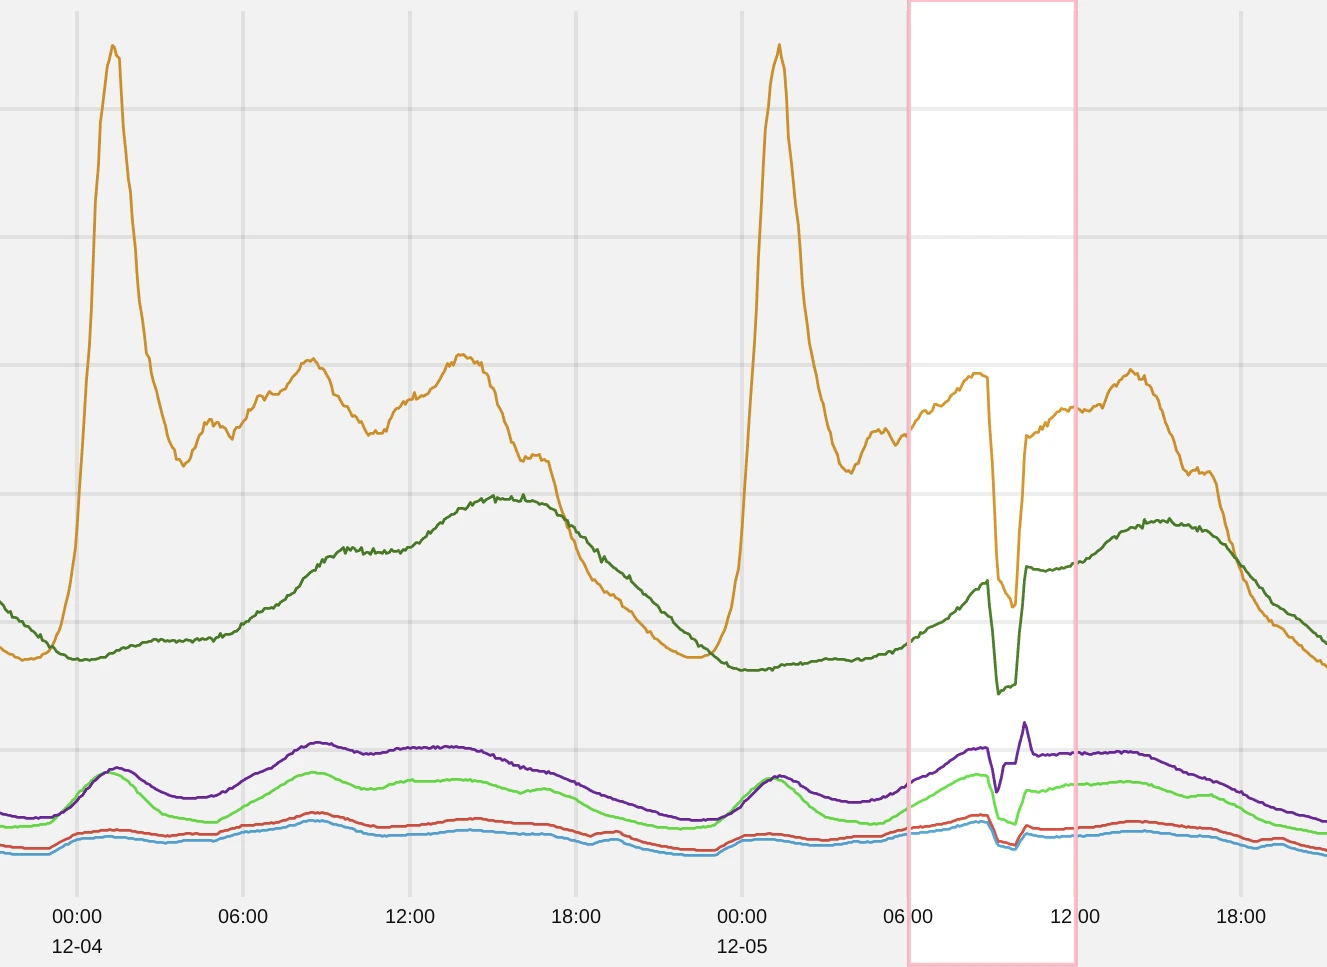
Cloudflare outage leading to request drop Cloudflare outage leading to request drop

Example of detected anomalies during Cloudflare outage Example of detected anomalies during Cloudflare outage

Detected anomalies are shown as red markers, with an issue required to persist as “drop” for at least 30 minutes before being classified as an anomaly (so-called “streak")

New Version Release - Traffic Spike

#

Increased request volume following a new product release has affected connected applications and was detected as a controlled anomaly.
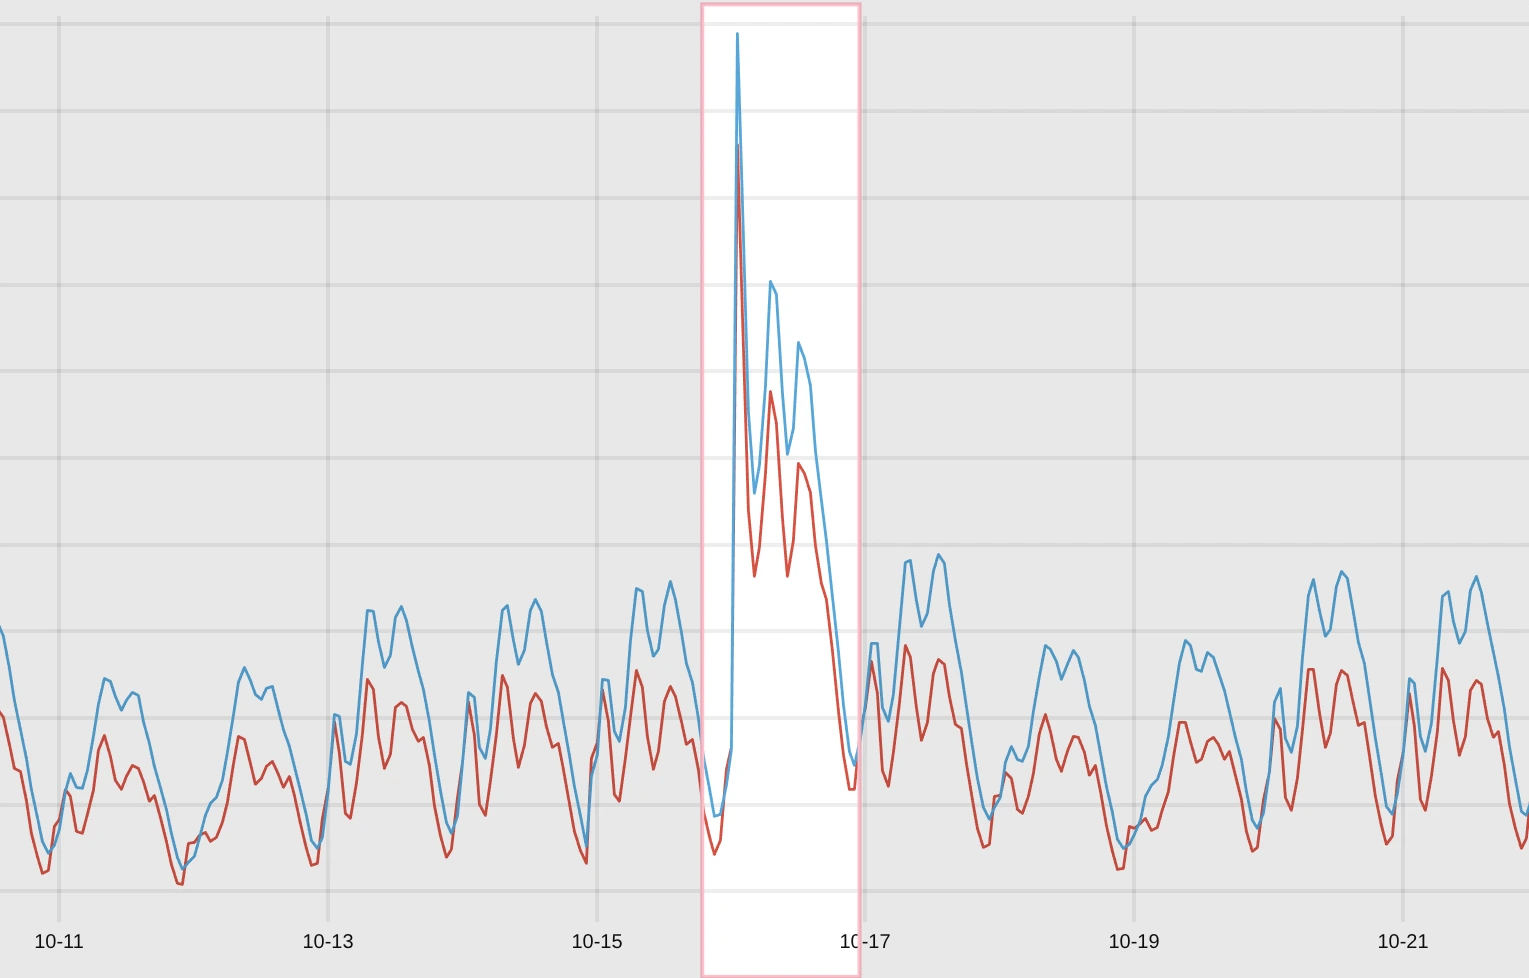
Traffic spike following new product release Traffic spike following new product release

Example of detected anomalies during new product release Example of detected anomalies during new product release

Detected anomalies are shown as red markers, with an issue required to persist as “spike” for at least 60 minutes before being classified as an anomaly (so-called “streak").

The Impact

#

As a result of deploying VictoriaMetrics Anomaly Detection, the customer reports improvements across several Key Performance Indicators (KPIs):

  • Reduction in false positives requiring investigation, decreasing wasted engineering time.
  • Higher confidence that real anomalies are not being missed, even across diverse traffic patterns.
  • Reduced engineering effort to configure and maintain anomaly detection and alerting, due to a unified nature of produced anomaly score metrics.

Conclusion

#

This use case demonstrates how purpose-built anomaly detection - combined with flexible modeling, backtesting, and visualization - can replace brittle manual thresholding. For teams managing variable, organic traffic across multiple domains, VictoriaMetrics Anomaly Detection provides a practical and scalable path to reliable alerting without constant manual oversight.

I am Fred Navruzov and have previously worked as a Data Science Lead at Ukrainian and international companies such as Competera, Rozetka, and TiltingPoint. Since 2023, I have been leading the Anomaly Detection team at VictoriaMetrics.