When a server feels slow, the GUI is rarely an option. You’re SSH’d into a box that’s pegging a CPU or eating swap, and you have about 90 seconds to figure out which process to blame before someone in Slack asks for an update. The six commands in this post are what I run, in roughly this order, every time that happens.
I’ve been on the on-call rotation for four years across three companies. None of these commands are clever. They’re the boring, well-installed tools that show up on every server you’ll ever touch, and they’re the difference between an outage that ends in 10 minutes and one that ends in two hours.
If you haven’t read the top 10 Linux commands, start there. This post assumes you can SSH into a box and read a man page.
htop: the interactive task manager
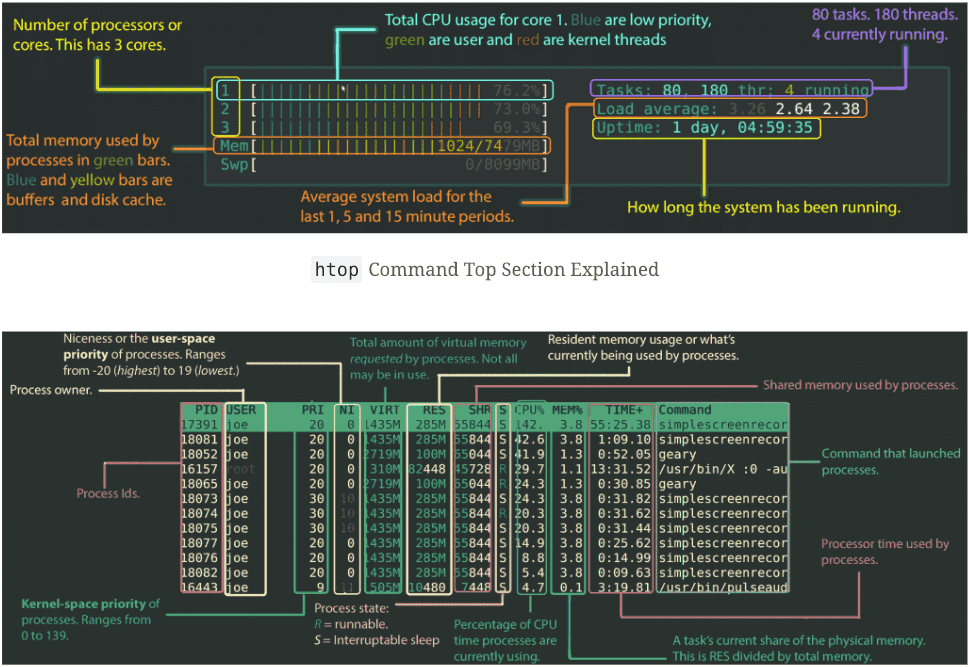
htop is the first command I run on a slow box. Think of it as Activity Monitor for the terminal: a live, sorted view of every running process with CPU and RAM bars at the top.
# Install on Ubuntu/Debian
sudo apt install htop

# Install on Fedora/RHEL/CentOS
sudo dnf install htop

# Install on macOS
brew install htop

# Run it
htop
The interface is mostly self-explanatory: F1 for help, F5 toggles tree view (so you can see which child processes belong to which parent), F6 changes the sort column, F9 sends a signal to the highlighted process. F10 quits.
The bar colours mean different things. On the CPU bars: blue is low-priority processes (niced), green is normal user processes, red is kernel time, orange is IRQ. On memory: green is used pages, blue is buffers, yellow is cache. The visual breakdown alone tells you a lot about why a box feels slow before you even look at the process list. The original Codeahoy htop walkthrough goes deeper if you want a colour-by-colour tour.
If htop isn’t available (some minimal containers, hardened production boxes), fall back to top. Otherwise, htop is the better default in every way. The newer fork worth knowing about is btop, which has prettier graphs and a click-friendly UI; I keep it on my workstation but stick with htop on servers because it’s older, more stable, and packaged everywhere.
top: the htop fallback that’s installed everywhere
top is the original. Less colourful, less interactive, but it’s on literally every Unix box ever made, which is why I keep it in muscle memory.
# Run it
top

# Show only processes for user 'nick'
top -u nick

# Update every 1 second instead of the default 3
top -d 1

# Run for one snapshot, then exit (good for piping)
top -bn1
The shortcut keys inside top are worth knowing because they let you re-sort on the fly:
| Key | What it does |
|---|---|
h | Help |
q | Quit |
M | Sort by memory usage |
P | Sort by CPU usage |
R | Reverse sort order |
k | Kill a process by PID |
r | Renice (change priority) |
c | Toggle full command path |
1 | Toggle per-CPU breakdown |
W | Save current config to ~/.toprc |
That 1 shortcut is the one most people miss. By default top shows aggregate CPU usage across all cores; press 1 and you get per-core stats, which is how you spot a single-threaded process saturating one core while the rest sit idle.
htop -bn1 (or top -bn1) in a script is also a clean way to get a one-shot snapshot for logging or alerts. It runs once, prints, and exits cleanly.
ps: snapshot of every running process
Where top is a live view, ps is a single-frame snapshot. I use ps when I want a list I can pipe into grep or awk, not when I want to watch it change. The classic incantation is ps aux (BSD-style) or ps -ef (System V style); both list every process on the system.
# All processes, BSD format
ps aux

# All processes, System V format with full command line
ps -ef

# Just my processes
ps -x

# Processes owned by user 'root'
ps -u root

# Processes in a specific group
ps -fG www-data

# Tree view: parent-child relationships
ps -ef --forest

# Tree view filtered to nginx and its children
ps -f --forest -C nginx

# Find a specific process by name
ps -ef | grep -i nginx | grep -v grep
The grep -v grep at the end of that last line is to filter out the grep command itself (which matches its own pattern, because it’s a process containing the word “nginx” while it runs). The cleaner alternative is pgrep nginx, which only returns matching PIDs.
A pattern I run weekly: find the top 5 memory-hungry processes on a box.
ps aux --sort=-%mem | head -6The first row is the header; the next 5 are the offenders. Same trick with --sort=-%cpu for CPU. When a server is OOM’ing and I need to know what to kill, this is the first command I run.
free: how much memory is actually free
free reports memory and swap usage. On modern Linux, the output is more nuanced than people realise, because Linux aggressively caches files in RAM (as it should, since unused RAM is wasted RAM).
# Default output (KB)
free

# Human-readable (the only way I run it)
free -h

# Megabytes
free -m

# Gigabytes
free -g

# Repeat every 5 seconds
free -h -s 5

# Total memory only
free -h -t
When you run free -h, you see something like this:
              total        used        free      shared  buff/cache   available
Mem:           15Gi       4.2Gi       0.5Gi       142Mi        10Gi        10Gi
Swap:         2.0Gi       100Mi       1.9Gi
The line that matters is available, not free. free shows truly unused RAM, but Linux gives most of what’s “free” to the disk cache. available is the kernel’s estimate of how much memory a new process could realistically use, and that’s the number you compare against your application’s footprint.
If available is approaching zero AND swap is filling up, you’re in OOM territory. Otherwise, large buff/cache numbers are healthy, not a problem.
df and du: disk usage from two angles
df (disk filesystem) shows mounted filesystems and how full each is. du (disk usage) shows how much space individual files or directories take up. You almost always want both.
# Filesystem usage, human-readable
df -h

# Include all mounts, even pseudo filesystems
df -ah

# Show filesystem types
df -hT

# Drill into where the space is going on a specific path
du -sh /var/log/*

# Top 10 largest items in the current directory
du -h --max-depth=1 . | sort -hr | head -10

# Find the largest single files in /var
sudo du -ah /var | sort -hr | head -20
The du -h --max-depth=1 . | sort -hr | head -10 chain is the one I use most. It tells you which subdirectories under your current path are eating disk, sorted descending. Run it from /, then cd into the biggest offender, run it again. Three or four iterations and you’ve found the rogue log file or runaway Docker volume.
ncdu is a TUI alternative I install on every server I admin long-term: sudo apt install ncdu, then ncdu / runs an interactive tree view you can navigate. It’s du with a UI, and it’s wonderful for the “what is eating my disk” question.
nethogs: which process is eating my bandwidth
nethogs is the equivalent of htop for network bandwidth: it shows real-time per-process upload and download rates. If a server is mysteriously hitting its network cap, nethogs is the first place I look.
# Install
sudo apt install nethogs    # Debian/Ubuntu
sudo dnf install nethogs    # Fedora/RHEL
brew install nethogs        # macOS

# Run on default interface (needs root because it reads raw packet data)
sudo nethogs

# Specific interface (find your interface with `ip addr` or `ifconfig`)
sudo nethogs eth0

# Update every 4 seconds instead of the default 1
sudo nethogs -d 4

# Multiple interfaces
sudo nethogs eth0 wlan0
The output shows process name, PID, user, sent KB/s, received KB/s. If something on the box is exfiltrating data or a container is hammering an external API, this is how you spot it. I once tracked down a misconfigured CI runner that was downloading a 4GB Docker image every 10 minutes purely because of the line nethogs showed me.
If you need historical bandwidth data instead of real-time, vnstat keeps a rolling per-day/per-hour record. They complement each other: nethogs for “what’s happening right now”, vnstat for “what happened overnight”.
How these commands fit my actual on-call workflow
These six aren’t separate tools so much as steps in one routine. When a server alerts, I run them in this order:
# 1. Quick visual: where's the pain?
htop

# 2. Memory specifically (sometimes htop's bar lies about cache)
free -h

# 3. Disk before I dig further
df -h

# 4. If it's a network issue
sudo nethogs

# 5. If it's a specific process I want to capture
ps aux --sort=-%mem | head -10
The whole loop takes 90 seconds and identifies the broken thing in 80% of cases. The remaining 20% need iotop (disk I/O), iftop (network connections), or whatever application-specific tool the failing service ships with.
If a single box keeps appearing in alerts, that’s where you graduate to a real monitoring stack. I covered that in the Raspberry Pi temperature monitoring with Grafana post, where the same Prometheus + Grafana setup scales from a Pi to a fleet of servers. For when you can’t even reach the box, the SSH tunnel over sshuttle post covers how I get back in past restrictive networks.
Frequently asked questions
Why does free show almost no free memory even when nothing’s running?
Linux uses spare RAM as disk cache to make repeated file reads faster. The cached pages can be reclaimed instantly when an application needs them, so they don’t actually count as “in use” from the application’s point of view. The number to watch is available, not free. If available is healthy, you have memory to spare even if free says otherwise.
Should I use top or htop?
htop if it’s installed and you’re working interactively. It’s easier to read, easier to navigate, and the keybinds are discoverable via F1. top if you’re on a minimal container or a hardened production box where you can’t install packages, or in scripts that need a one-shot snapshot (top -bn1). Both are useful; htop is the default for humans.
How do I monitor disk I/O, not just disk usage?
du and df tell you how much disk is used; they don’t tell you how busy the disk is. For that, install iotop (sudo apt install iotop, run with sudo iotop). It shows per-process read/write rates the same way htop shows CPU. iostat -x 2 from the sysstat package gives time-series stats per device, which is closer to what you’d graph in a real monitoring tool.
What’s the fastest way to find a memory leak?
Run ps aux --sort=-%mem | head -10 once now, again in 15 minutes, and compare. A genuine leak shows up as a steadily climbing RSS value for the same PID. If RSS is high but stable, that’s expected memory consumption, not a leak. For more detail, pmap <PID> shows a breakdown of where in memory a process is allocated, and valgrind (or your language’s profiler) finds the leak inside the application code.
Why does nethogs need root?
It reads raw packet data from the network interface, which requires CAP_NET_ADMIN and CAP_NET_RAW Linux capabilities. Most distributions reserve these for root. You can grant the binary these capabilities with setcap if you want a non-root user to run it, but for ad-hoc debugging, sudo nethogs is the path of least resistance.
If alerts on a single box are firing more than once a week, the next post worth your time is the Pi temperature monitoring with Grafana one — same Prometheus + Grafana stack, just pointed at production.
Last updated: November 2024