





Published · 8 min read
The most fun telemetry problems I've seen usually start with an incident where we could not see enough, so we added the missing field after the postmortem. Then that just-in-case feeling kicked in and we added the neighbouring fields too, because nobody wanted the mirror to go dark the next time. The decision was reasonable at the time, which is what makes the mess harder to catch.
After enough incidents you start carrying every scar with you: debug logs from old failures, labels added for one investigation, dashboards built during a rollout, alerts created after one bad night. Nobody who added any of it thought they were creating an observability problem, they thought they were just polishing the mirror for the next oncall engineer.
Then the bill rises, queries slow down, dashboards contradict each other, and security finds customer identifiers in places they should never have reached. Eventually you clean up a few fields, reduce retention, delete the stale dashboards, and sample more aggressively. That becomes the pattern: sin, repent, repeat.
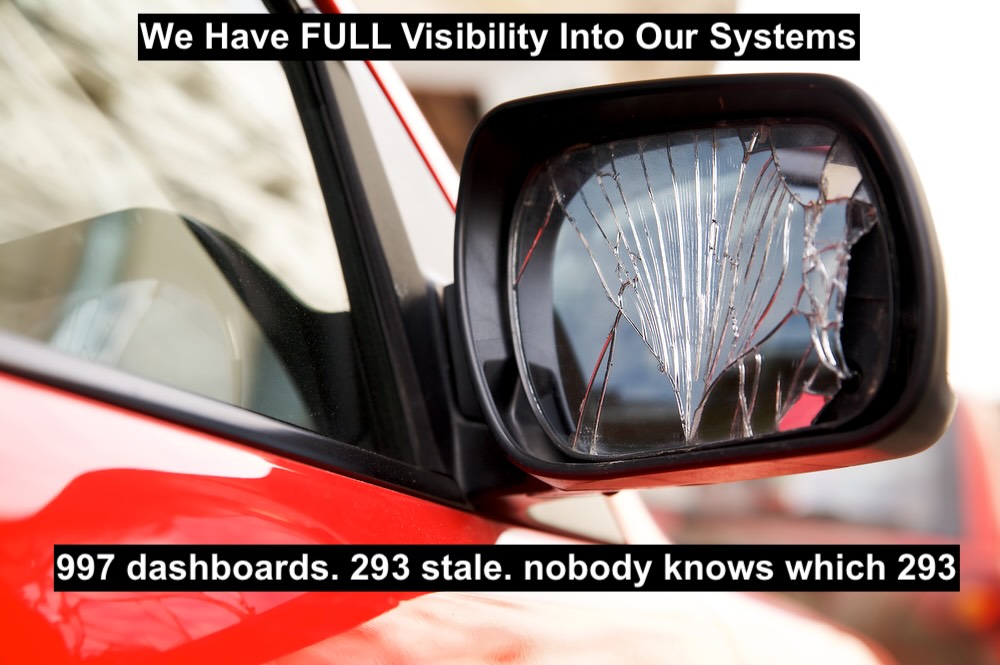 Broken Image Observability
Telemetry often begins as exhaust. Logs, metrics, traces, profiles, events, and audit records come out the side of the application.
A database schema, an API contract, a queue, a cache, or a new external dependency will usually get reviewed, and security-sensitive product data gets some kind of review too. Telemetry changes often slide through as implementation detail.
In production, telemetry consumes CPU, memory, network, and disk. It draws engineering attention, security review time, and budget. It can get heavy enough to interfere with the workload it is supposed to reflect.
An application container gets sized for business logic, then an agent, sidecar, collector, logger, or profiler joins the party. Maybe the overhead is tiny per pod but it can get enormous across a fleet. Exhaust vents away and disappears. A mirror stays inside and shapes what you see.
A telemetry bill tells you what your architecture hid under the rug. It exposes the mess that looked harmless while it was spread across services: too many clever components, too many retries, health checks, labels, and debug logs quietly multiplying in the background. Nobody feels the damage at the point of creation because the feedback loop sits way down.
A developer adds a field today, the reviewer sees useful context, the platform team sees an ingestion spike later, finance sees the invoice after that, and security finds the accidental data exposure during a review months later. When you get there, maybe the developer moved teams. Perhaps, service ownership changed.
Hence, that local decision became a global cost. The person creating the work is not the person paying the queueing cost, and the person who understands the risk may not have the authority to block it. The invoice is the only mirror that never lies.
The most common technical explanation of telemetry cost is cardinality. In a time series database, a metric becomes the combination of its name and its labels. Every unique label set creates a distinct time series.
This is fine when the labels are bounded: service, env, region, status_code, route_template, team, zone. These labels describe stable operational dimensions. They let you group, filter, alert, and compare without creating an unbounded mess.
Then a team adds user_id to a metric to track down a hot partition issue. Three weeks later, the platform team sees active series explode, the team's manager is told they got a huge bill, and security realizes customer identifiers are now part of metric storage.
The storage layer sees the cross-product of every possible value. That is where engineering intent, database physics, vendor pricing, and ownership gaps collide.
Metrics usually explode through cardinality. Logs usually explode through fear. That fear is rational. Missing one log line during an incident can waste hours. So teams learn the easy lesson and add more logs.
Logging without a questionioning leaves us with log dumps. A good log explains a state transition, a boundary crossing, a decision, a rejection, a fallback, or a failure. Compliance makes this worse when retention and indexing get treated as the same decision. Maybe you need to keep audit records for ninety days. That does not mean every debug line belongs in a hot searchable index for ninety days.
Most telemetry cost discussions start with volume: gigabytes per day, spans per second, active series, indexed logs, retention days, cardinality, query load. I'm all for tracking metrics but they are not the real unit.
The real unit of telemetry is a decision. What decision does this signal support? Does this metric drive an alert? Does this log explain a state transition? Does this trace help diagnose a customer-visible path? Does this audit record satisfy a compliance need? Does this field help security investigate abuse? Does this dashboard influence a rollout decision? Does this attribute help compare normal and abnormal system behaviour?
Take two Spark signals. The first is spark_job_task_failures_total, labelled by failure_type, stage, and application. It results in an alert. When it spikes, the oncall engineer can tell whether jobs are dying from OOM errors, shuffle fetch failures, executor loss, or timeouts. It changes the next move, so it earns its place.
The second is an executor heartbeat metric loaded with executor_id, application_name, user_id, and a generated run identifier, added on the fly for deeper visibility. Fair enough. Nobody was being stupid. Nonetheless, this metric has no alert, no runbook, and one abandoned dashboard. The series count keeps multiplying across every executor, user, application, and run.
This is why I think teams forget YAGNI entirely when it comes to telemetry. The difference is that forgetting it in code produces technical debt, while forgetting it in telemetry produces an increase on the bill way down the line.
Tooling is the easy argument because it feels technical. Datadog or Grafana. SaaS or self-hosted. OpenTelemetry or vendor agents. But tools do not answer the harder question: when should we add telemetry and who is allowed to say no?
Who approves an unbounded label? Who decides whether customer_id belongs in a metric, a trace attribute, a structured log, or nowhere at all? Who can force debug logs to expire after seven days? Who owns a dashboard after the incident that created it?
That is the political work. Without it, the mirror keeps reflecting everything, whether or not anyone still needs to see it.
A new metric dimension should feel closer to a database migration than a logging tweak. That does not mean the platform team reviews every metric pull request. That would create the wrong incentives. Teams either avoid useful telemetry because the process feels heavy, or someone starts rubber-stamping approvals just to keep work moving. That gives you the worst version of governance: slower delivery, fake approval, and still no real ownership.
The scalable version is guardrails. Give teams standard libraries, approved dimensions, and boring defaults: service, env, region, team, zone, status_code, route_template. Then block the garbage at the edge. CI rejects user_id, session_id, trace_id, container IDs, and generated run IDs. The collector strips unsafe attributes. The gateway drops health checks, debug noise, and low-value junk before it gets to the vendor. Human review is still needed for things like a new global dimension, a sensitive identifier, a new exporter, a longer retention class, and so forth.
Retention needs the same discipline. Every signal should be born with a life expectancy. Alert-driving metrics have longer retention. Diagnostic signals get a shorter hot window. Debug signals expire fast. Anything unclassified is short-lived by default. If a metric does not support an alert, dashboard, runbook, SLO, rollout check, compliance workflow, or security investigation, it should not live forever.
The platform team owns the paved road, the denylist, the collector rules, the exception process, and the budget boundaries. Service teams own the signals they emit and the decisions those signals support.
A useless signal is easy to block at the collector. After six months, though, it has a dashboard, a half-dead alert, and one scary incident story everyone uses to protect it. Bad telemetry does not stay harmless for long. Soon, people treat it like something that must exist.
No telemetry is honest blindness. Bad telemetry is worse. It gives people something to trust while quietly training the organization to make decisions from noise. That is the part we underprice. The mirror is not outside the machine. It changes how the machine behaves.
此内容由惯性聚合(RSS阅读器)自动聚合整理,仅供阅读参考。 原文来自 — 版权归原作者所有。