








Go comes with great tools for profiling out of the box. It’s one of the features I’ve come to love. I’m not going to go into detail about pprof, but if you need a primer, Julia Evans has a great post about it on her blog. Instead, I’ll try and show a real world example of the optimizations you can make using pprof. I’ll use pprof on mouthful, a gin based server, to see what I could do to make it just a bit faster. It turns out I can detect a rather stupid mistake I’ve made.
First, we’ll need to enable profiling on gin. This can be achieved by using a middleware. Luckily, there are a few open source middlewares we can choose so that we don’t have to do it ourselves. I’ll use gin-contrib/pprof. To install it
go get github.com/gin-contrib/pprof
Once that is done, we’ll just need to register our router with the middleware. In case of mouthful, we’ll do that by changing the ./api/server.go file. In there, we’ll register the pprof middleware just after creating our router. So the line
// ...
r := gin.New()
// ...
Becomes
// ...
r := gin.New()
pprof.Register(r, &pprof.Options{RoutePrefix: "debug/pprof"})
// ...
What this does, is expose a set of endpoints on the mouthful server and enable profiling. The endpoints will have the path prefix specified by the RoutePrefix in the Options struct. In our case, assuming the default port for mouthful is left in tact, it means that there’s a bunch of endpoints sitting under http://localhost:8080/debug/pprof. Under debug mode, gin will print those endpoints like so:
[GIN-debug] GET    /debug/pprof/block        --> github.com/vkuznecovas/mouthful/vendor/github.com/gin-contrib/pprof.pprofHandler.func1 (3 handlers)
[GIN-debug] GET    /debug/pprof/heap         --> github.com/vkuznecovas/mouthful/vendor/github.com/gin-contrib/pprof.pprofHandler.func1 (3 handlers)
[GIN-debug] GET    /debug/pprof/profile      --> github.com/vkuznecovas/mouthful/vendor/github.com/gin-contrib/pprof.pprofHandler.func1 (3 handlers)
[GIN-debug] POST   /debug/pprof/symbol       --> github.com/vkuznecovas/mouthful/vendor/github.com/gin-contrib/pprof.pprofHandler.func1 (3 handlers)
[GIN-debug] GET    /debug/pprof/symbol       --> github.com/vkuznecovas/mouthful/vendor/github.com/gin-contrib/pprof.pprofHandler.func1 (3 handlers)
[GIN-debug] GET    /debug/pprof/trace        --> github.com/vkuznecovas/mouthful/vendor/github.com/gin-contrib/pprof.pprofHandler.func1 (3 handlers)
For more information about each of these, refer to Julia’s post. I’m interested in CPU usage, so for this demo, we’ll stick with the /debug/pprof/profile.
To generate a report, all we need to do is run the mouthful instance and start gathering samples with pprof by running this command
go tool pprof http://localhost:8080/debug/pprof/profile
It will run for 30 seconds, trying to get the samples it needs to provide us with information. We’ll get an output like this:
$ go tool pprof http://localhost:8080/debug/pprof/profile
Fetching profile over HTTP from http://localhost:8080/debug/pprof/profile
Saved profile in /home/viktoras/pprof/pprof.main.samples.cpu.005.pb.gz
File: main
Build ID: 537f56f9e9c677deda0f029755cf52cfbc1b35ca
Type: cpu
Time: Aug 22, 2018 at 10:51am (EEST)
Duration: 30s, Total samples = 10ms (0.033%)
Here we can see that we did not gather a lot of samples. That’s due to the fact that our mouthful instance is not doing much. For a proper profiling, I’ll simulate some serious load on mouthful, by using hey. Hey is excellent for quick api load tests.
But first, we need to create some comments. For that, I’ll run a loop with curl, like so:
#!/bin/bash
for i in {1..100}
do
curl --request POST \
  --url http://localhost:8080/v1/comments \
  --header 'content-type: application/json' \
  --data '{"path": "/test","body": "this is just a test","author": "vik"}'
done
With the comments ready, we can finally do a proper profile. I’ll first restart mouthful with debug flags off, that should improve performance quite a bit, but that’s optional. It’s time to run hey on the endpoint that fetches the comments.
The following will make hey fetch the provided endpoint a million times, using 100 concurrent requests.
hey -n 1000000 -c 100 http://localhost:8080/v1/comments?uri=/test
I fire up hey, and on a separate terminal start the pprof again. After 30 seconds, you’ll see something like this:
$ go tool pprof http://localhost:8080/debug/pprof/profile
Fetching profile over HTTP from http://localhost:8080/debug/pprof/profile
Saved profile in /home/viktoras/pprof/pprof.main.samples.cpu.006.pb.gz
File: main
Build ID: 537f56f9e9c677deda0f029755cf52cfbc1b35ca
Type: cpu
Time: Aug 22, 2018 at 11:06am (EEST)
Duration: 30.21s, Total samples = 1.02mins (201.79%)
Entering interactive mode (type "help" for commands, "o" for options)
We now have more samples, perhaps that’s something we can work with. You can also notice that pprof stays in interactive mode. I personally don’t use the interactive mode, but that’s just me. Feel free to use it if you like it.
Hey also reports, that mouthful managed 3861.2859 requests/second.
Anyway, back to pprof. So now we have the profile saved at (in my case anyway) the following path.
/home/viktoras/pprof/pprof.main.samples.cpu.006.pb.gz
To make sense of the profile, we’ll use pprofs’ png feature, to export the information as a graph we can read with human eyes.
go tool pprof -png /home/viktoras/pprof/pprof.main.samples.cpu.006.pb.gz > profile1.png
The command outputs an image you can see below(click for the full size):
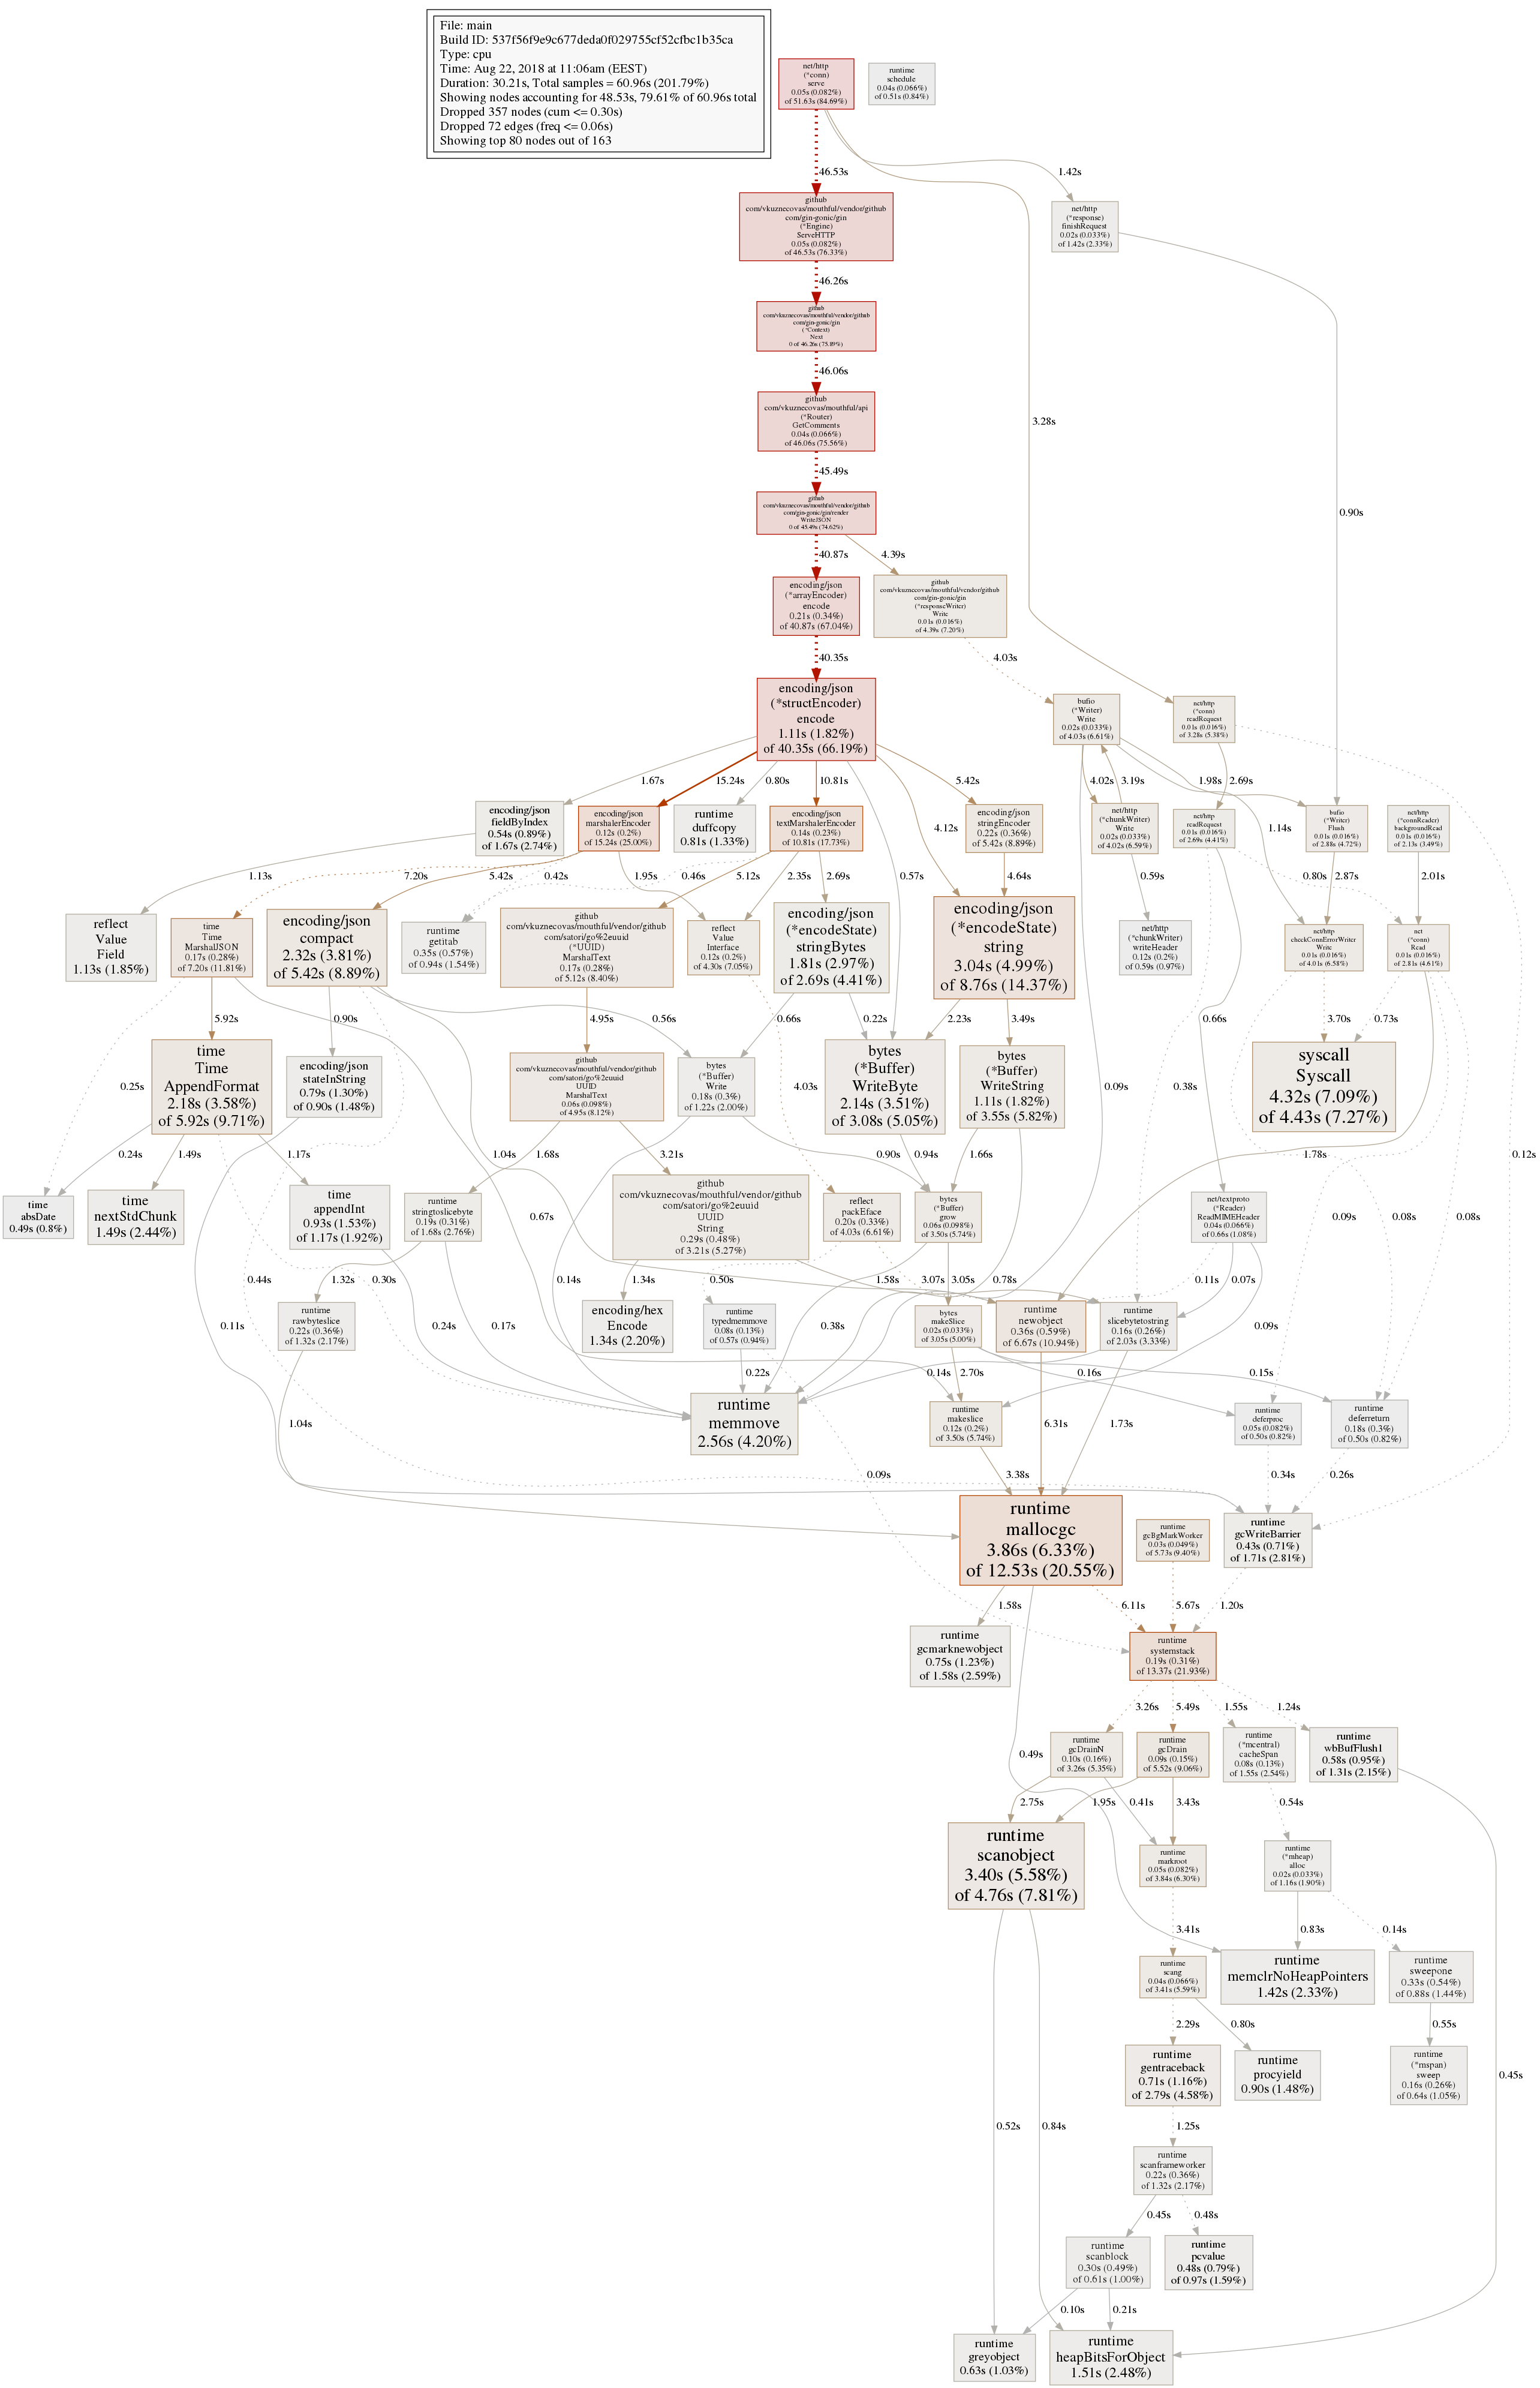
The graph shows the time that mouthful spent on certain methods. You might get a few different paths on your profiles, but here we only get shown 2. Pprof hides the nodes it thinks are not as important. Using this graph, we can understand where the bottlenecks are. In our case, the vast majority of the time(46.53s) was spent in github.com/vkuznecovas/mouthful/vendor/github.com/gin-gonic/gin. Following the stack we see that mouthful/api GetComments gets 46 seconds of that. If we go even further down the path, we’ll soon see that nearly 41 second of the 46 was spent doing json encoding(encoding/json encode). I’m getting the feeling this is something we can fix.
So here’s what the GetComments looks like:
func (r *Router) GetComments(c *gin.Context) {
	path := c.Query("uri")
	if path == "" {
		c.AbortWithStatusJSON(400, global.ErrThreadNotFound.Error())
		return
	}
	path = NormalizePath(path)
	if r.cache != nil {
		if cacheHit, found := r.cache.Get(path); found {
			comments := cacheHit.(*[]dbModel.Comment)
			c.Writer.Header().Set("X-Cache", "HIT")
			c.JSON(200, *comments)
			return
		}
	}
	db := *r.db
	comments, err := db.GetCommentsByThread(path)

	if err != nil {
		if err == global.ErrThreadNotFound {
			c.AbortWithStatusJSON(404, global.ErrThreadNotFound.Error())
			return
		}
		log.Println(err)
		c.AbortWithStatusJSON(500, global.ErrInternalServerError.Error())
		return
	}
	if comments != nil {
		if r.cache != nil {
			r.cache.Set(path, &comments, cache.DefaultExpiration)
			c.Writer.Header().Set("X-Cache", "MISS")
		}
		if len(comments) > 0 {
			c.JSON(200, comments)
		} else {
			c.JSON(404, global.ErrThreadNotFound.Error())
		}
		return
	}
	c.AbortWithStatusJSON(404, global.ErrThreadNotFound.Error())
}
I know it’s not the prettiest of methods, but can you spot the issue? The problem is related to caching. What I’m doing here, is storing the comment struct array in cache and the returning it to the consumer, using the gin contexts’ JSON method. The JSON method takes the objects from cache and has to marshal them to JSON for every request. We could optimize it by storing the already marshaled JSON instead of the comment structs and returning it without calling the gins’ JSON method.
After a quick change, the GetComments starts looking like this:
func (r *Router) GetComments(c *gin.Context) {
	path := c.Query("uri")
	if path == "" {
		c.AbortWithStatusJSON(400, global.ErrThreadNotFound.Error())
		return
	}
	path = NormalizePath(path)
	if r.cache != nil {
		if cacheHit, found := r.cache.Get(path); found {
			jsonString := cacheHit.(*[]byte)
			c.Writer.Header().Set("X-Cache", "HIT")
			c.Data(200, "application/json; charset=utf-8", *jsonString)
			return
		}
	}
	db := *r.db
	comments, err := db.GetCommentsByThread(path)

	if err != nil {
		if err == global.ErrThreadNotFound {
			c.AbortWithStatusJSON(404, global.ErrThreadNotFound.Error())
			return
		}
		log.Println(err)
		c.AbortWithStatusJSON(500, global.ErrInternalServerError.Error())
		return
	}
	if comments != nil {
		js, err := json.Marshal(comments)
		if err != nil {
			c.JSON(500, global.ErrInternalServerError.Error())
			return
		}
		if r.cache != nil {
			r.cache.Set(path, &js, cache.DefaultExpiration)
			c.Writer.Header().Set("X-Cache", "MISS")
		}
		if len(comments) > 0 {
			c.Data(200, "application/json; charset=utf-8", js)
		} else {
			c.JSON(404, global.ErrThreadNotFound.Error())
		}
		return
	}
	c.AbortWithStatusJSON(404, global.ErrThreadNotFound.Error())
}
Instead of storing the comments as structs, we now store the marshaled byte representation of struct in the cache. Once the user requests the comments, if we have them in cache, we don’t need to re-marshal them. This should save us A LOT of time. Time to profile again.
Hey now reports a massive increase in request throughput: 22244.9003 requests/sec. That’s quite a margin.
Here’s what pprof now generates(click for the full size):
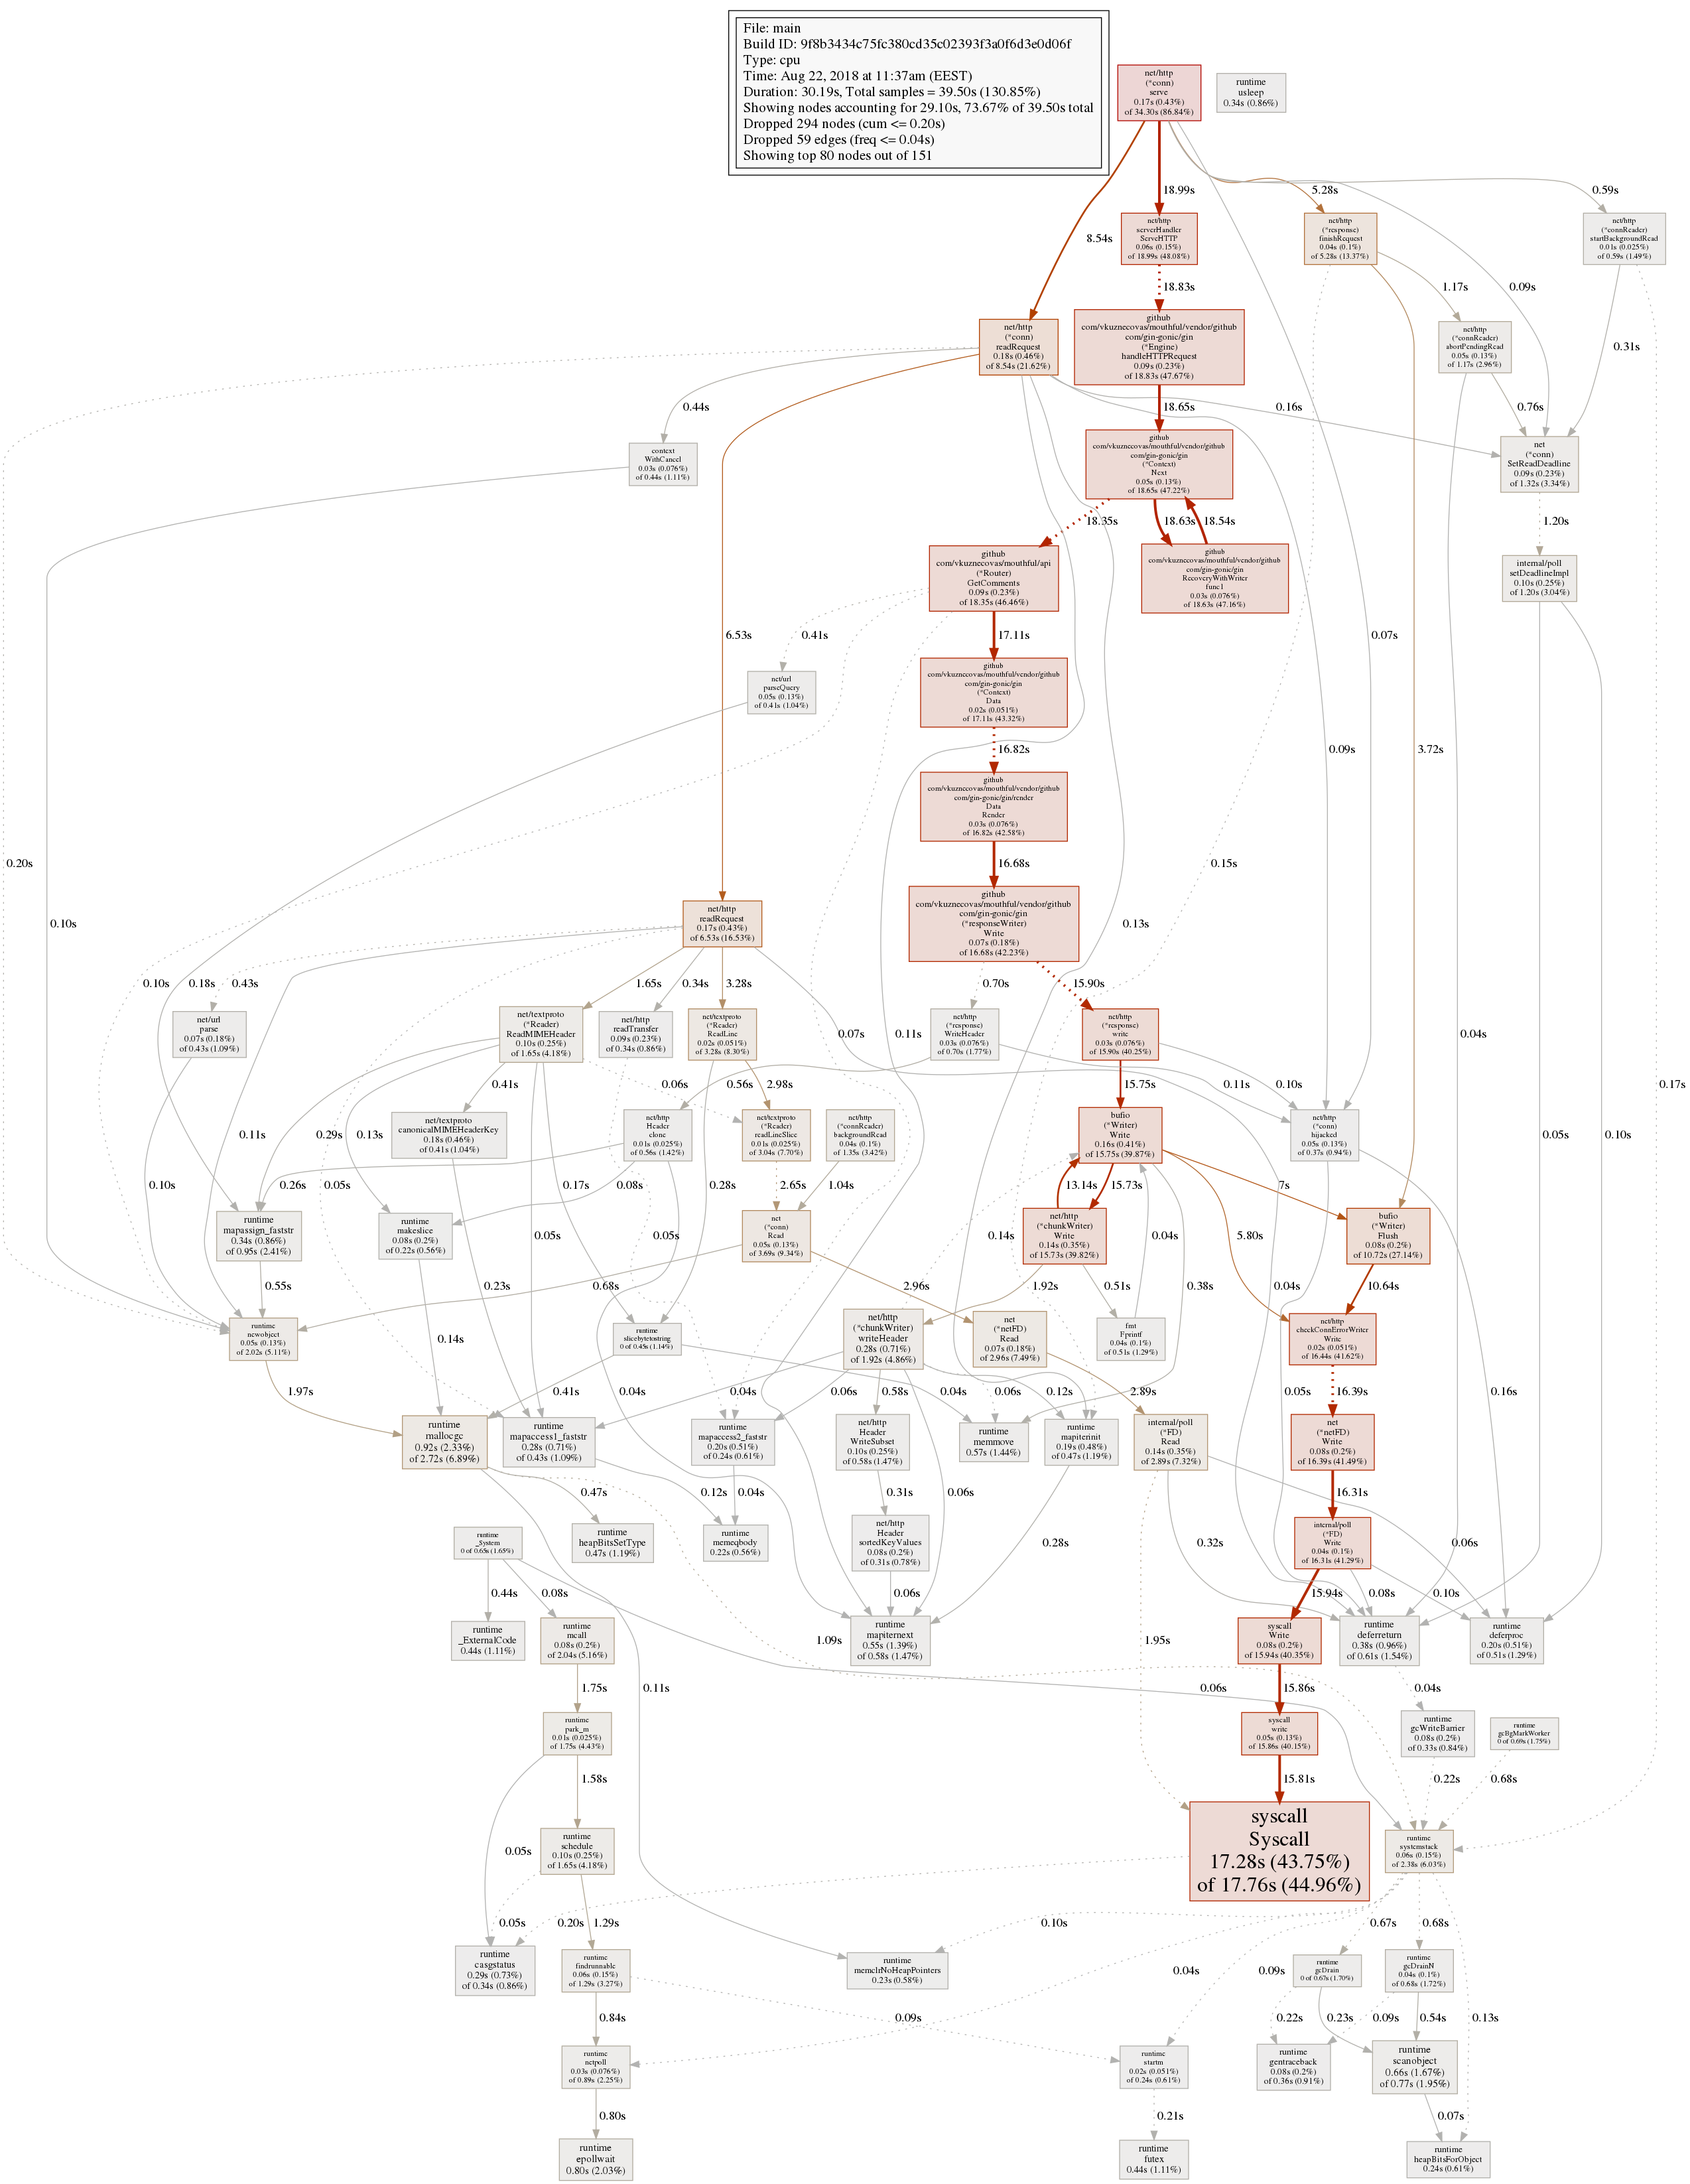
It now seems most of the time is actually spent writing data, instead of marshaling it. Huge win performance wise.
If you’re interested, here’s the mouthful config.json file I’ve used for this demo. Also, this is the PR with the fix I’ve merged in mouthful.
I hope you enjoyed this quick walkthrough of using pprof. Do let me know if I’ve made any mistakes in the comments below. I love hearing your feedback!
此内容由惯性聚合(RSS阅读器)自动聚合整理,仅供阅读参考。 原文来自 — 版权归原作者所有。