









Quick answer: If you want a Claude Code metrics dashboard fast, use Docker Compose for local-only control or Sealos if you want a public Grafana URL, SSL, and less infrastructure work. Both paths use the same Grafana + Prometheus + OpenTelemetry stack.
Last verified: March 9, 2026. Anthropic's monitoring fields, exporter behavior, and privacy notes can change, so verify against the official monitoring docs if you are standardizing this for a team.
| If you want to... | Best path | Time to first dashboard | Best next step |
|---|---|---|---|
| Keep everything local and tweak every config | Docker Compose | ~10-20 minutes | Jump to Docker Compose Monitoring Setup |
| Share dashboards quickly without fighting SSL and public access | Sealos App Store | ~2-5 minutes | Jump to Cloud Alternative: Deploying on Sealos |
| Track team usage with less ops overhead | Sealos App Store | ~2-5 minutes | Deploy the Grafana OTEL stack |
Best fit for most readers: Start with Sealos if your real goal is to get a working dashboard URL today, not to maintain certificate renewals and public ingress yourself.

If you only track three things at first, track these:
| Metric | Why it matters first | What to do with it |
|---|---|---|
Cost (claude_code.cost.usage) | This answers whether Claude Code is actually saving time cheaply enough to keep using at current volume. | Break it down by day, model, and project before you optimize anything else. |
Cache efficiency (cacheRead vs input) | This is often the fastest way to find waste. Low cache reuse usually means you're paying full price for repeated context. | Fix prompt structure and repeated instructions before assuming your model choice is the problem. |
| Active time | This helps distinguish "Claude is busy doing useful work" from "people are waiting on the tool or thrashing." | Compare active time against commits, PRs, and session count to see whether usage is productive or just noisy. |
These three numbers get you from "we turned telemetry on" to "we can actually make a cost and workflow decision."
| If your main goal is... | Choose | Why |
|---|---|---|
| Learn the stack and keep everything local | Docker Compose | Maximum control over Collector, Prometheus, and Grafana config |
| Share a dashboard quickly with a team | Sealos App Store | Public URL, SSL, and persistent storage without extra ingress work |
| Get cost visibility this afternoon instead of next week | Sealos App Store | Shortest path from zero to usable dashboard |
Anthropic's official monitoring docs are clear on one point: telemetry is opt-in, but "prompt text is not logged" does not mean "nothing sensitive can ever leave your machine."
Before you roll this out, keep these caveats in mind:
tool_parameters, which can reveal secrets if your commands contain them.user.email can appear in telemetry attributes.OTEL_LOG_USER_PROMPTS=1.If this stack will be shared across a team, decide on redaction and access control before deciding on dashboards.
| Question | Docker Compose | Sealos |
|---|---|---|
| Do you want to learn every moving part locally? | Best fit | Fine, but overkill |
| Do you need a public Grafana URL with SSL quickly? | Manual work | Best fit |
| Do you want teammates to see the same dashboard today? | Possible, but ops-heavy | Best fit |
| Do you want persistent storage without hand-rolling infra? | Manual | Best fit |
| Do you need full control and local-only exposure? | Best fit | Less important |
The rule of thumb is simple: use Docker Compose to learn and test; use Sealos when the real requirement is sharing, persistence, and lower ops friction.
The Sealos angle here is not "hosted is magic." It is more concrete than that.
The one-click Sealos template gives you the same Grafana + Prometheus + OpenTelemetry stack, but removes the four things teams usually get stuck on first:
If your real goal is "the team needs a usable dashboard URL this week," that is where Sealos usually wins.
Claude Code metrics exist for one reason: to show where your token spend, cache efficiency, and session time actually go. Without telemetry, you are guessing.
Here is the practical problem this page solves: you can use Claude Code heavily for refactors, tests, and debugging, then get the bill later with no clear explanation of which workflows burned the budget. Claude Code telemetry already tracks the answer. You just need to export and visualize it.
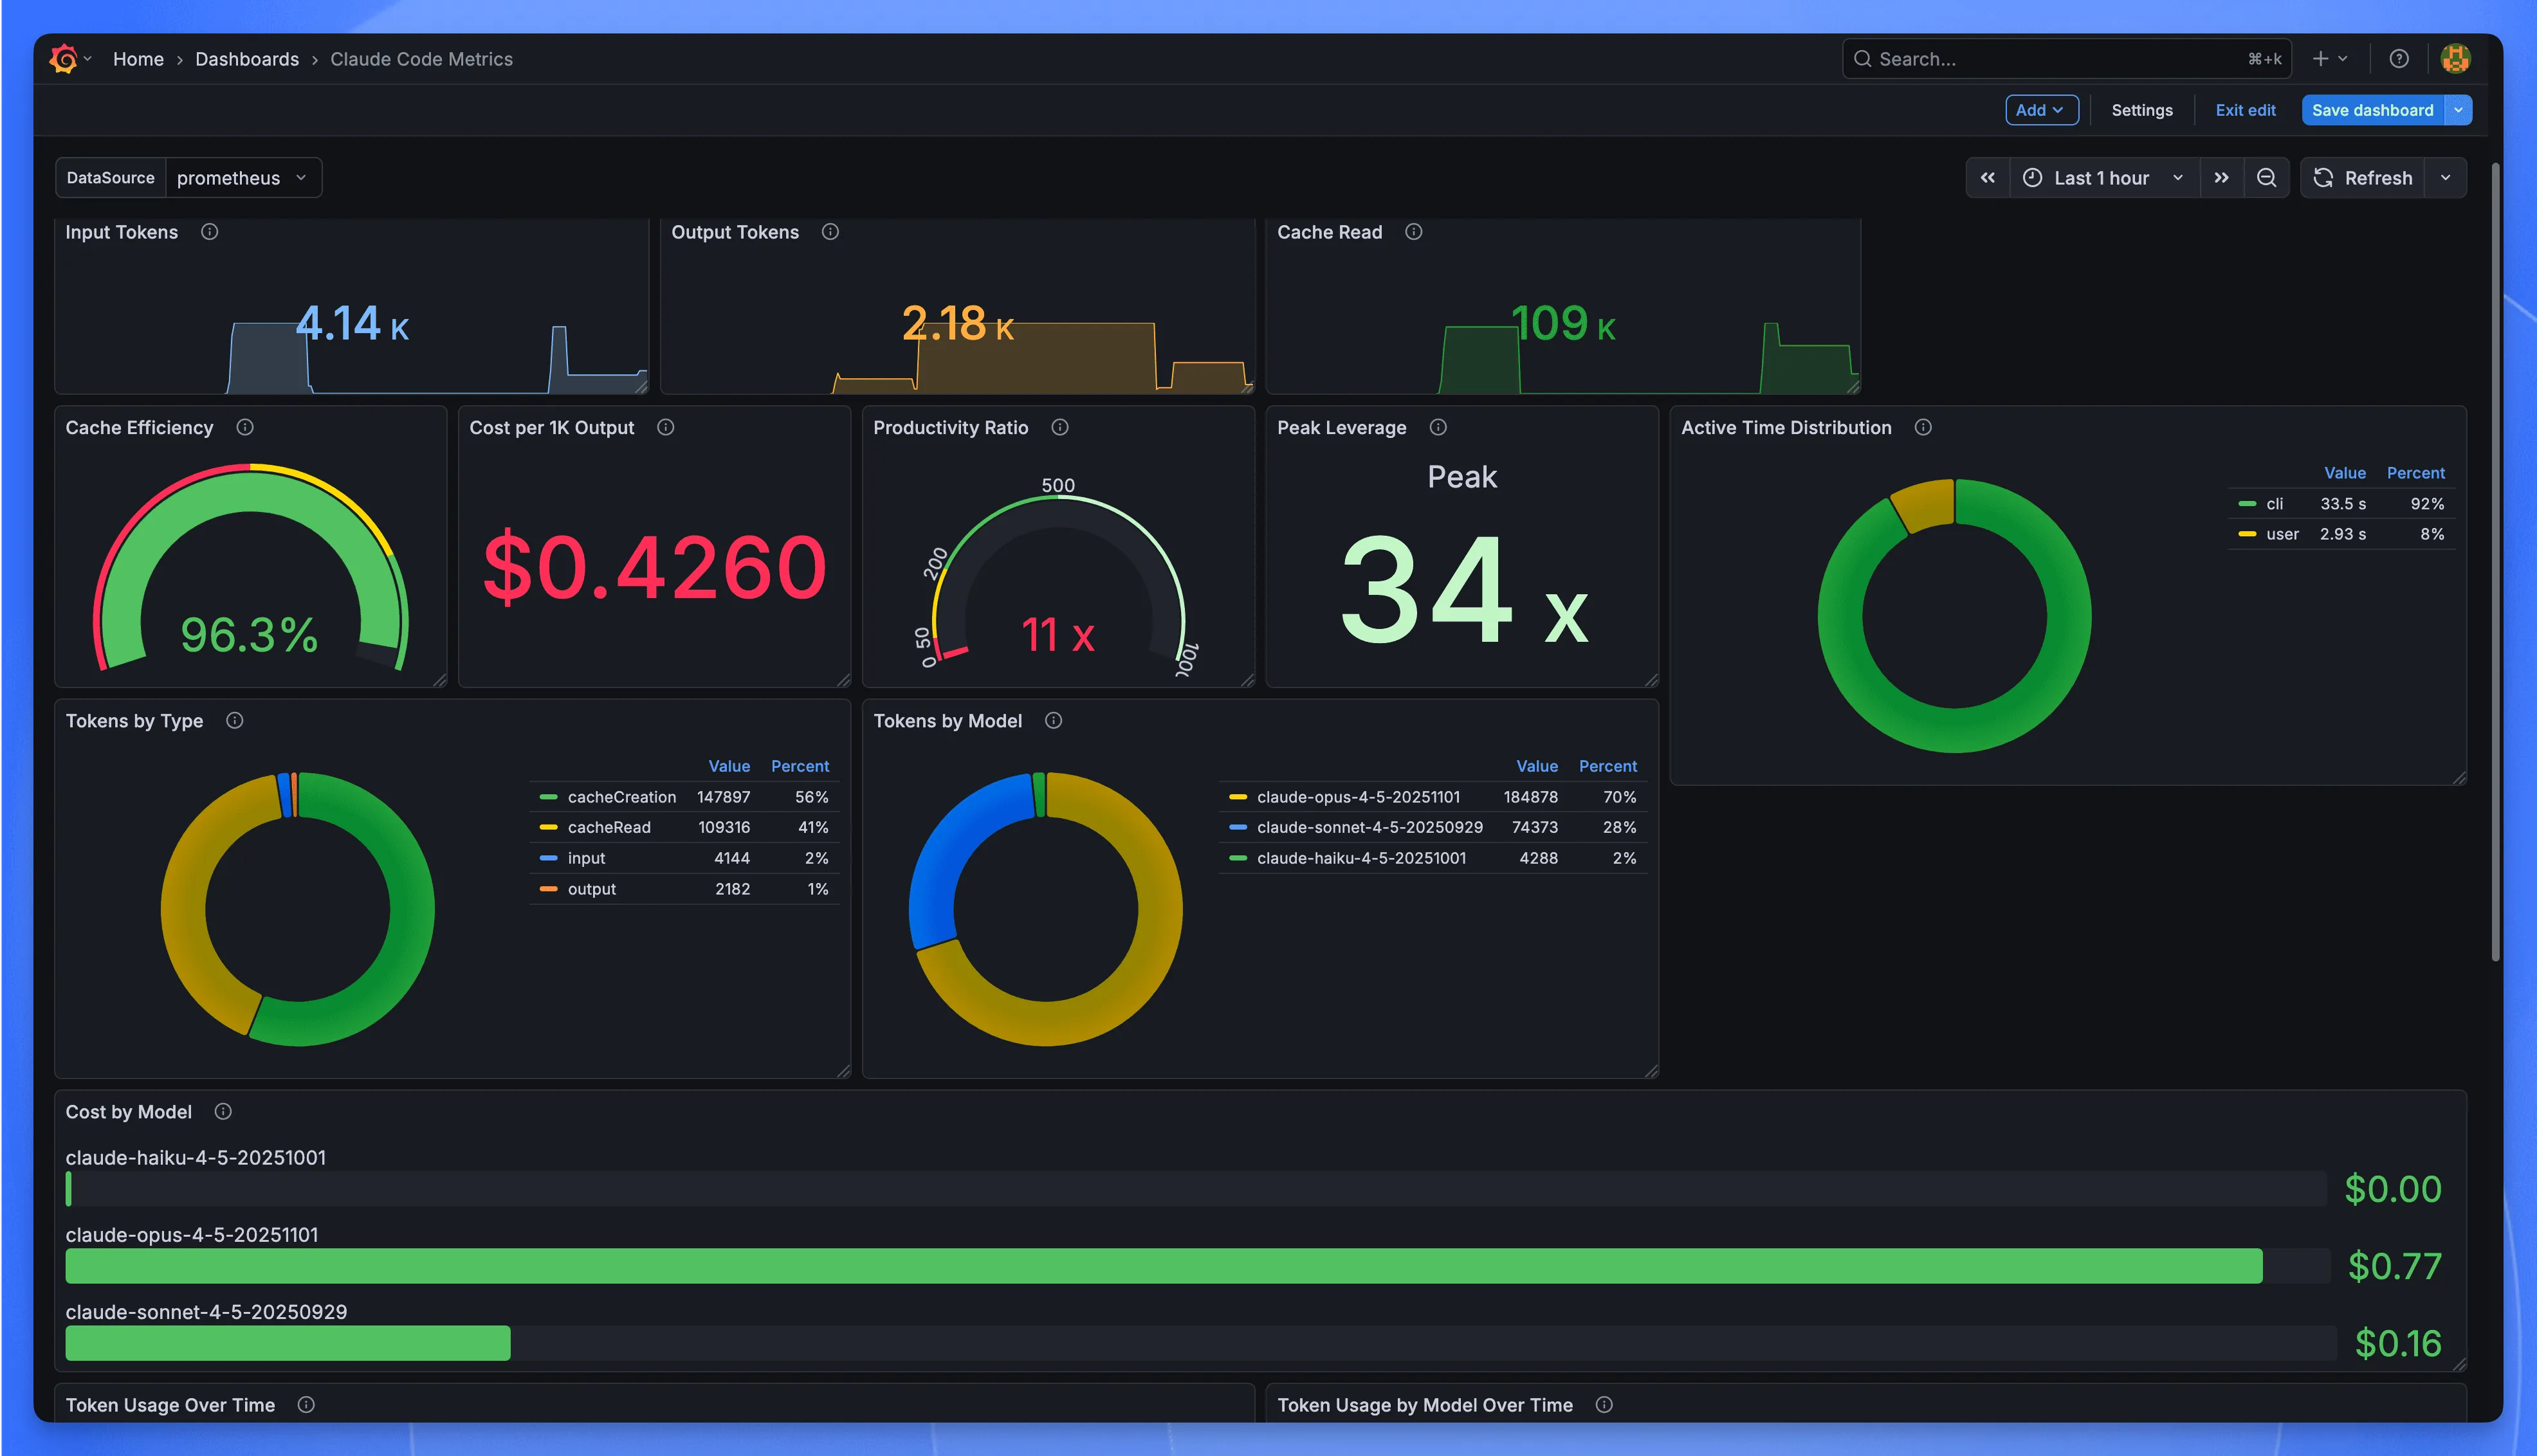 Claude Code Metrics Dashboard
OpenTelemetry Collector, Prometheus, Grafana. That is the stack. You can run it locally with Docker Compose or get a shareable version online faster with Sealos.
What you get at the end: panels showing which projects burn tokens fastest, whether your prompt changes improved cache efficiency, and what your real cost-per-commit looks like.
What are Claude Code metrics? Claude Code metrics are telemetry data points—exported via OpenTelemetry—that track token usage, API costs, cache efficiency, session duration, and code changes. These metrics enable developers to monitor spending, identify inefficient prompts, and optimize their Claude Code workflows through visualization tools like Grafana.
Claude Code telemetry is the automatic recording of every API interaction—tokens in, tokens out, cache hits, response time—all reduced to exportable numbers. Every time you hit Enter, Claude Code can capture what happened and send it to your monitoring stack via OpenTelemetry.
Claude Code exports two types of telemetry data: metrics and events. Metrics are counters and gauges—running totals like token usage, total cost, and session count that answer "how much" questions. Events are snapshots of individual moments—this API call succeeded, that tool took 3.2 seconds—answering "what exactly happened" questions.
Both speak OTLP—OpenTelemetry's wire protocol. Any backend that understands OTLP can ingest them. Prometheus, Datadog, Honeycomb, whatever. No lock-in.
One thing worth knowing: telemetry ships disabled. You opt in. Prompt text is not exported by default, but some event fields can still reveal operational details such as commands and file paths. Treat the telemetry stream as safer than raw prompt logging, not automatically safe for every shared backend.
Eight counters. Here's what each one tracks:
| Metric | What It Counts |
|---|---|
claude_code.session | Session starts |
claude_code.token.usage | Tokens, split by type: input, output, cacheRead, cacheCreation |
claude_code.cost.usage | Estimated cost in USD |
claude_code.lines_of_code | Lines added or removed when you accept edits |
claude_code.commit | Git commits made through Claude Code |
claude_code.pull_request | PRs created |
claude_code.code_edit_tool.decision | Your accept/reject choices on suggested edits |
claude_code.active_time | Time spent—yours vs. Claude's |
Cache read tokens cost 90% less than regular input tokens in Claude Code. This makes cache efficiency one of the most important metrics to monitor. If your* cacheRead stays low while input climbs, you're paying full price for context that could have been cached. I'll show you how to spot this in the dashboard section.
Events catch what counters miss: the texture of individual interactions.
| Event | When It Fires | What It Records |
|---|---|---|
claude_code.user_prompt | You submit a prompt | Length (content redacted) |
claude_code.api_request | Each API call completes | Model, cost, latency, token breakdown |
claude_code.api_error | An API call fails | Error type, status code, retry attempt |
claude_code.tool_result | A tool finishes | Tool name, success/failure, duration |
claude_code.tool_decision | Permission granted or denied | Tool, decision, source |
When things go sideways—error spikes, weird latency, a cost jump you can't explain—events are where you dig. Metrics tell you that something changed. Events tell you what.
Every metric and event carries labels you can filter on:
model — which Claude model handled the requestsession.id — ties data points to a specific coding sessionuser.account_uuid — your account identifierorganization.id — for team accountsapp.version — Claude Code versionThese matter when you start asking targeted questions. "Show me token usage for Sonnet only." "Compare Tuesday's costs to Wednesday's." "Which session burned through $12 in an hour?" The labels make those queries possible.
Numbers without context are just noise. Knowing you spent $47 last week tells you nothing. Knowing you spent $47, mostly on Tuesday, mostly on Opus, mostly during that three-hour refactoring session where you kept regenerating the same function—that's actionable.
The dashboard turns the first kind of knowledge into the second.
The Claude Code metrics pipeline uses three components: OpenTelemetry Collector, Prometheus, and Grafana. Claude Code exports telemetry over OTLP (OpenTelemetry's standard protocol), which the Collector translates into a format Prometheus can scrape. Grafana then visualizes the stored time-series data. This architecture is vendor-neutral—you can swap any component without re-instrumenting your setup.
The setup has three pieces:
The Collector translates protocols. Claude Code pushes OTLP to port 4317 (gRPC) or 4318 (HTTP). The Collector batches it, converts the format, and exposes a Prometheus-compatible endpoint on 8889. Two systems that don't speak the same language, one adapter in between.
Prometheus stores everything. It pulls from the Collector every few seconds, timestamps each data point, writes to disk. Its query language—PromQL—is where the real power lives. Sum by model. Filter by session. Average over the last hour. The dashboards you'll build are just PromQL with a visual layer on top.
Grafana displays the results. It holds no data itself. You could run every query from a terminal and get the same numbers. Grafana just makes them readable without squinting at JSON.
Why these three? I've run this stack on personal projects and at work. Prometheus and Grafana have been around long enough that when something breaks, someone on Stack Overflow already fixed it five years ago. The Collector earns its place by making future changes cheap—add an exporter, ship to a second backend, no re-instrumentation required.
I wasted twenty minutes once, convinced my setup was broken. Dashboard showed nothing. Logs looked fine. Turned out I just wasn't waiting long enough.
Claude Code exports metrics every 60 seconds by default. Prometheus scrapes every 15. Best case, you're looking at 75 seconds before anything appears. Worst case—when the cycles don't align—closer to 90.
If you're testing and the dashboard is empty: wait. A full ninety seconds. Then refresh.
You can speed this up for debugging:
Reset it when you're done. Aggressive polling wastes CPU and buys you nothing in normal use.
Events are different—they export every 5 seconds. Logs show up fast. Metrics take their time.
Prometheus works until it doesn't. A few situations where you'll hit walls:
High-cardinality data—thousands of unique session IDs, daily active user counts—gets expensive to store and slow to query. ClickHouse handles that shape better.
Full-text search on logs isn't what Prometheus does. If you need to grep through event payloads, add Loki or Elasticsearch.
Enterprise compliance sometimes mandates specific vendors. The Collector helps here too—Datadog, Honeycomb, Splunk all accept OTLP. Switching backends means changing exporter config, not ripping out instrumentation.
For one developer watching their API bill, Prometheus and Grafana are plenty. Add complexity when the problem forces you to, not before.
Quick Overview: 6 Steps to a Working Dashboard
- Check prerequisites (Docker, ports, disk space)
- Create project directory structure
- Configure OpenTelemetry Collector
- Configure Prometheus scrape jobs
- Set up Grafana data source
- Launch and verify the stack
⏱️ Total time: 10-15 minutes
Time to build.
Docker Compose gets the whole stack running locally—Collector, Prometheus, Grafana—without touching Kubernetes or signing up for anything. Containers talk to each other on your machine. That's it.
Works well for solo developers, local testing, or small teams who'd rather own their data than rent dashboard space from a vendor.
Before you start:
| Requirement | Minimum Version | Check Command |
|---|---|---|
| Docker | 20.10+ | docker --version |
| Docker Compose | 2.0+ | docker compose version |
| Free Ports | 3000, 4317, 4318, 8889, 9090 | netstat -tuln |
| Disk Space | 1GB+ | df -h |
New to Docker? See the official installation guide and Docker Compose documentation.
Create a working directory and the folder skeleton:
You'll end up with:
The Collector sits between Claude Code and Prometheus. It takes OTLP metrics, batches them, and re-exposes them in a format Prometheus understands.
Ports 4317 and 4318 are where Claude Code sends data—gRPC and HTTP respectively. Port 8889 is where Prometheus pulls the converted metrics.
The debug exporter prints incoming data to container logs. Useful while you're testing. Remove it later if the noise gets annoying.
Prometheus scrapes the Collector every few seconds and stores everything as time-series data.
The 10-second scrape interval is intentional. Claude Code sessions can be short. A default 30-second interval would smooth over usage spikes you might actually want to see.
This file tells Grafana where to find Prometheus. Drop it in the provisioning folder and Grafana wires itself up on first boot—no clicking through setup wizards.
The main file. It pulls three images, wires them onto a shared network, and sets up health checks so each service waits for its dependencies before starting.
90-day retention is a middle ground. Long enough to spot monthly trends. Short enough to keep storage under 5 GB for most solo users. Need a year of history? Change it to 365d and keep an eye on disk usage.
Give it 10–20 seconds. You should see lines like:
Open these URLs:
If any of them won't load, check docker compose ps first. A container in "Restarting" state usually means a config typo.
Before hooking up Claude Code, push a fake metric through the pipeline. This confirms data actually flows end-to-end.
Now query Prometheus:
You should see a result with value 42. Empty response? Wait 15 seconds—Prometheus scrapes on an interval—and try again.
Claude Code telemetry is disabled by default. Follow these 4 steps to enable metric export to your monitoring stack:
Here's what got me the first time: environment variables are read at startup. I set everything, ran a prompt, checked Grafana—nothing. Spent twenty minutes checking configs before realizing Claude Code was still running from before I exported anything. Restart it. Then it works.
| Port | Protocol | When to Use |
|---|---|---|
:4318 | http/protobuf | Default choice. Works in most setups. |
:4317 | grpc | High-throughput scenarios where every millisecond counts. |
Stick with HTTP unless you have a reason not to.
You'll forget to export these variables. I did, repeatedly—opened a new terminal, started a session, wondered why the dashboard went flat.
Put them in your shell profile and stop thinking about it:
Reload:
Start Claude Code. Ask it anything—a one-liner is fine, as long as it hits the API. Then check if data is flowing.
Collector logs first:
Or ask Prometheus directly:
Data shows up? You're done. Empty response? Wait. Seriously—60 to 90 seconds. That's the default export interval doing its thing. Then try again.
One more trick. If you want to watch metrics stream through your terminal while they're also going to the Collector:
Useful for debugging. Less useful for your scrollback buffer.
Numbers in a terminal don't stick. I'd run PromQL queries, get back perfectly accurate results, and forget them thirty seconds later. A dashboard changes that—patterns jump out when you can see them.
Step 1: Log into Grafana at http://localhost:3000
admin / adminStep 2: Navigate to Import
Step 3: Load the Dashboard JSON
.json file directlyStep 4: Connect to Prometheus
Prometheus data source when promptedStep 5: Save and View
If you followed the Docker Compose setup, pick the auto-provisioned Prometheus source. Done.
Top row shows vital signs—sessions, commits, cost. The middle row has efficiency gauges. Bottom row tracks trends over time.
Six stat panels. These are the ones I glance at with my morning coffee.
| Panel | What It Answers |
|---|---|
| Sessions | How many times have I fired up Claude Code? |
| Commits Made | Tangible output—code that shipped |
| Lines of Code | Volume of accepted suggestions |
| Total Cost | The bill. In dollars. |
| Active Time (You) | Time you spent typing prompts |
| Active Time (CLI) | Time Claude spent thinking and generating |
That last pair—your time versus Claude's time—reveals something important. A 10:1 ratio means Claude works ten minutes for every minute you spend prompting. That's multiplication, not addition. If the ratio creeps toward 1:1, you're probably over-directing. Give Claude more room.
Four counters split by type:
The cache numbers deserve attention. If cacheRead stays tiny compared to input, you're paying full price for everything. I learned this the hard way. Restructured my prompts—static context at the top, variable parts at the bottom—and watched my cache hit rate climb from 30% to 75%.
These panels earn their screen real estate. I look at them before anything else.
Color thresholds:
For every second you spend prompting, how many seconds does Claude work?
10x is solid. 50x or higher means you're handing over meaningful chunks of work. Below 5x? You might be micromanaging. Try stepping back.
When this number spikes, something changed. Maybe you switched models mid-project. Maybe a prompt is causing excessive back-and-forth. This gauge catches it.
Three pie charts show where resources go:
cacheRead sliceThe model chart caught me once. I pulled up a week's data and saw 90% of tokens going to the most expensive model—for tasks that didn't need it. Simple stuff, like generating boilerplate tests. Switched those to a faster model. Bill dropped by a third.
Horizontal bars, one per model. Color thresholds:
When a bar turns red, pause. Ask yourself: did those tasks actually need that model?
Four panels track how things change over time. Useful for post-mortems.
Spikes correlate with intensive sessions. That big refactor on Tuesday? This chart tells you what it cost.
Reveals model-switching patterns. If you're bouncing between models mid-session, it shows up here.
The * 300 converts per-second rate to per-5-minute value. Watch for cost spikes that don't match productive output.
Shows work rhythms. When are you prompting heavily? When is Claude doing autonomous work? Patterns emerge after a week or two.
The imported dashboard covers common cases. Here's how to extend it.
Session-Level Table
I wanted to find my most expensive sessions. Added a Table panel with:
Now I can drill into individual sessions and see which ones burned through tokens.
Cost Alerts
After one surprise bill, I set up alerts:
sum(claude_code_cost_usage_USD_total) > 50Mine fires when daily spend crosses $20. Caught a runaway script once. The alert paid for itself that day.
Time Range Variables
Dashboard variables let you switch between 5m, 1h, 1d views without editing every query:
[5m] in queries with [$interval]| What You Want | Query |
|---|---|
| Total Sessions | count(count by (session_id)(claude_code_token_usage_tokens_total)) |
| Total Cost | sum(claude_code_cost_usage_USD_total) |
| Input Tokens | sum(claude_code_token_usage_tokens_total{type="input"}) |
| Output Tokens | sum(claude_code_token_usage_tokens_total{type="output"}) |
| Cache Hit Rate | sum(...{type="cacheRead"}) / (sum(...{type="cacheRead"}) + sum(...{type="input"})) * 100 |
| Productivity Ratio | sum(...{type="cli"}) / sum(...{type="user"}) |
| Cost by Model | sum by (model) (claude_code_cost_usage_USD_total) |
| Token Rate (5m) | sum by (type) (rate(claude_code_token_usage_tokens_total[5m])) |
Copy, paste, adjust. These cover most questions you'll ask. For advanced queries, see the official PromQL documentation.
Your docker compose up -d worked. Grafana shows data. Now what?
I'll tell you what happened to me. Three weeks into using this setup, I ran docker compose down -v without thinking. The -v flag. Deletes volumes. I watched 21 days of metrics disappear in under a second. No backup. No warning. Just gone.
That's the gap between "it runs" and "it runs reliably." Most monitoring setups fail quietly in that gap. Here's what I learned—mostly by breaking things.
Named volumes are the default. They work until someone types the wrong command. Or until you migrate to a new machine and realize the data didn't come with you.
Bind to explicit host paths instead:
Now you know where your data lives. /data/prometheus. Right there. You can back it up. You can move it. You can't accidentally delete it with a flag you forgot about.
Retention is the other half of this. Ninety days is the default. Fine for most dev teams. But if you need to compare this quarter to last quarter:
That retention.size flag saved me once. Prometheus was eating 2GB a week. Without the cap, it would've filled my disk in a month. With it, old data gets dropped first. Not elegant, but predictable.
Here's a fun one. I was running a complex PromQL query—aggregating six months of data across multiple dimensions. Prometheus consumed all available memory on the host. My SSH session froze. Had to hard-reboot the machine.
Containers without limits will eventually surprise you. It's not a question of if.
These numbers are for individual developers. Small teams. If you start seeing query timeouts under load, bump the limits—and add these flags:
The timeout kills runaway queries before they kill your server.
A colleague once asked to see my Grafana dashboard. I sent him the URL. He couldn't connect—my home IP had changed overnight, breaking the port forwarding. So I opened port 9090 directly. Prometheus. No auth. Exposed to the internet for about six hours before I realized.
Nothing bad happened. But it could have. A metrics system knows a lot about your operations. Treat it like it does.
Split your networks:
Prometheus now lives in a locked room. Only the Collector and Grafana can reach it. The outside world can't.
And if your Grafana password is still admin/admin—change it. Now.
Put secrets in a .env file. Keep that file out of Git. Basic stuff, but I've seen production credentials in public repos more times than I'd like to admit.
For anything beyond localhost, encrypt:
Your monitoring system can fail without telling you. I learned this when Prometheus silently stopped scraping for two days. The container was "running." The health check passed. But the scrape target had become unreachable, and nobody noticed until the dashboard went blank.
Build in real checks:
The start_period matters more than you'd think. Prometheus needs time to load its write-ahead log on startup. Without that grace period, Docker marks it unhealthy before it's had a chance to initialize. Then it restarts. Then it marks it unhealthy again. Loop.
I mentioned losing three weeks of data. Here's what I do now.
Prometheus supports snapshots through its admin API:
This runs nightly via cron. Keeps a week of snapshots. More than enough to recover from most disasters.
You'll need to enable the admin API first:
For Grafana, don't bother backing up the database. Export your dashboards as JSON. Version control them. Dashboards are configuration, not data—treat them that way.
Container logs grow forever. I found this out when a 12GB log file filled my disk.
Apply this to all three services. Thirty megabytes total per service. Enough for debugging. Not enough to cause problems.
Most of this work is invisible when things go well. You configure it once, forget about it, move on with your life.
Then something breaks at 2 AM. And you're either grateful you did this work, or you're restoring from nothing and explaining to your team why the metrics are gone.
I've been on both sides. The first side is better.
Docker Compose works well for local development. The trouble starts when your setup needs to outlive a single machine.
I hit this wall when a teammate asked to see my Grafana dashboard. Suddenly I was deep in Nginx configs, wrestling with Let's Encrypt renewals, and explaining why my home IP changed overnight. The monitoring stack that took 10 minutes to deploy took two days to make accessible.
Sound familiar? Here's the operational tax you're signing up for:
docker-compose down -v and your metrics history is goneNone of these problems are hard individually. But they stack up. And every hour spent on infrastructure is an hour not spent understanding your actual usage patterns.
And if you've ever been paged while away from your desk—debugging from a coffee shop, or worse, from your phone—you know the frustration compounds. Setting up remote access is one thing; actually using Claude Code from a mobile device is another challenge entirely. If that's a workflow you're considering, I wrote a separate guide on using Claude Code on your phone, covering SSH setups and one-click cloud environments that make mobile coding less painful.
Sealos is an open-source cloud platform built on Kubernetes. The relevant part for us: it has a one-click template that deploys the exact same Grafana + Prometheus + OpenTelemetry stack—SSL, persistent volumes, public URL, all handled.
The architecture doesn't change:
Default resource allocations are small—100m CPU, 128Mi memory per component. Enough for one person. If you have a team hammering Claude Code simultaneously, bump these up from the dashboard.
Three clicks. I timed it once: 87 seconds from login to working Grafana URL.
When it finishes, you get a URL like:
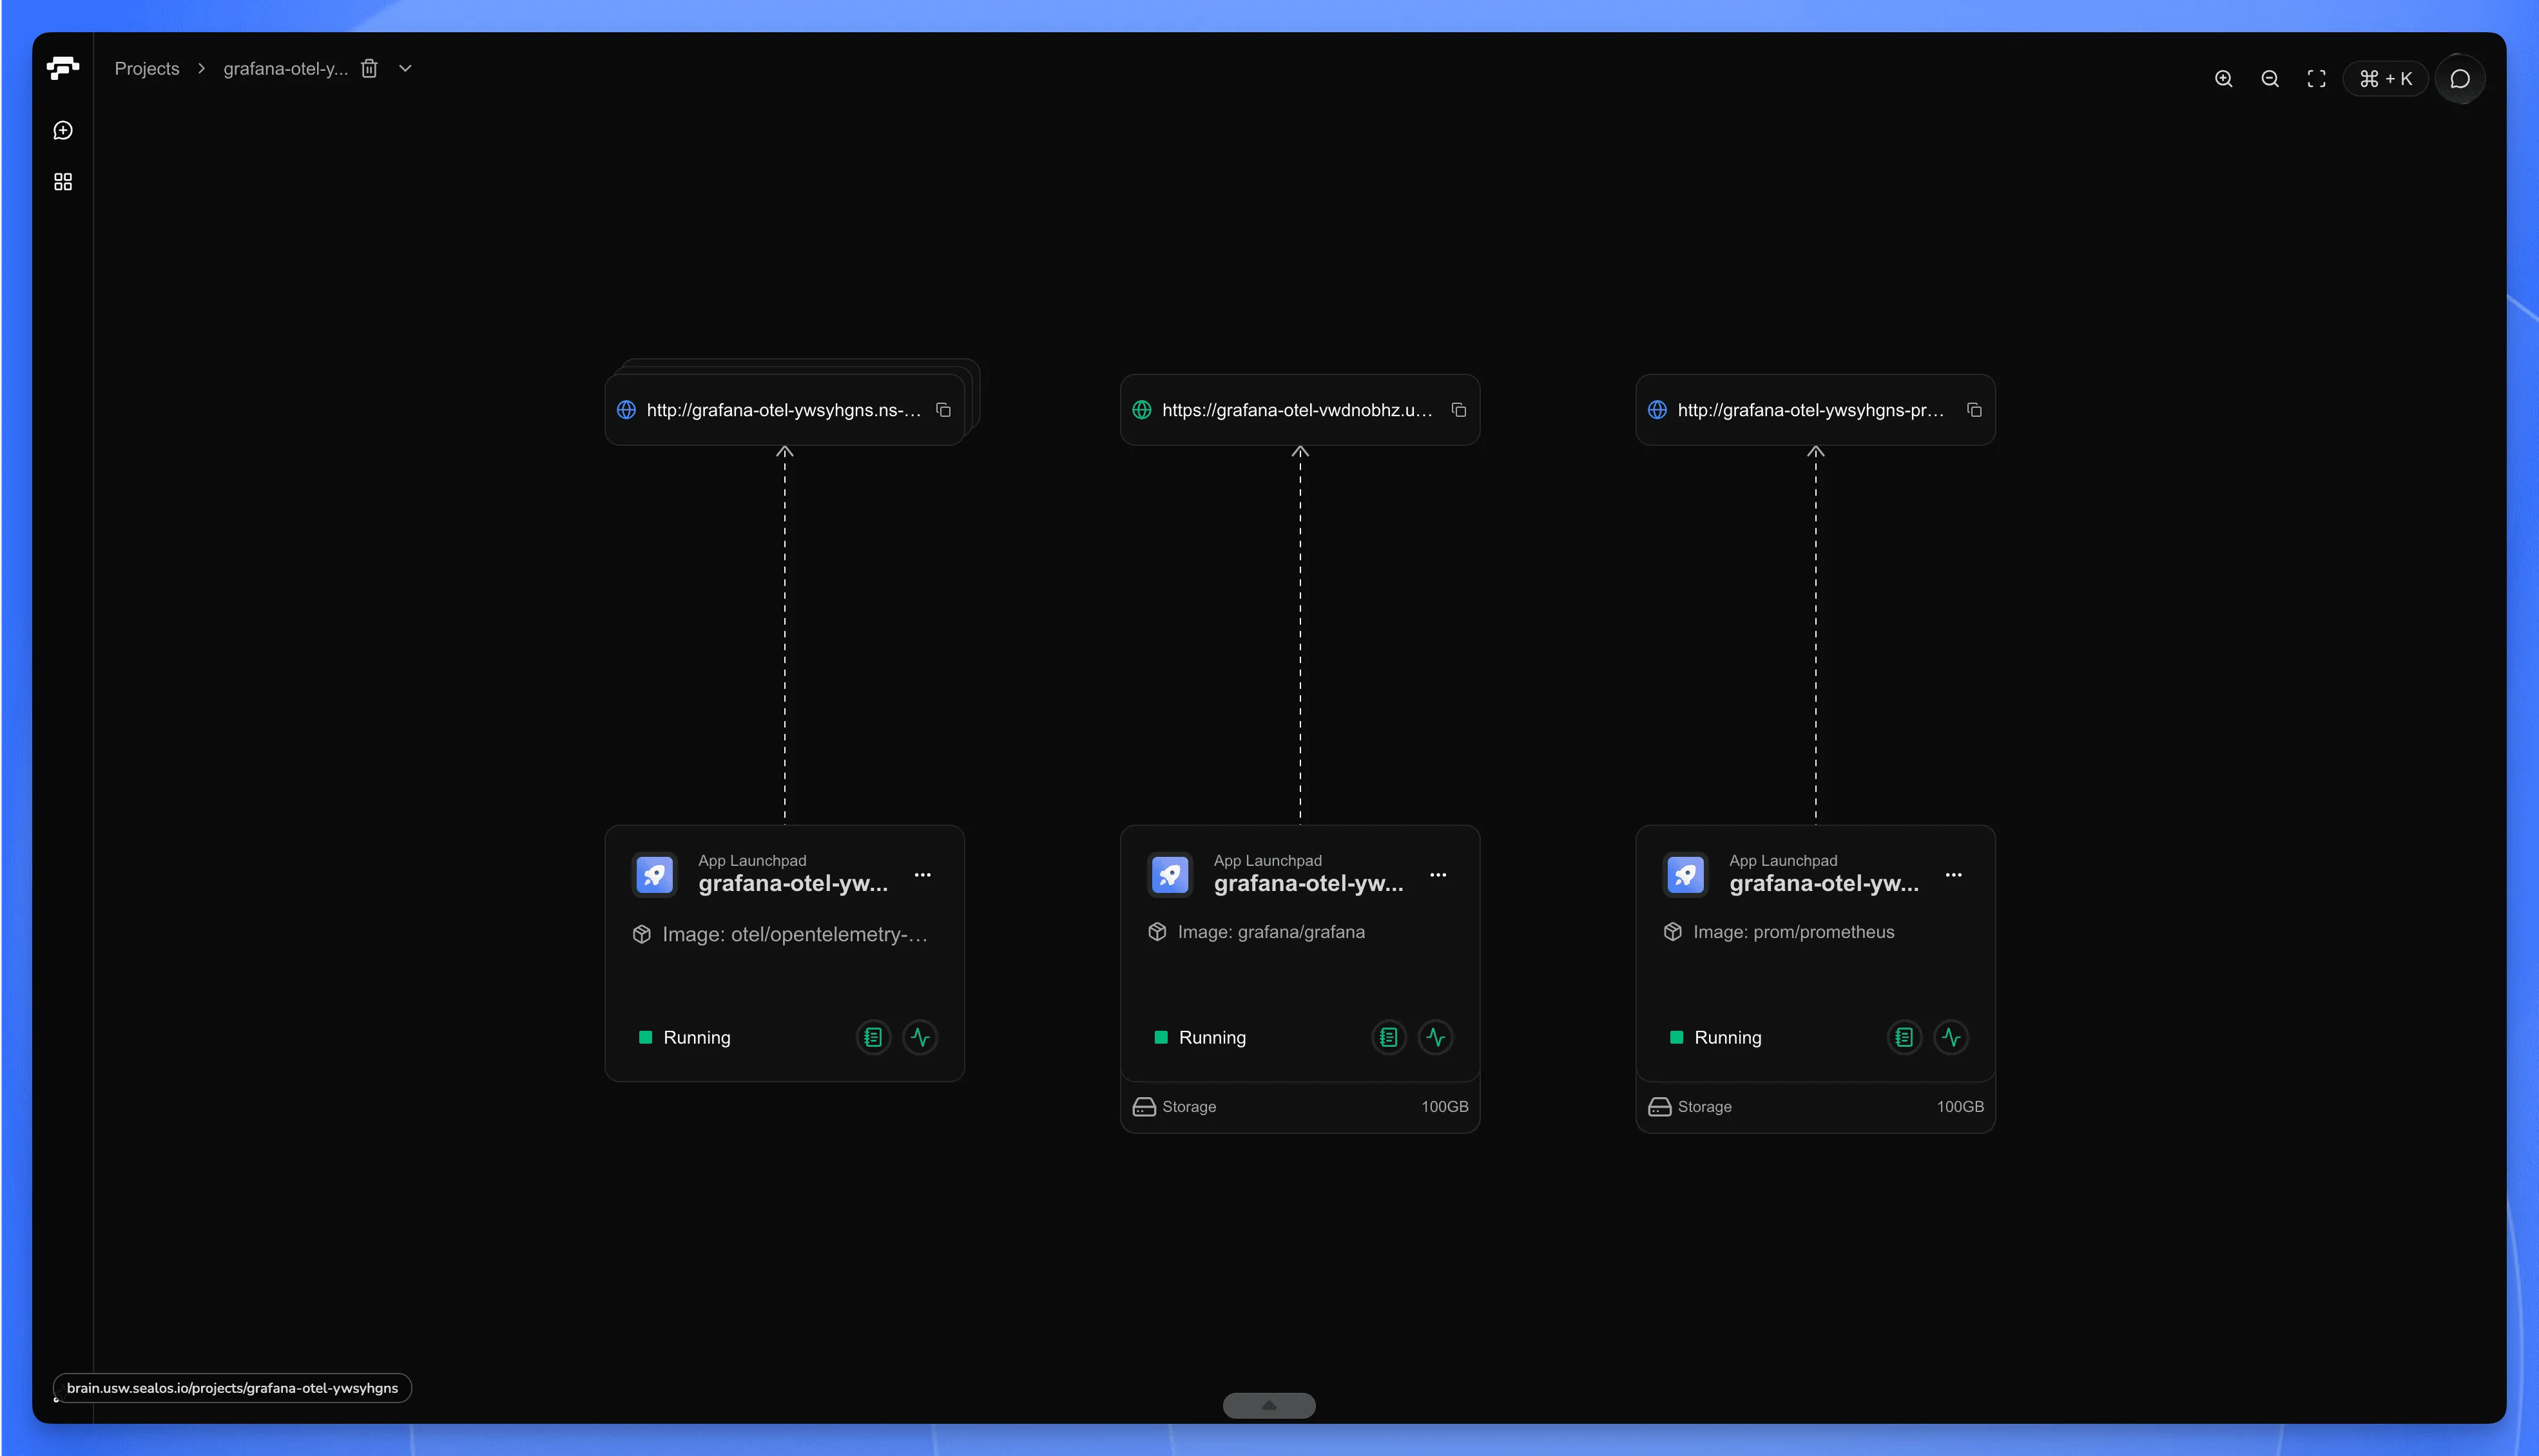 Sealos Grafana OpenTelemetry Stack
Default credentials are admin / admin. Change them immediately—this thing is on the public internet now.
One wrinkle: Grafana is public by default, but the OTLP receiver isn't. If Claude Code runs on your local machine and you need to push metrics to Sealos, you'll have to expose the collector endpoint separately.
For Claude Code running inside the same Sealos namespace (say, in a dev container):
Stick with Docker Compose if you're working locally, don't need anyone else to see your dashboards, and enjoy having full control over every config file. Cost: zero dollars, some hours.
Use Sealos if you need a shareable URL by end of day, you're tired of debugging certificate renewals, or your time is worth more than a few dollars a month.
Same technology underneath. The question is just whether you want to run the infrastructure or let someone else do it.
Something broke. The dashboard is empty, or the numbers look wrong, or nothing shows up at all.
I've been here. More than once. The good news: most failures cluster into a handful of patterns. Once you know where to look, fixes usually take minutes.
"No data" in Grafana usually means Claude Code isn't exporting metrics, not that your pipeline is broken. The most common cause: the CLAUDE_CODE_ENABLE_TELEMETRY variable wasn't set before Claude Code started. Environment variables are read once at launch—setting them afterward does nothing. Restart Claude Code after configuring your environment.
This one gets everyone. You followed the setup, fired off a prompt, waited—and Grafana stares back at you, blank.
The reflex is to poke at the dashboard. Wrong move. Start at the source and work forward.
First question: is Claude Code even exporting?
If that prints nothing, there's your answer. The variable wasn't set. Or it was set after Claude Code started—which does nothing. Environment variables are read once, at launch. Set it, restart, try again.
Still skeptical? Bypass the whole pipeline:
Restart Claude Code. Do something. Metrics should print straight to your terminal now. If they do, the problem lives downstream. If they don't, Claude Code itself isn't instrumented correctly.
Second question: is the Collector receiving anything?
You want to see batch sizes, connection attempts, something. Silence is the bad outcome—it means nothing's arriving.
I once spent an hour convinced my Collector config was wrong. Turned out the endpoint URL had a trailing slash that broke path resolution. Check the obvious things twice.
Third: is Prometheus scraping?
Open http://localhost:9090/targets. Look for otel-collector. Status should say UP. If it says DOWN, Prometheus can't reach the Collector. Network issue. Check your Docker Compose networking.
Direct query test:
Data comes back? Good. Empty? The scrape job isn't working. Revisit prometheus.yml.
Fourth: is Grafana wired to Prometheus?
Configuration → Data Sources → Prometheus → Test.
Failure here usually means the URL is wrong. Inside Docker Compose, Grafana needs http://prometheus:9090—not localhost. Containers live in their own network namespace. localhost inside a container points to that container, not your host.
Claude Code throws errors when exporting. The Collector is running. Ports look fine. What's happening?
Here's the trap—especially on macOS or Windows with Docker Desktop.
localhost on your host machine is not the same as localhost inside a container. Claude Code runs on your host. The Collector runs in Docker. For Claude Code to reach the Collector:
This works because Docker Desktop maps container ports to your host. But if Claude Code were also containerized, you'd need the Docker network name instead:
Quick check:
Both fail? Collector isn't running, or ports aren't mapped. docker compose ps will show you the port bindings.
You sent a prompt. A minute passes. Two minutes. Dashboard still shows nothing.
This might not be broken. This might just be the pipeline doing its job.
Claude Code batches metrics and exports every 60 seconds. Prometheus scrapes every 15 seconds. Add them together: 75–90 seconds before data appears. That's normal operation, not a bug.
If you need faster feedback while debugging:
And in prometheus.yml:
Just revert these when you're done. Aggressive polling adds load for zero benefit once things work.
Collector running. Ports open. Still no data.
Check this:
The protocol has to match the port:
| Protocol | Port |
|---|---|
grpc | 4317 |
http/protobuf | 4318 |
Using grpc but pointing to 4318? Nothing works. The error messages won't make it obvious either. I've seen people debug this for hours before noticing the mismatch.
Getting 401s or 403s exporting to a secured backend?
One thing that bites people: OTLP fetches auth headers once, at startup. Token expires mid-session? Claude Code won't refresh it. Exports just start failing silently.
Workaround: put an OpenTelemetry Collector in front as a proxy. Let the Collector handle its own auth refresh:
Run a sidecar that periodically refreshes AUTH_TOKEN and restarts the Collector. Clunky. Works.
Prometheus restarting? Collector evaporating mid-session?
Check for OOM kills:
Memory limits too tight, container gets killed. No warning, no graceful shutdown. Just gone.
The defaults in our Docker Compose are conservative. If you're hitting limits:
Watch real-time usage while running a heavy session:
Prometheus complaining about too many time series. Queries crawling.
This happens when metrics have too many unique label combinations. Session IDs are often the culprit—every new session spawns new series, and Prometheus has to track them all.
If per-session breakdowns aren't essential:
You can also use metric relabeling in Prometheus to drop labels after the fact. But easier to not collect them in the first place.
When you're stuck and don't know where to start, run through this:
One of these will usually surface the problem.
Enable debug logging in the Collector:
Restart, reproduce the issue, read the output. The answer is almost always buried in there—somewhere in the wall of text.
If you're asking for help, grab three things: your docker-compose config, the Collector logs, and env | grep OTEL. That's what anyone debugging with you will need.
You now have a working system that answers a simple question: where does the money go?
Before this setup, Claude Code usage was a mystery. Tokens vanished into API calls. Bills arrived without explanation. Now you can trace every dollar to a specific session, model, or task. That's the point of all this infrastructure—not dashboards for their own sake, but clarity.
The infrastructure itself is simple. Collector, Prometheus, Grafana—three containers, one docker-compose up -d. Nothing proprietary. Your data never leaves your machine unless you want it to.
But the value isn't in the tools. It's in what they reveal.
Watch your metrics for a week. You'll learn things. Which models you actually reach for. Whether your prompting habits are improving or just burning tokens in new ways. The sessions that cost $12 and the ones that cost $0.40—and why.
Some questions take longer to answer. Is the cost per commit trending down? Are there problem types where Claude Code consistently spins its wheels? Which projects justify heavy token spend, and which ones don't?
The dashboard won't answer those automatically. But it gives you the data to figure it out.
If you outgrow Docker Compose—need remote access, multiple developers, less babysitting—Sealos or similar platforms run the same stack with less friction. For teams tracking ROI seriously, Anthropic's monitoring guide shows how to tie these metrics to project outcomes.
Next month's invoice will still arrive. The difference is you'll see it coming—and you'll know exactly which decisions put those numbers there.
此内容由惯性聚合(RSS阅读器)自动聚合整理,仅供阅读参考。 原文来自 — 版权归原作者所有。