







Picture this: You're running one of the world's most ambitious cloud platforms, serving nearly 200,000 users across 40,000 instances. Your users create applications, hit deploy, and then... wait. And wait. What should take seconds stretches into agonizing minutes - sometimes even half an hour - before their domains become accessible.
This was our reality at Sealos Cloud. Our Nginx Ingress had reached its breaking point, crushed under the weight of explosive growth. The migration to Higress initially promised relief, but as we scaled beyond 20,000 Ingress configurations on a single Kubernetes cluster, a new nightmare emerged: our gateway was suffocating under its own success.
The Brutal Numbers:
Once a cluster exceeded 10,000 Ingress entries, each new gateway configuration triggered an avalanche of computational overhead. During traffic spikes, new domains could take over thirty minutes to go live - an eternity in the cloud-native world where speed is everything.
Armed with profiling tools and unwavering determination, we embarked on a forensic investigation that would take us deep into the heart of modern service mesh architecture. Our journey would lead us through four critical layers:
Understanding the problem required dissecting how Higress processes Ingress changes. The architecture reveals two critical components:
The Control Plane (The Brain): When users modify an Ingress, Higress's embedded Istio fetches the cluster's complete configuration, patches in the changes, and transmits the updated gateway configuration. This orchestration layer seemed like the obvious culprit.
The Data Plane (The Muscle): Envoy receives these configurations and performs the actual traffic routing. It intelligently updates only what has changed, but this "intelligence" came with a devastating cost we were about to discover.
The core challenge? Every domain requires its complete TLS configuration embedded in a filterchain. Even when thousands of domains share identical TLS settings, the system cannot reuse configurations. As domain counts exploded, configuration files became monstrous, creating cascading performance disasters.
Armed with Go's built-in pprof tool and flame graphs, we began our systematic investigation.
Our initial investigation focused on Istio's control plane, where flame graphs revealed two performance villains:
Deep within Istio's lds cache lurked a function with an innocent name but devastating impact. GetGatewayByName was performing O(n²) enumeration comparisons across all filterchains - essentially checking every filterchain against every other filterchain in a computational death spiral.
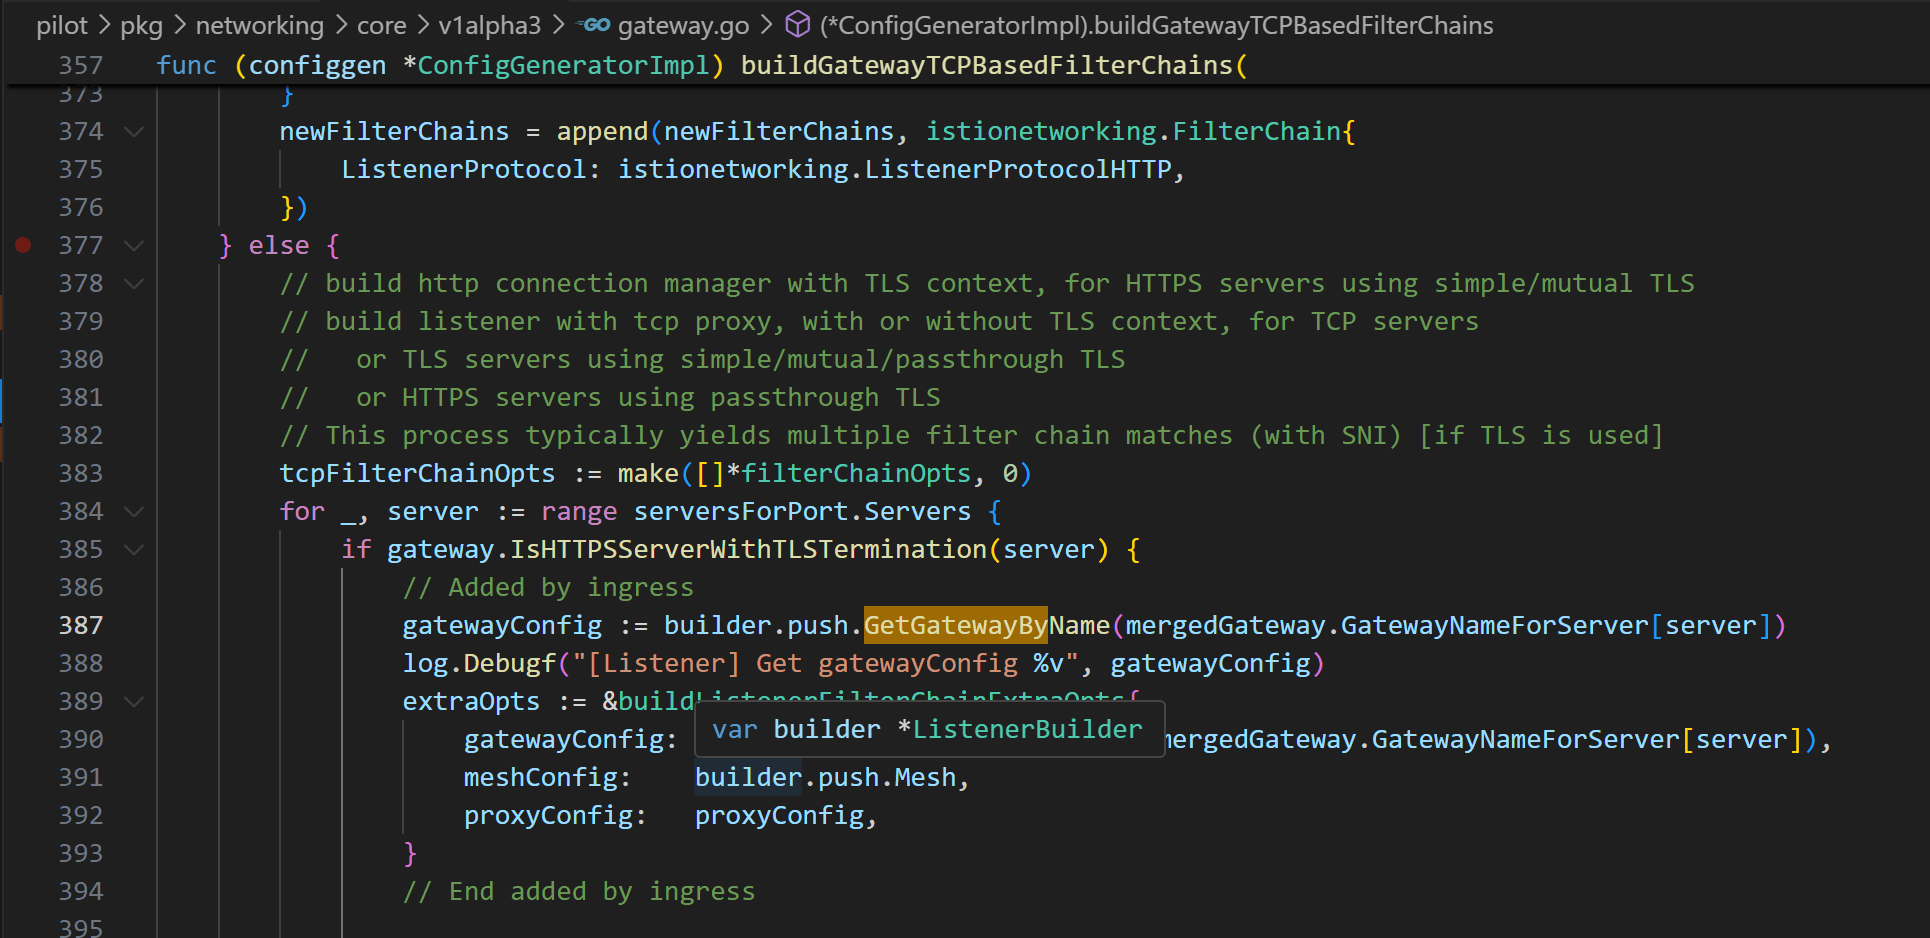 GetGatewayByName inefficient code example
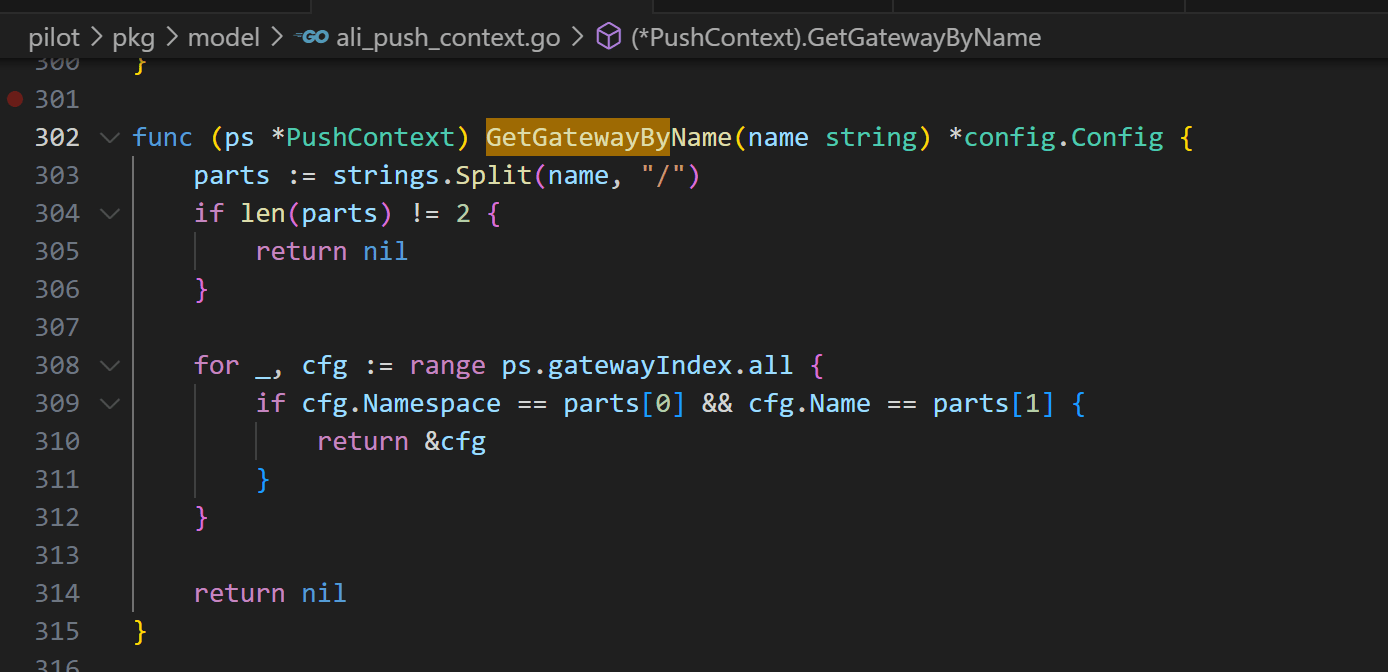 GetGatewayByName inefficient code example
The solution was elegantly simple: replace brute-force enumeration with preprocessed hashmaps. What had been a quadratic nightmare became a constant-time lookup.
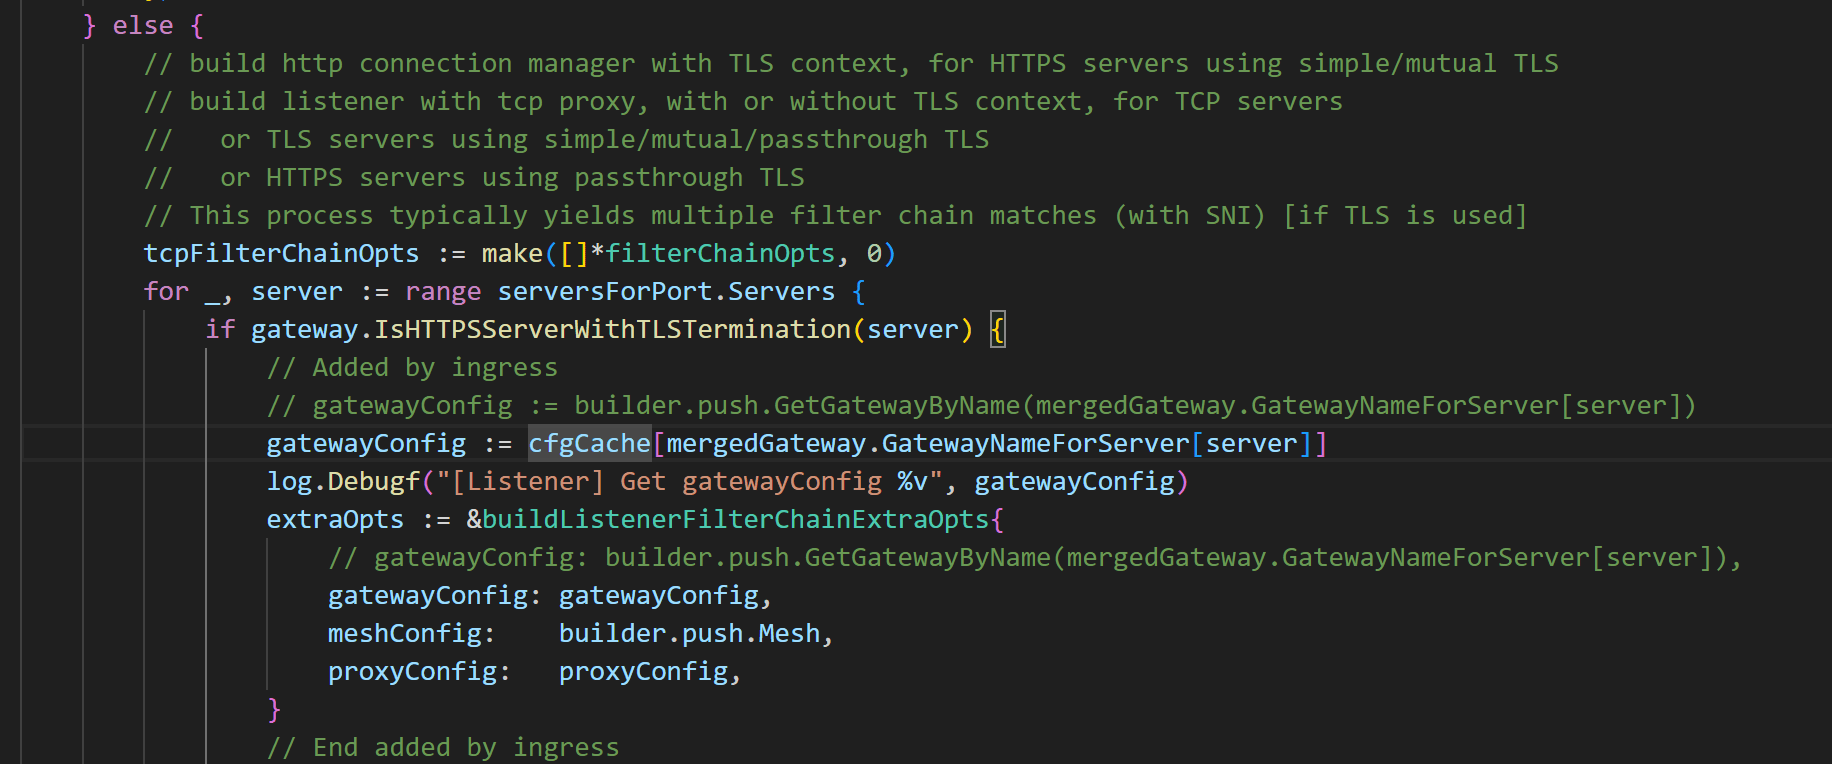 Optimized GetGatewayByName code
Istio's configuration patching process revealed another performance killer. The system converted configuration data to protobuf.Message, performed merges, then converted everything back - a process that constantly allocated memory and performed expensive string operations.
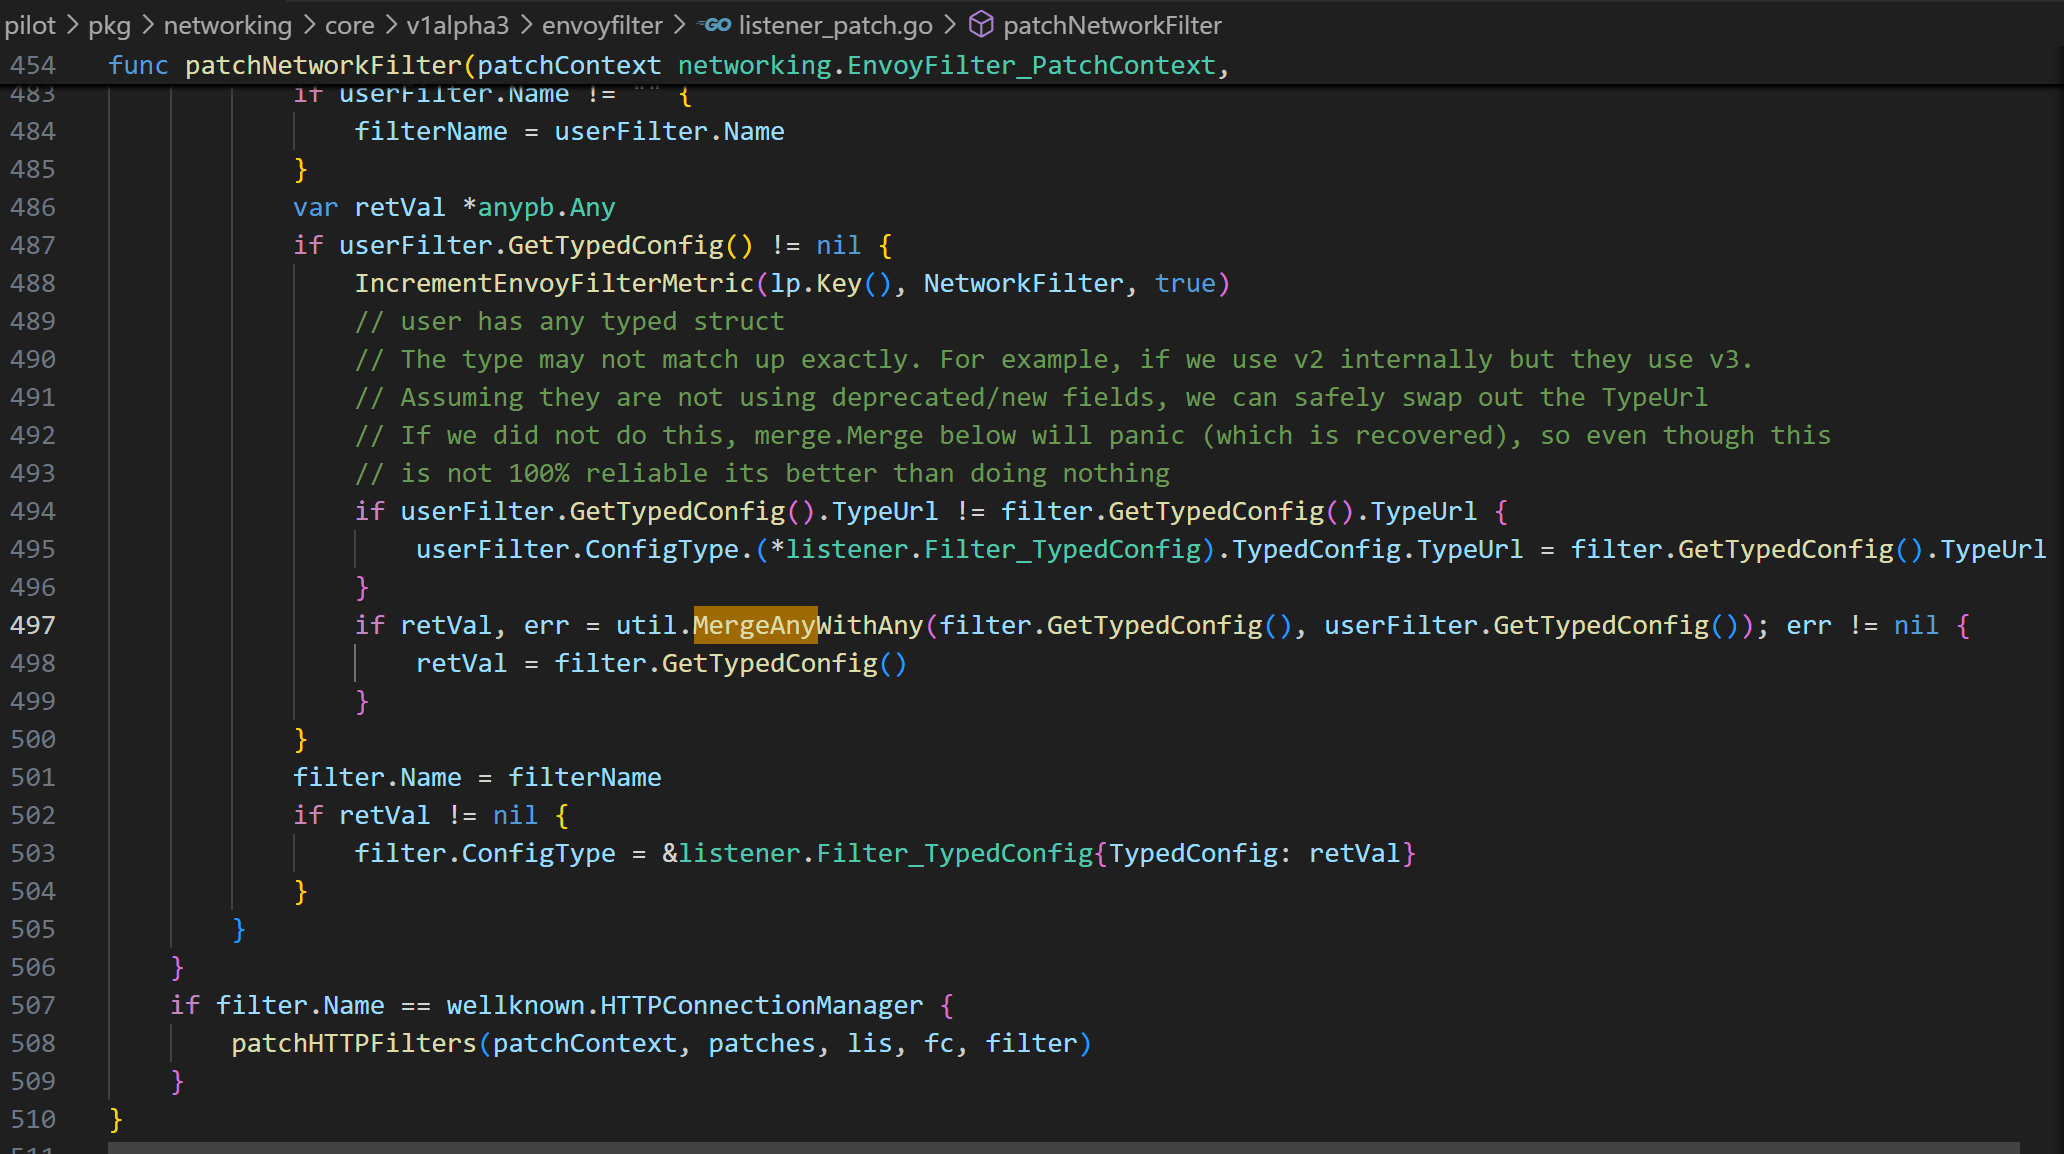 Istio Protobuf serialization and deserialization causing Higress performance overhead code
Rather than rewriting Istio's entire merge system (an impractical endeavor), we implemented strategic caching. Our breakthrough: ensure each object is serialized and deserialized only once, regardless of how many merge operations occur.
The results were immediate - controller performance improved by over 50%, with flame graphs showing our former bottlenecks had virtually disappeared.
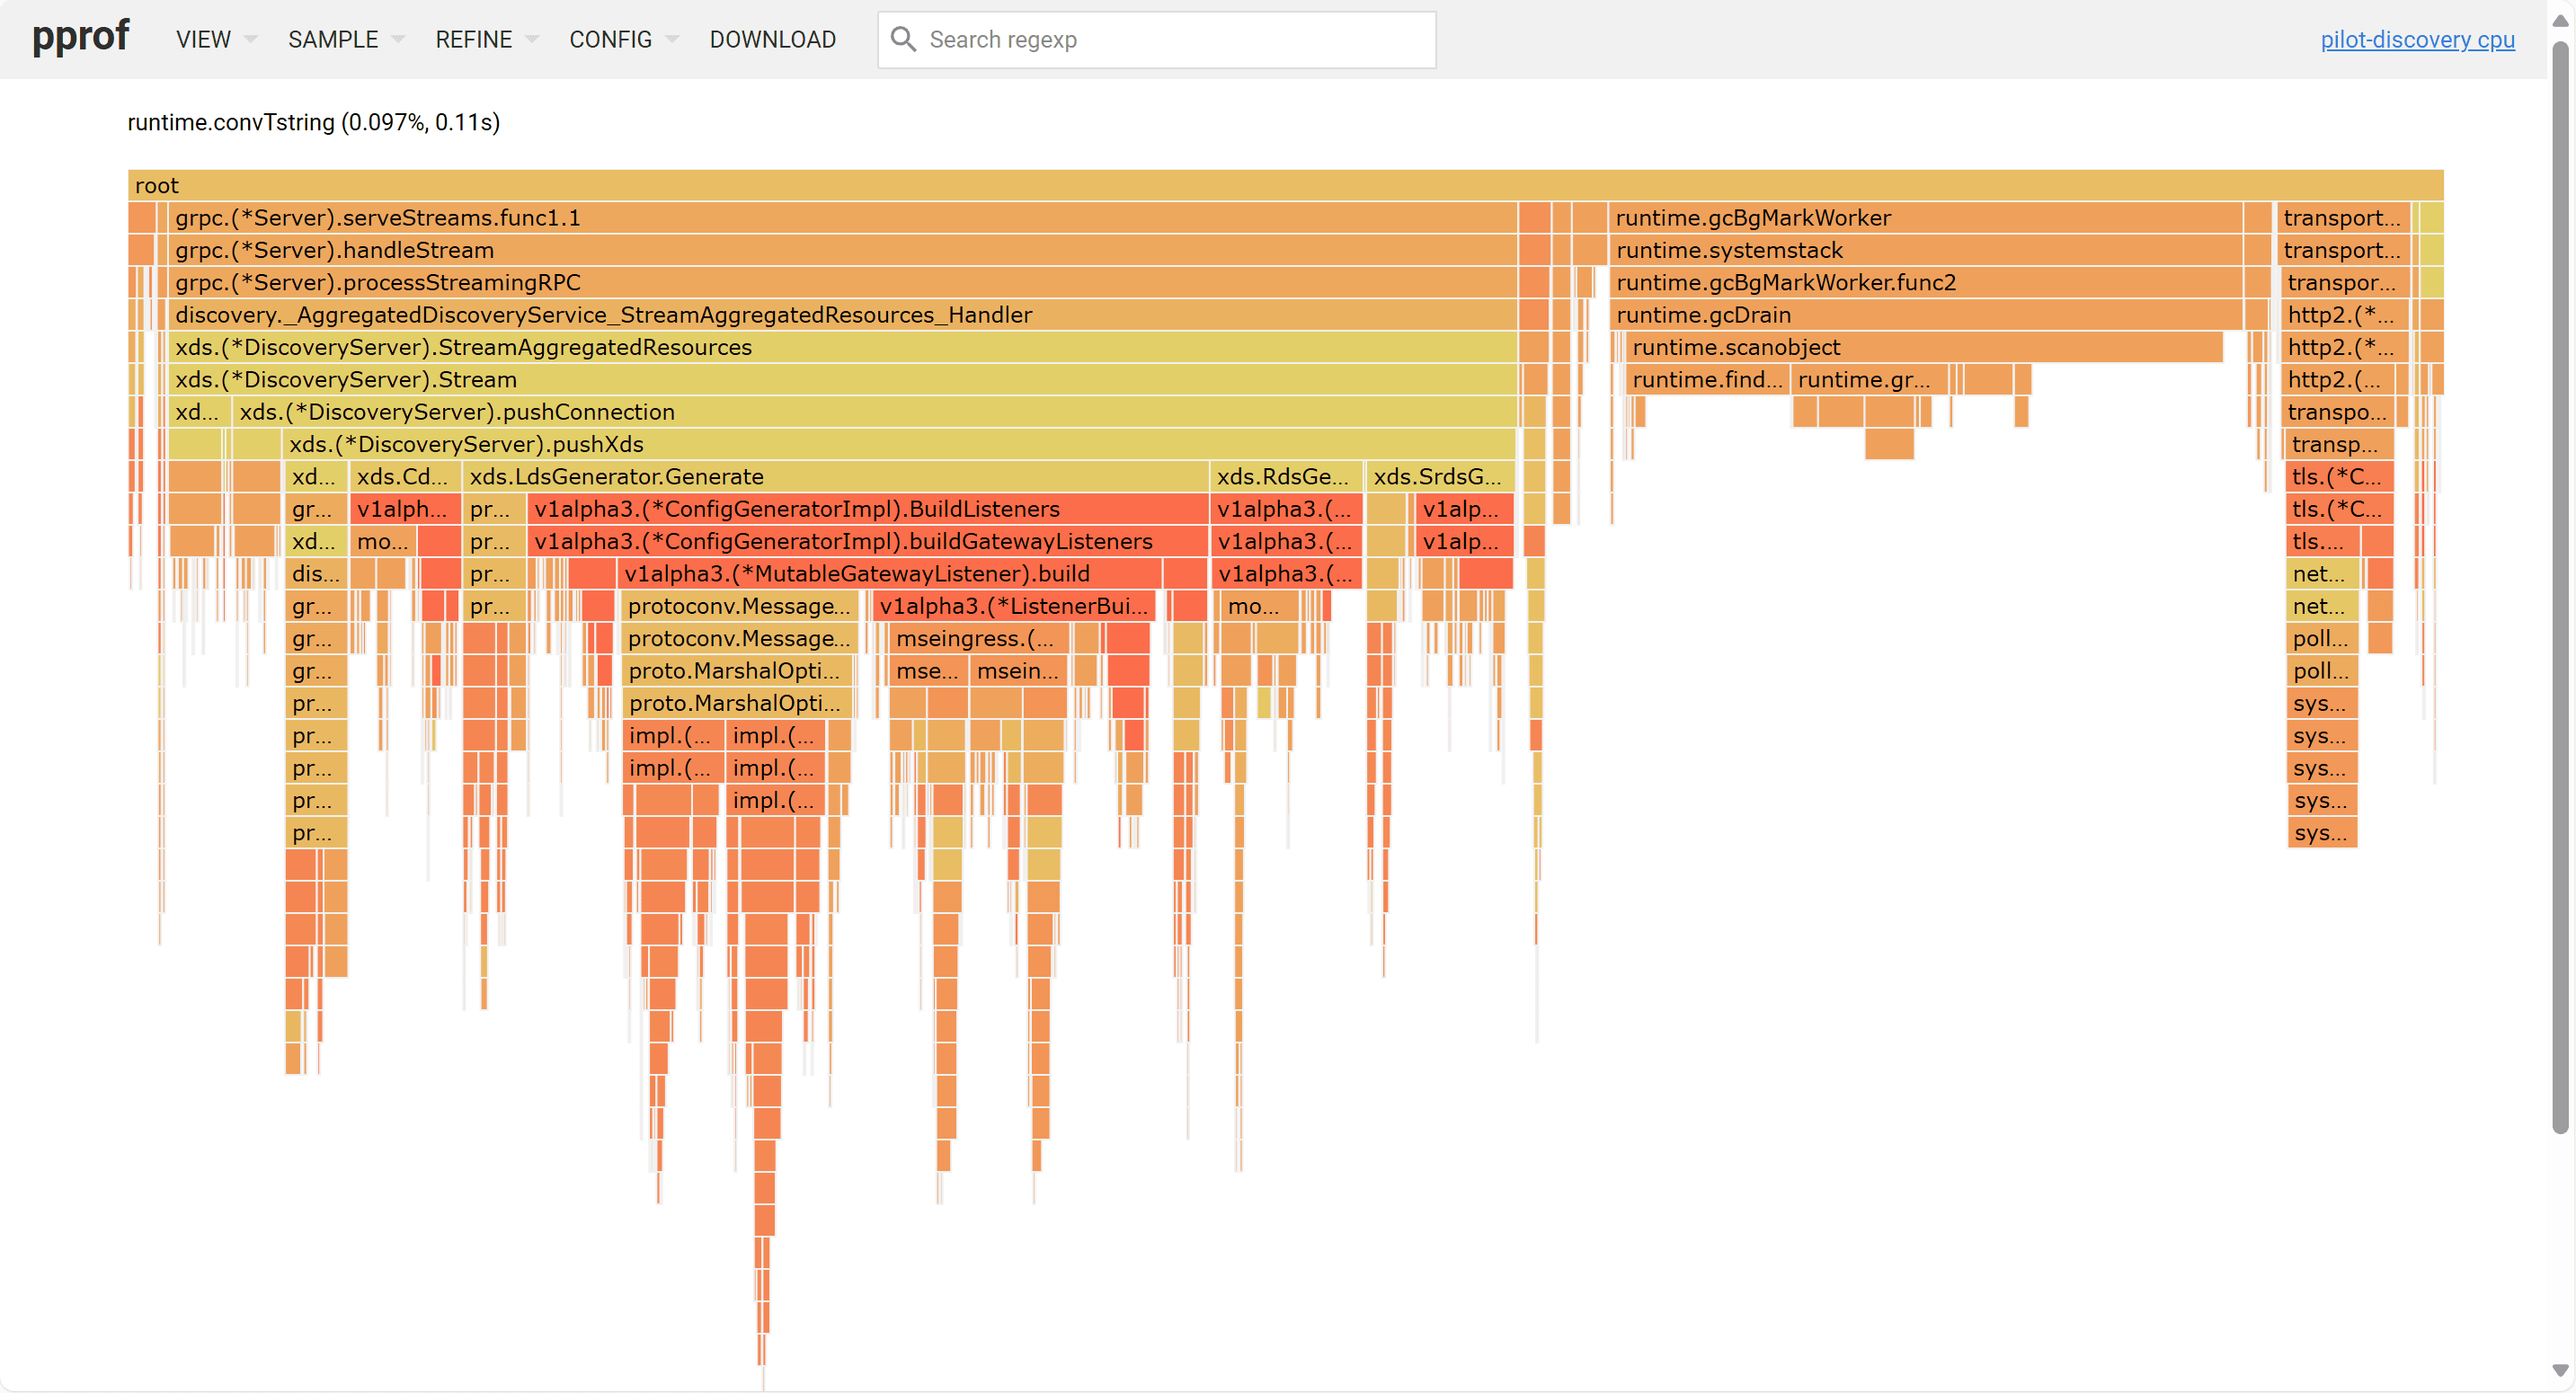 Istio control plane optimized flame graph
The complete implementation can be found in our optimized codebase: https://github.com/luanshaotong/istio/compare/istio-1.19...luanshaotong:istio:test
Despite our control plane victories, end-to-end performance remained stubbornly slow. The real monster was lurking in Envoy's data plane, where single-threaded processing created a devastating bottleneck.
Envoy is an open-source service mesh proxy written in C++ (optimized version by Higress). To analyze its performance, we employed perf and FlameGraph.pl tools to generate comprehensive flame graphs during data plane startup.
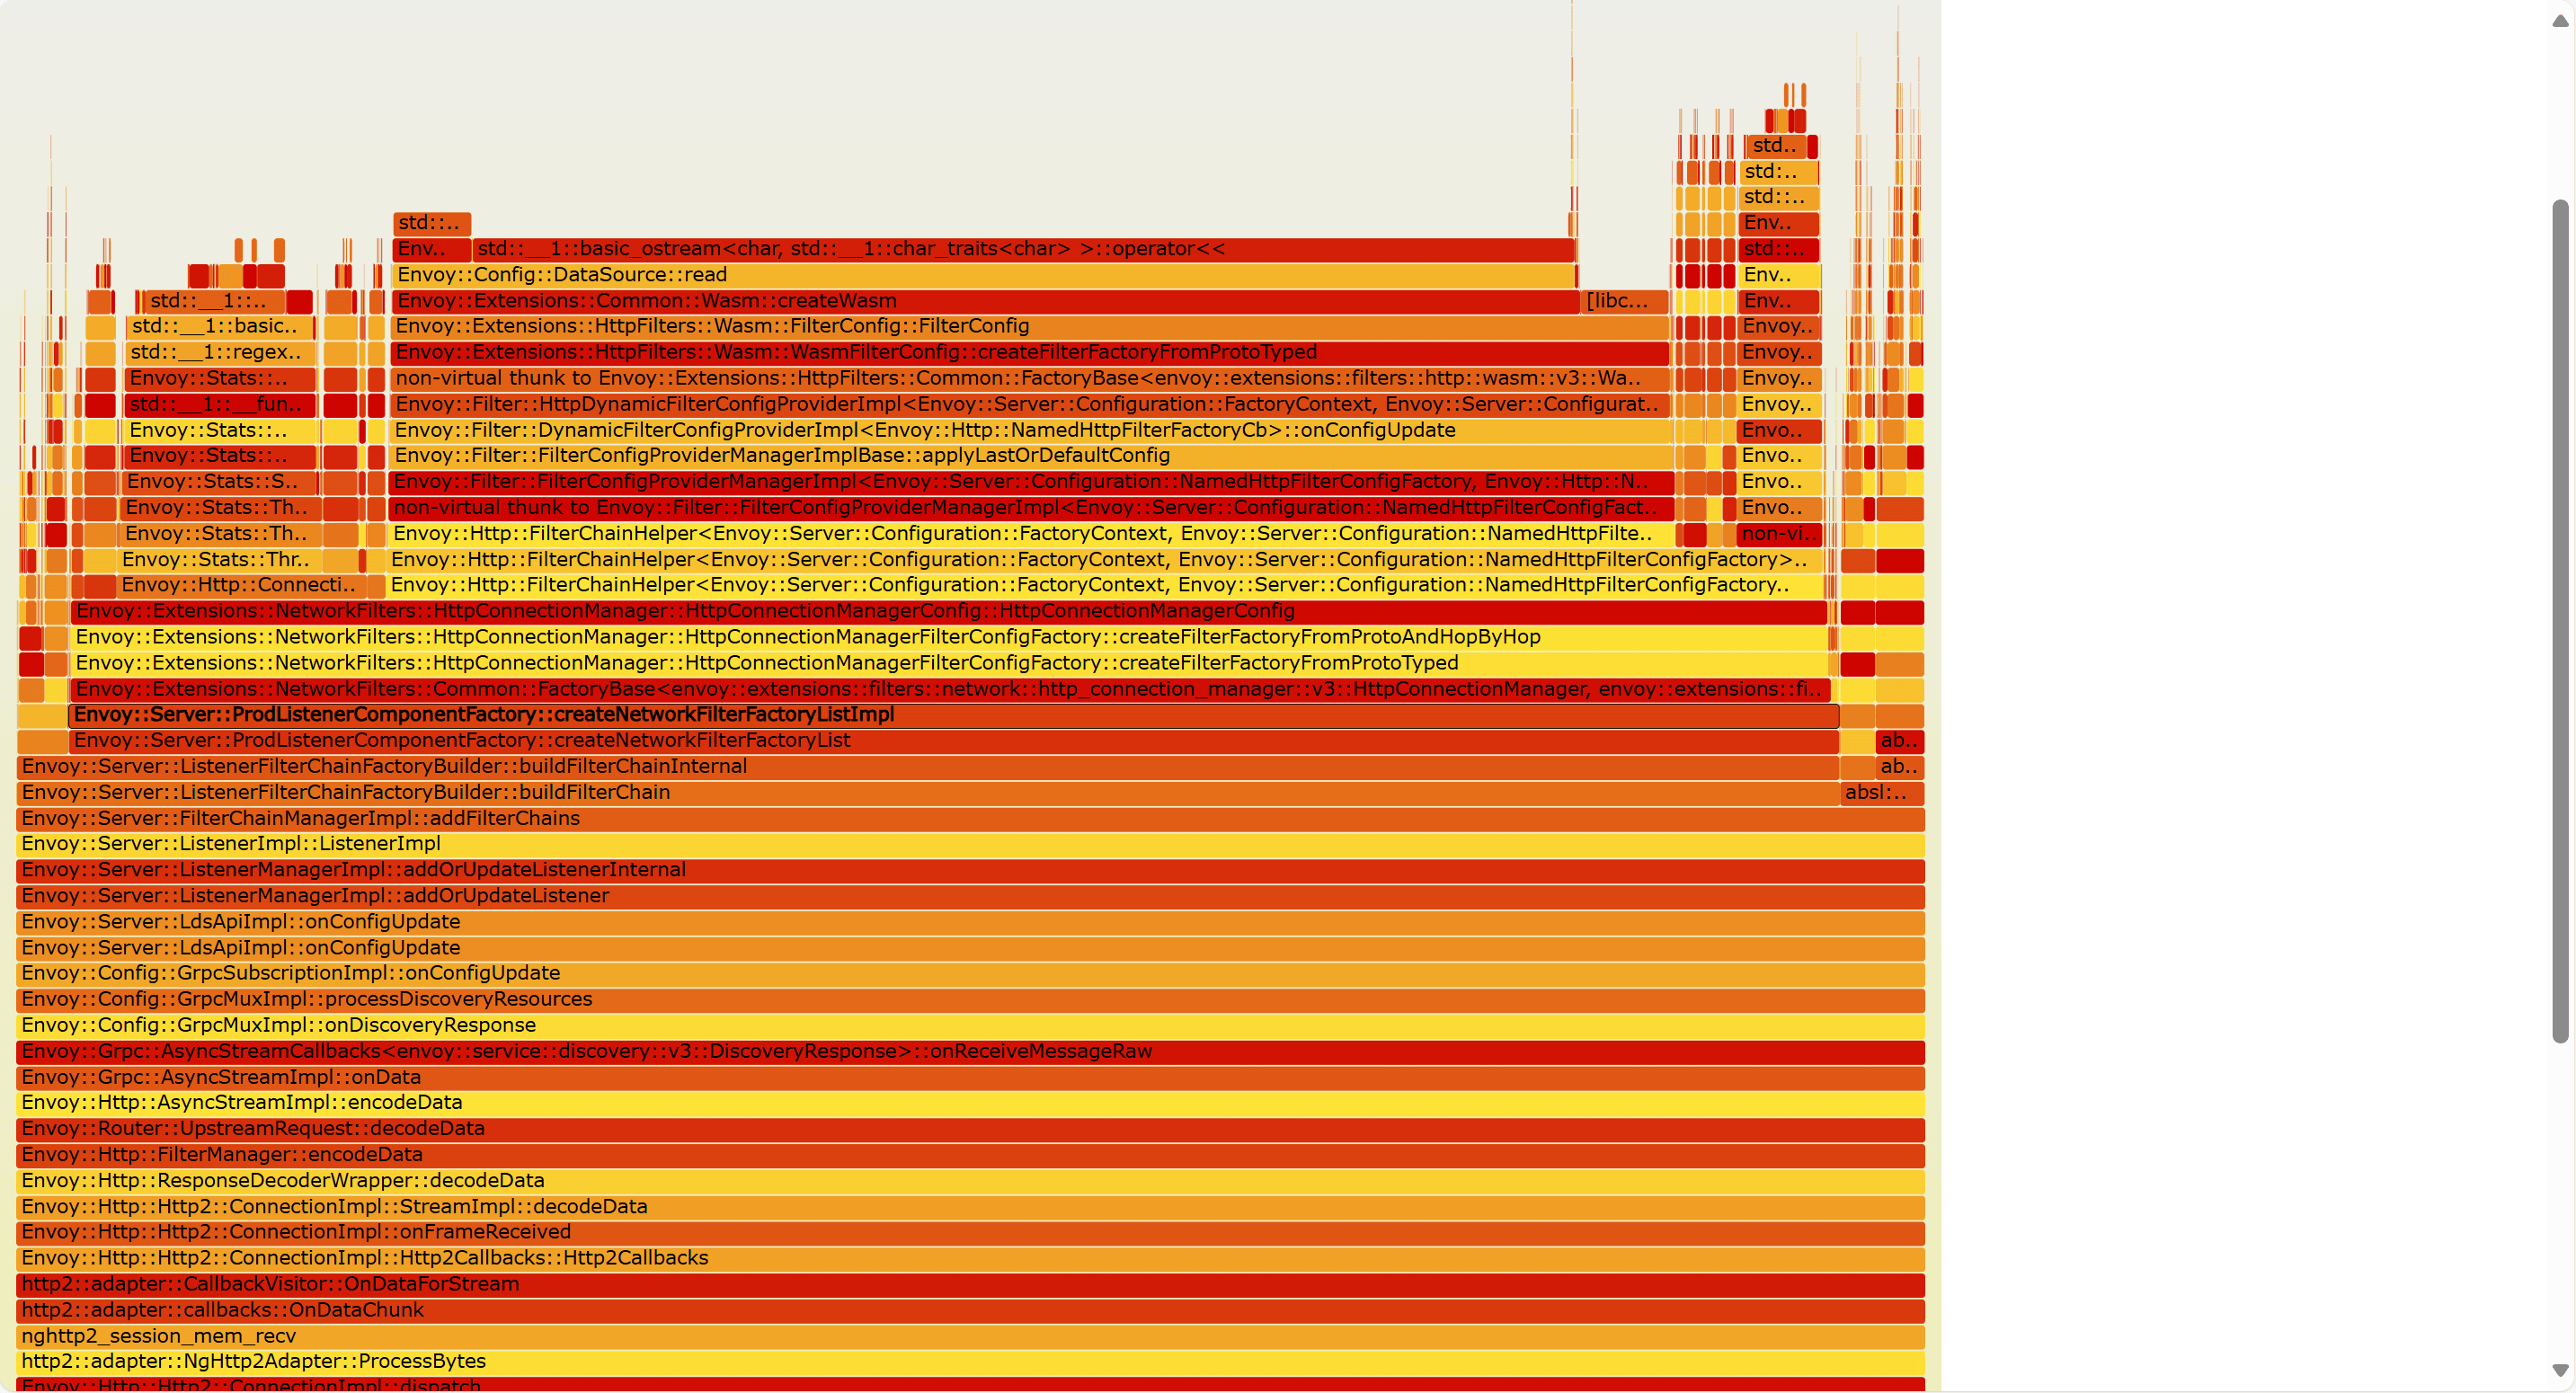 Envoy startup flame graph
Envoy's flame graphs revealed a shocking truth: the vast majority of processing time was consumed by protobuf serialization. To understand why, we dove deep into Envoy's change detection mechanism.
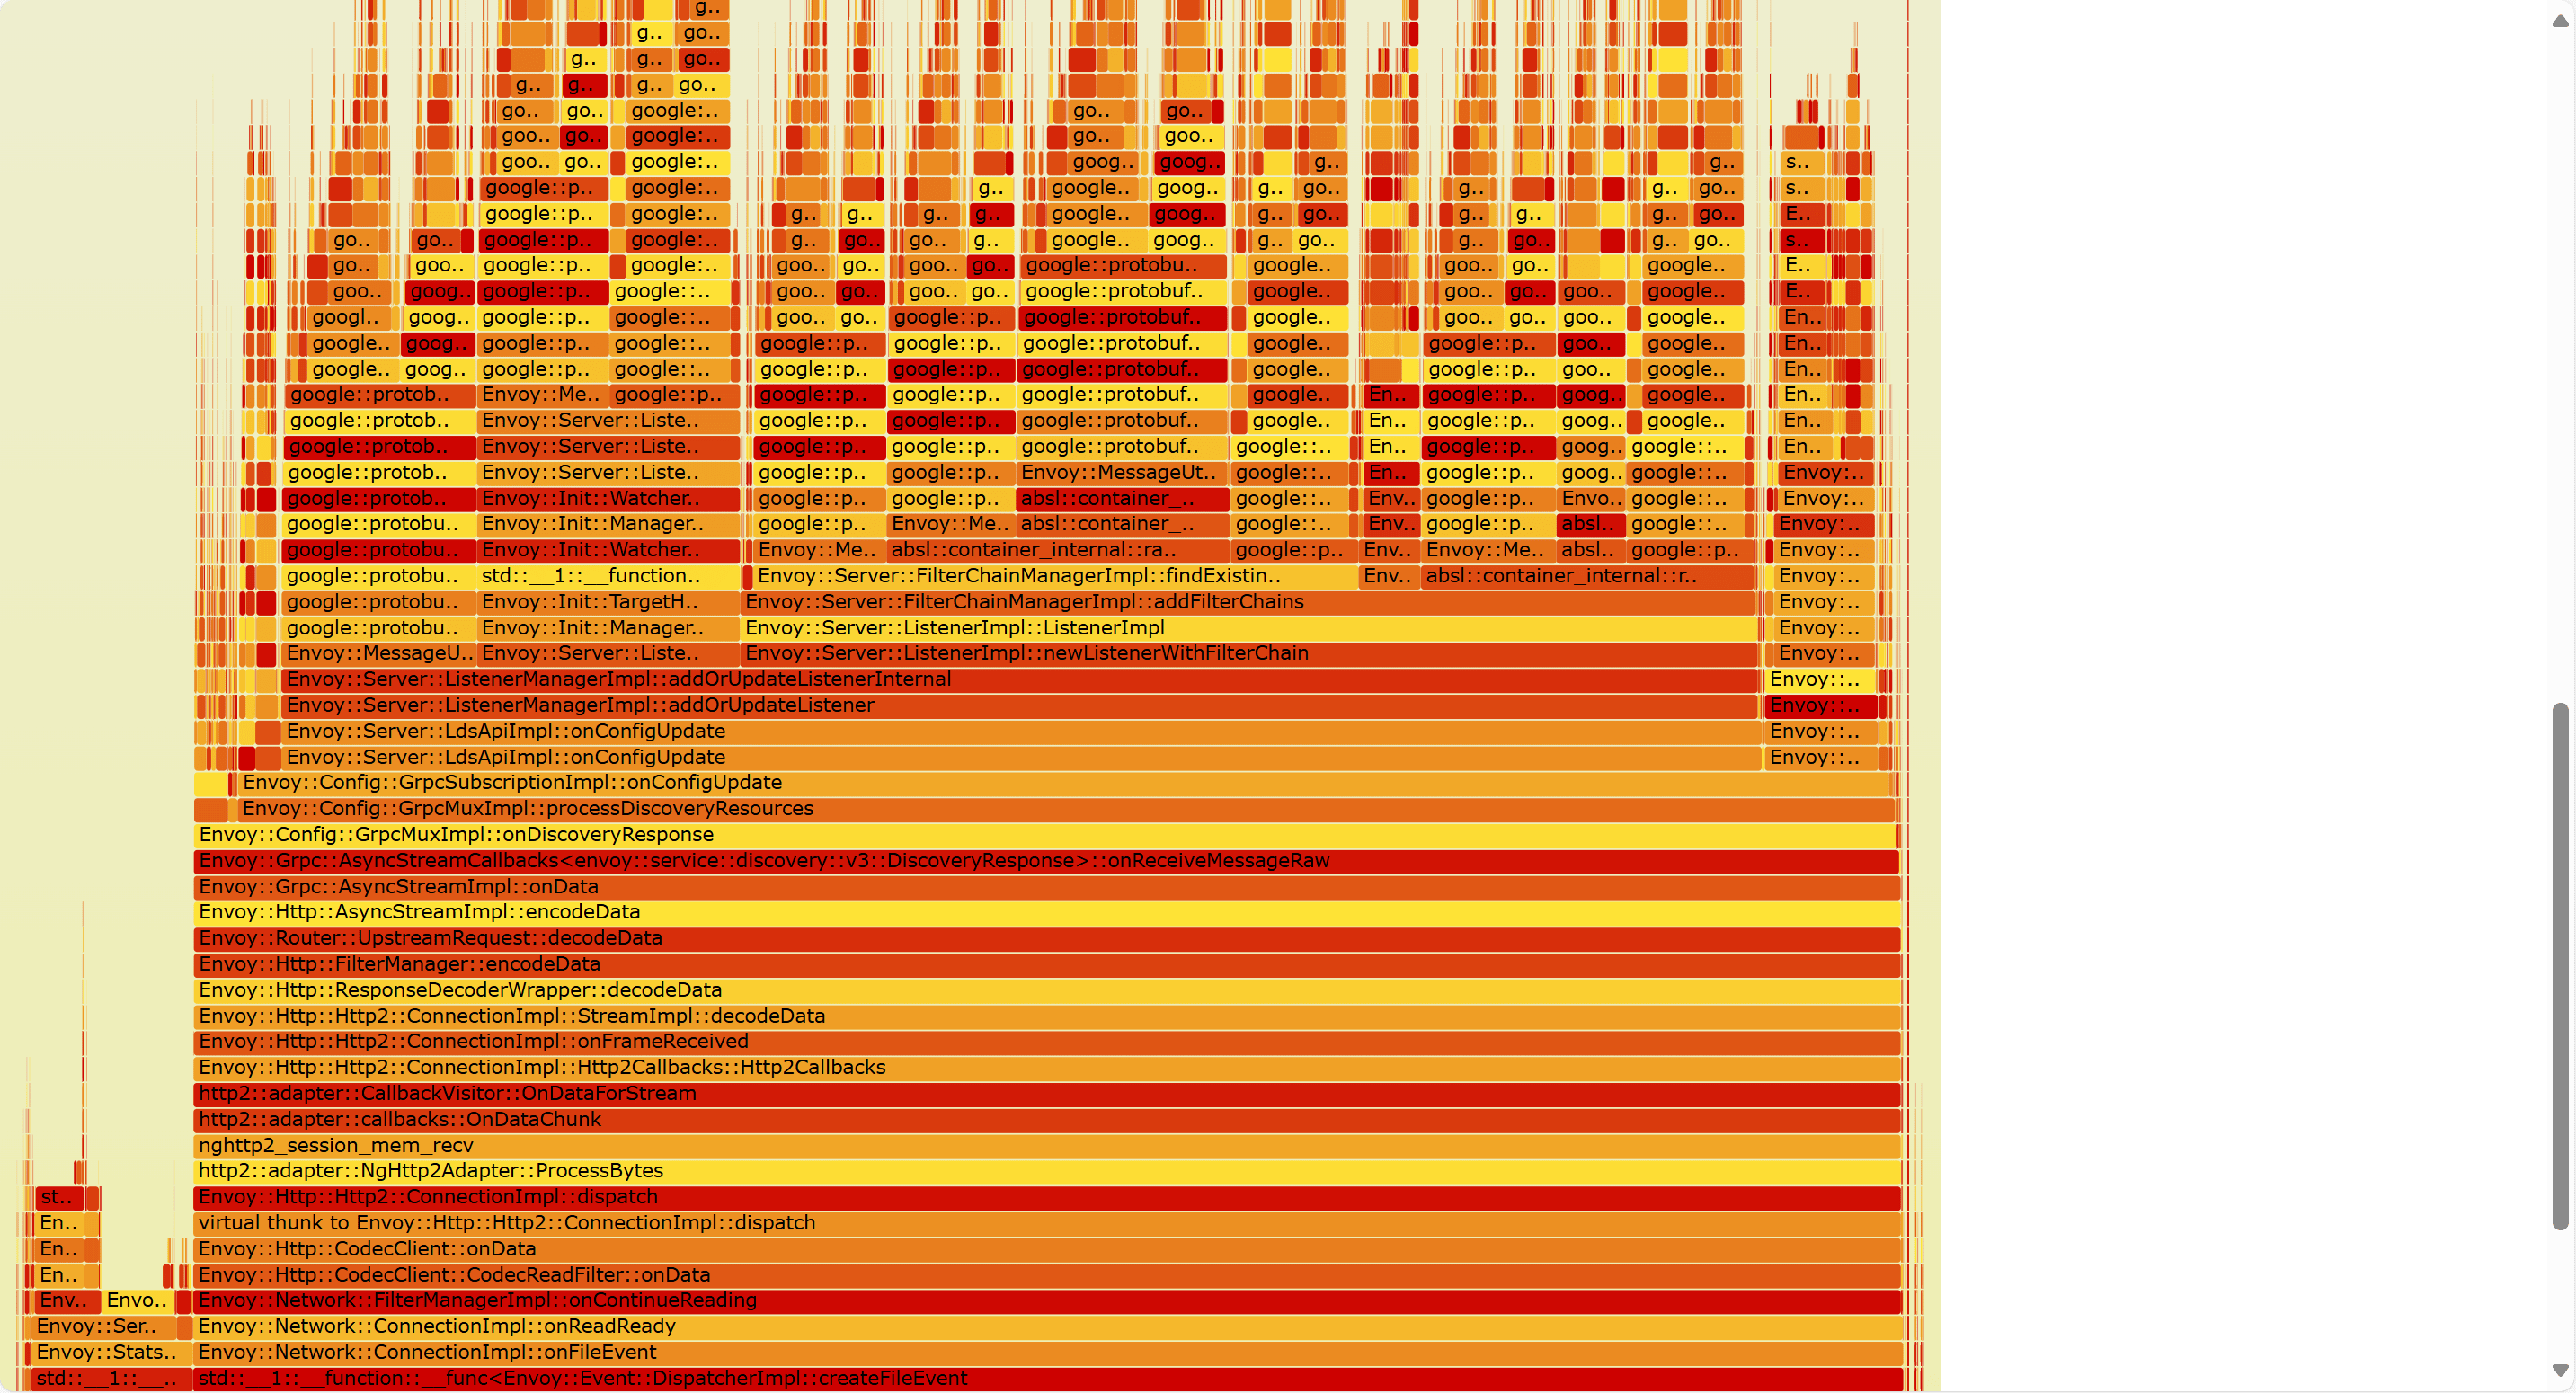 Envoy Ingress change flame graph
Here's the elegant problem: How does Envoy identify which filterchains have changed among 10,000 entries when:
The original Envoy implementation serializes the entire filterchain configuration and uses that as a hashmap key for lookups. For the hash function, they chose xxhash because of its speed - but even fast hashing becomes expensive when applied to massive serialized configurations.
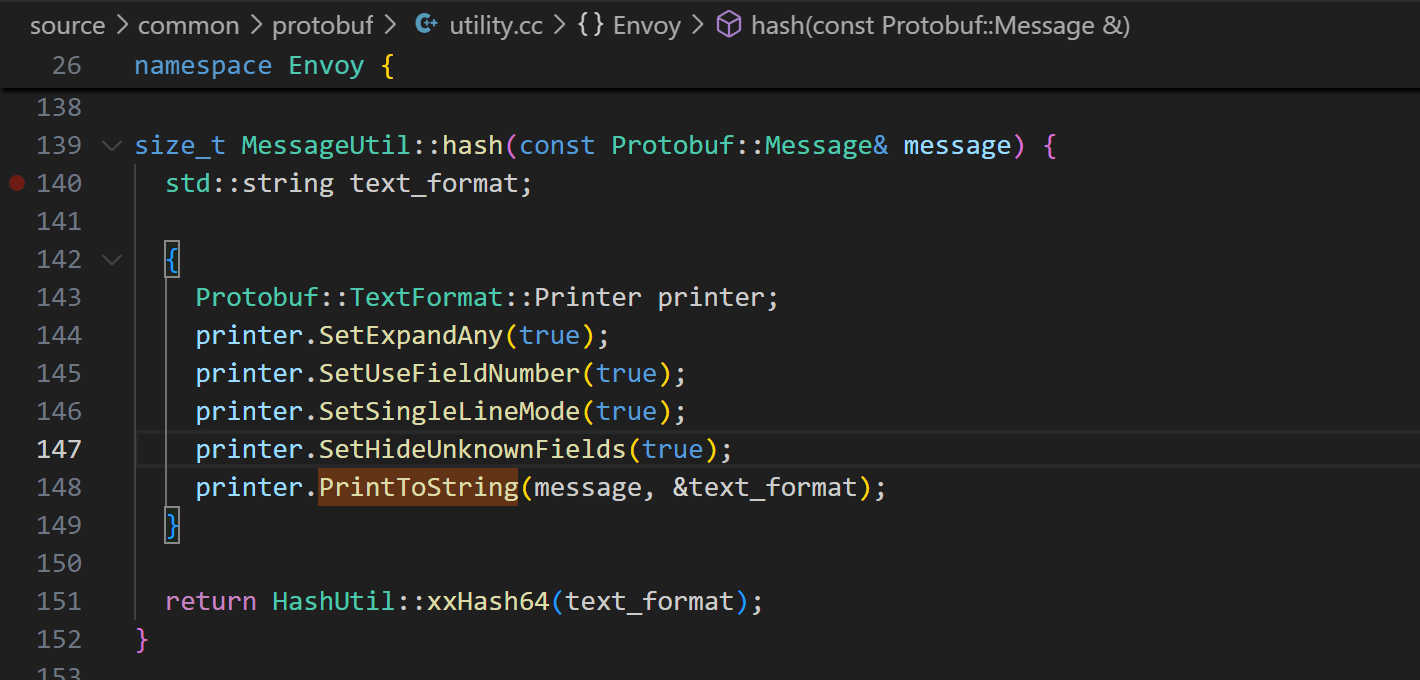 Envoy hashing serialized filterchain content with xxhash
The situation was worse than we initially realized. Envoy's use of absl::flat_hash_map meant hash functions were called repeatedly - not just for lookups, but for assignments and updates. With 20,000+ filterchains, these seemingly innocent operations multiplied into performance armageddon.
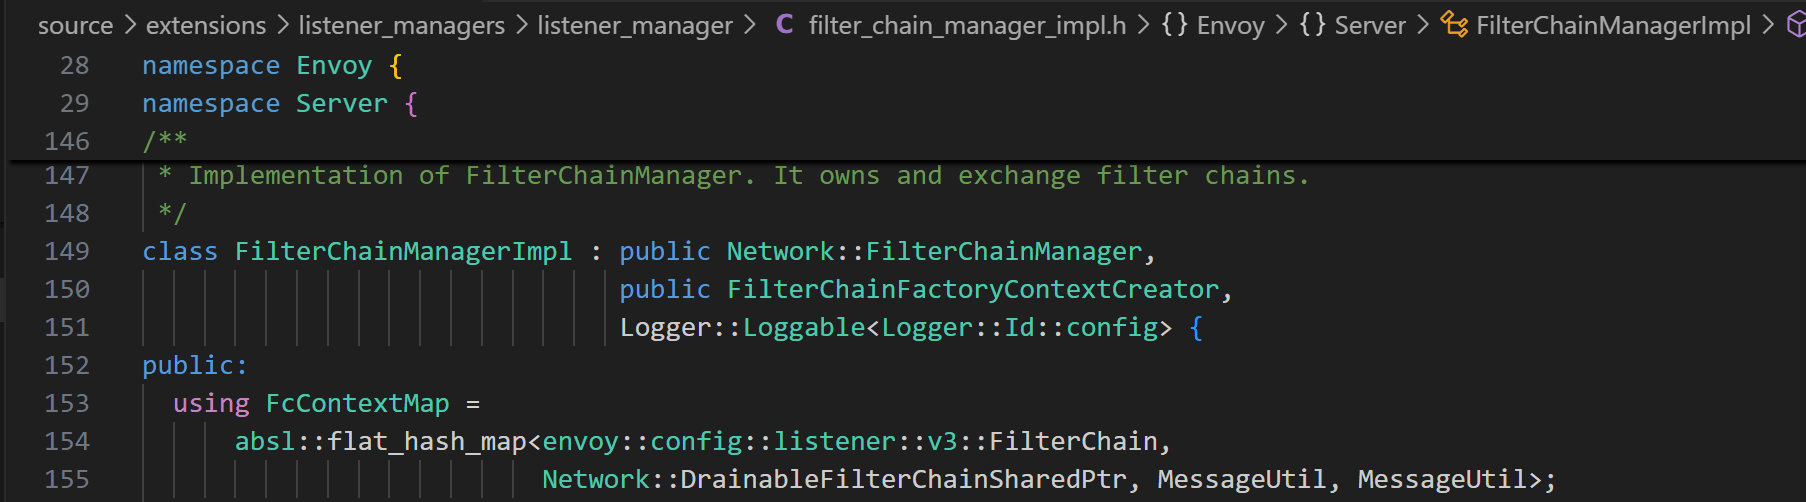 Envoy's absl::flat_hash_map repeatedly calling hash functions
Our solution required surgical precision across multiple system layers:
We abandoned serialization entirely, implementing recursive hashing where a type's hash value is calculated from its subfields' hash values. This eliminated expensive string formatting and memory allocation cycles.
We implemented comprehensive hash caching, even modifying Protobuf::Message to enable cache copying. This prevented redundant hash calculations across system layers.
Our CachedMessageUtil class, built upon Protobuf foundations, minimized Envoy modifications while maximizing performance gains. This approach reduced maintenance overhead for future upgrades while delivering dramatic improvements.
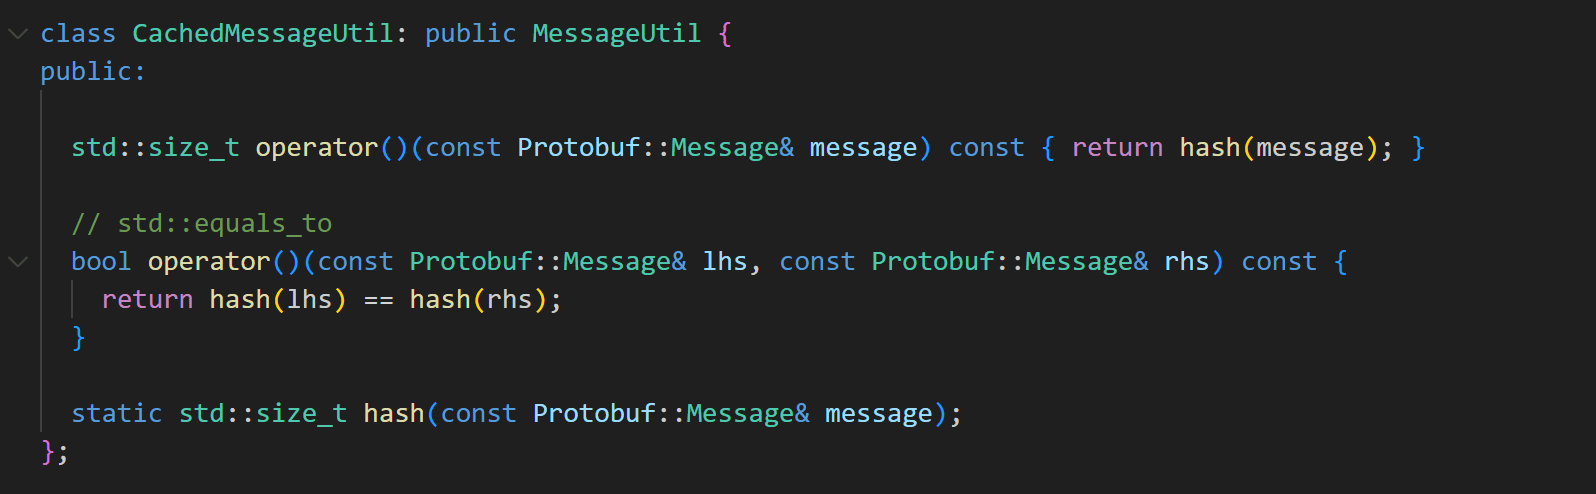 Our CacheMessageUtil class implements Protobuf hash value caching
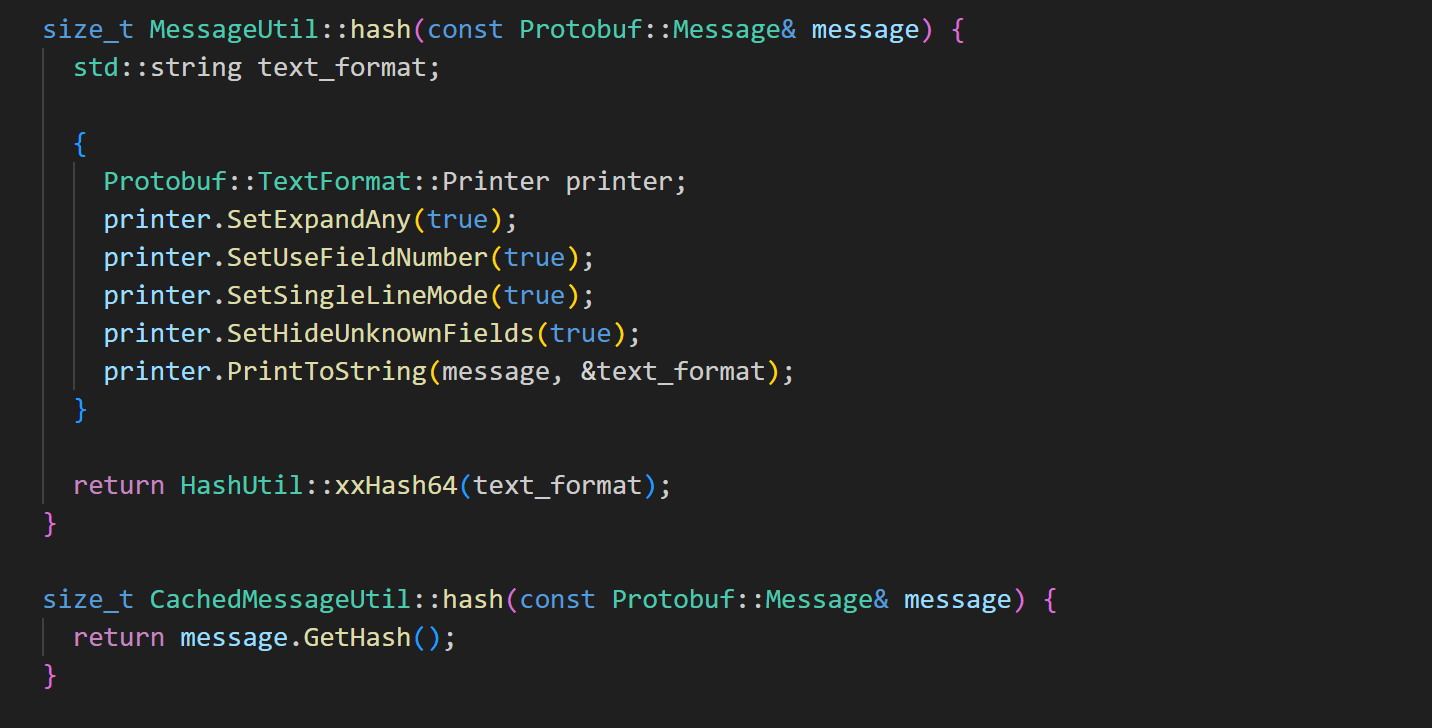 Our hash function vs the original hash function
The transformation was remarkable. Post-optimization flame graphs showed that our targeted bottlenecks now consumed only a fraction of total processing time.
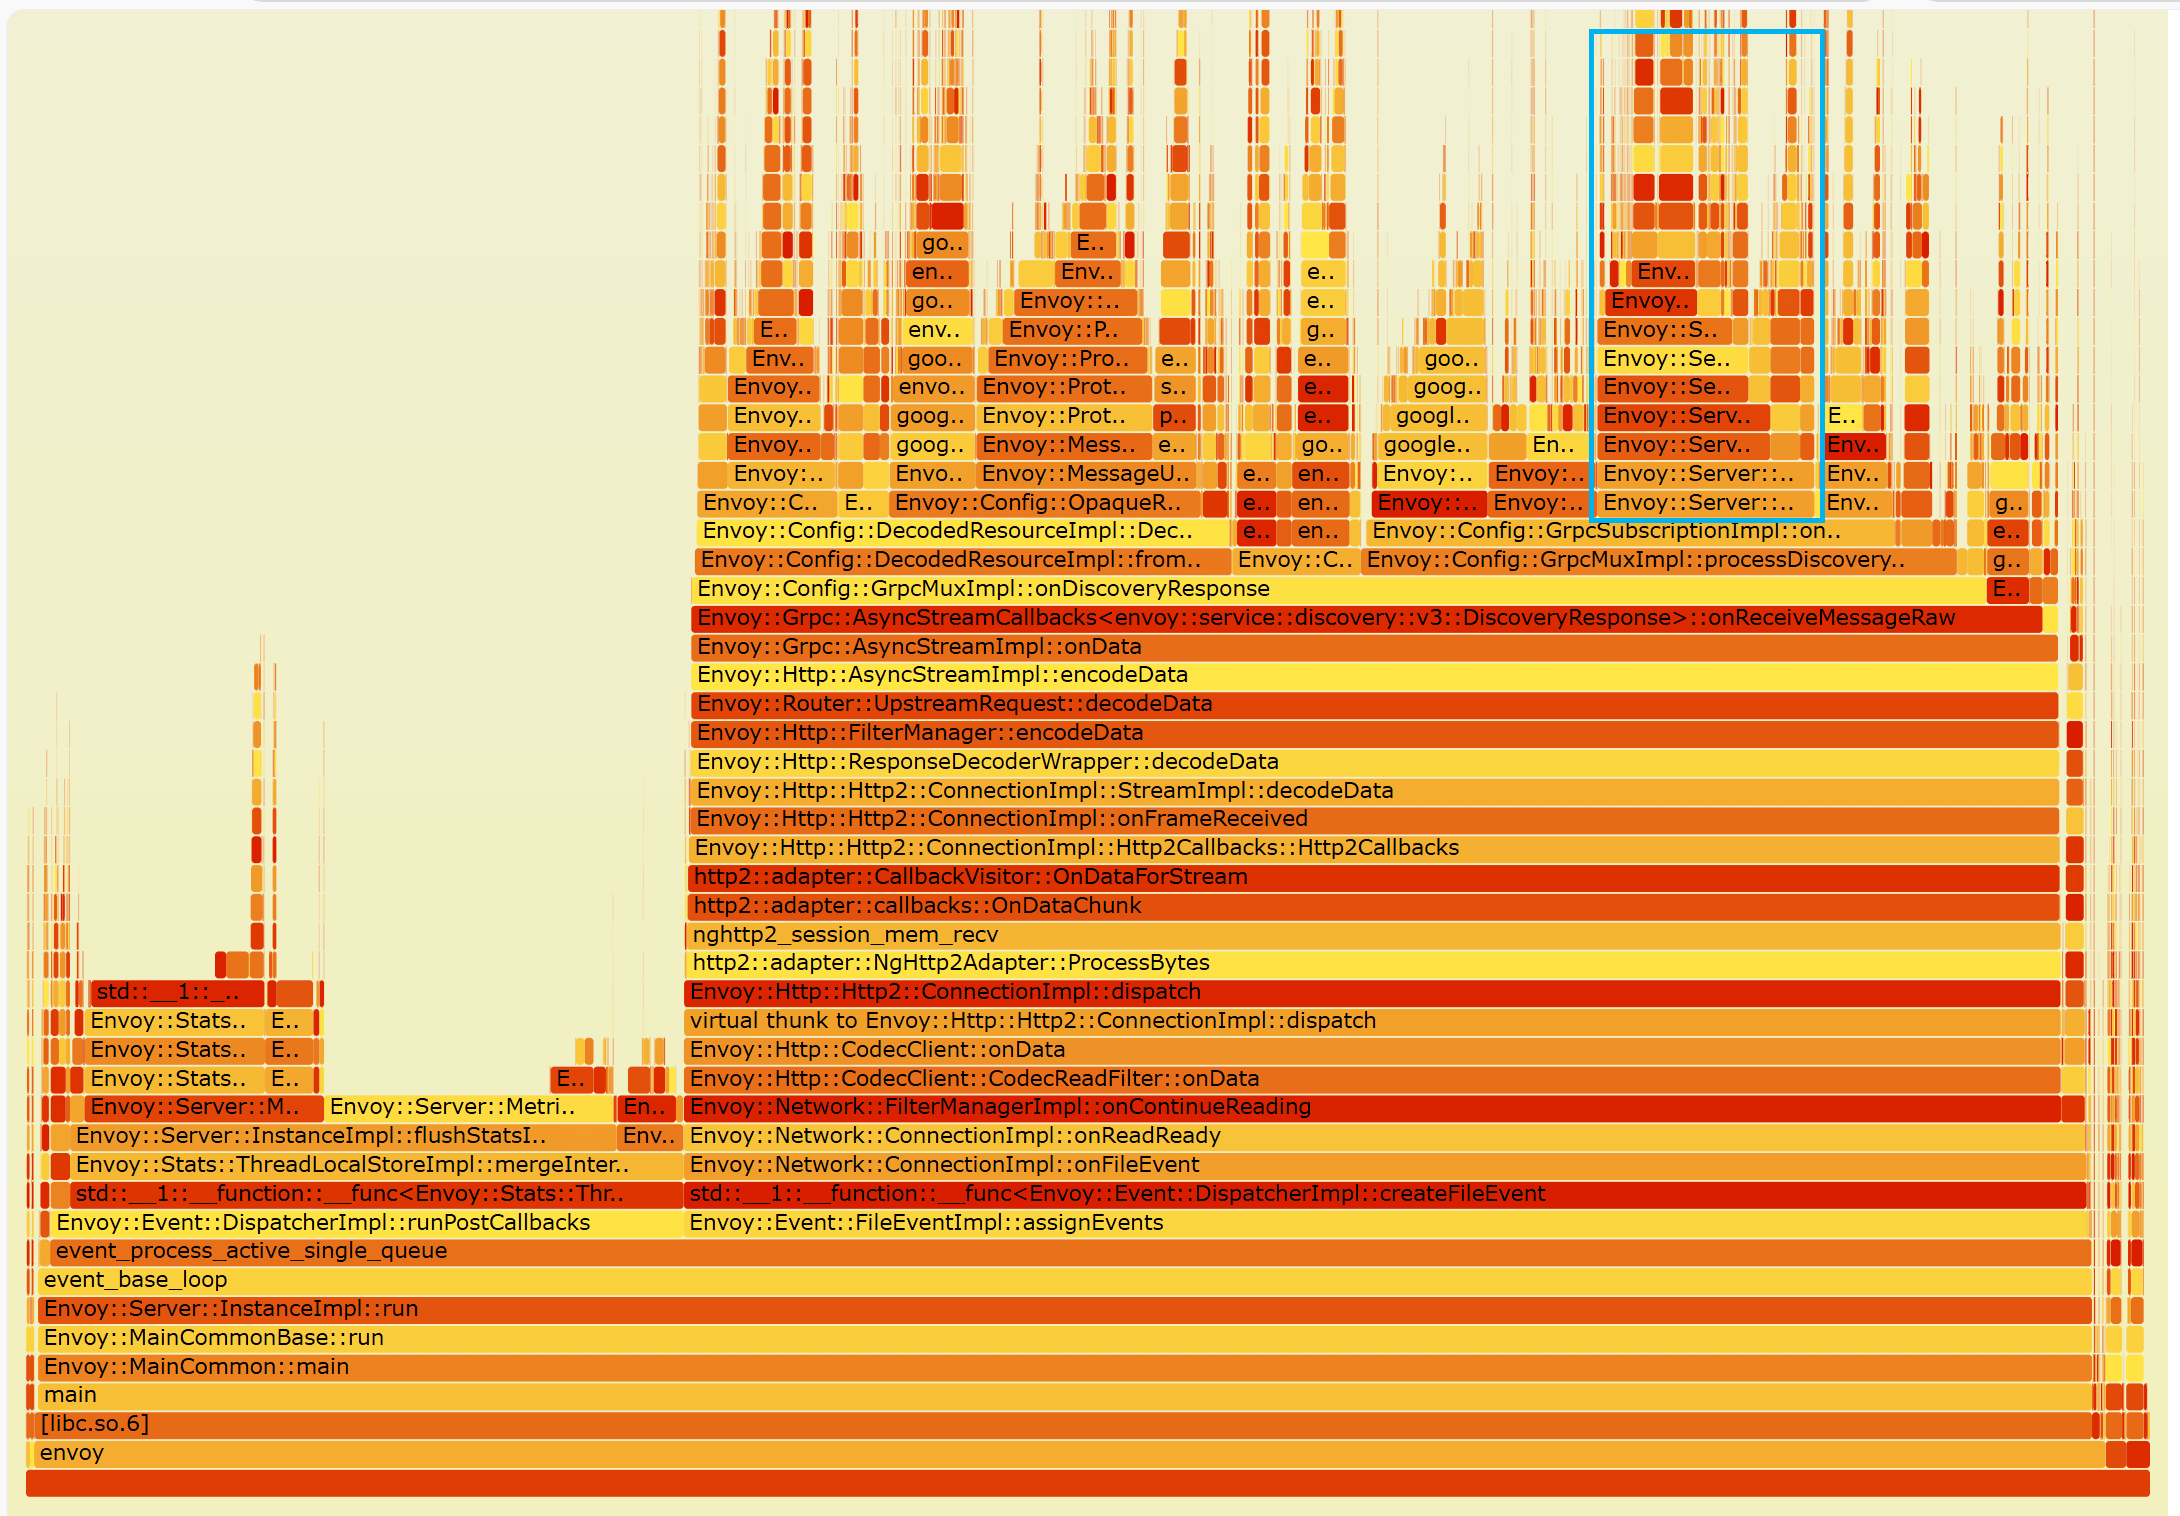 Flame graph after Envoy data plane optimization
Testing with 7,000 active Ingresses revealed stunning improvements:
| Metric | Before Optimization | After Optimization | Improvement |
|---|---|---|---|
| Ingress Response Time | 47 seconds | 2.3 seconds | 20x faster |
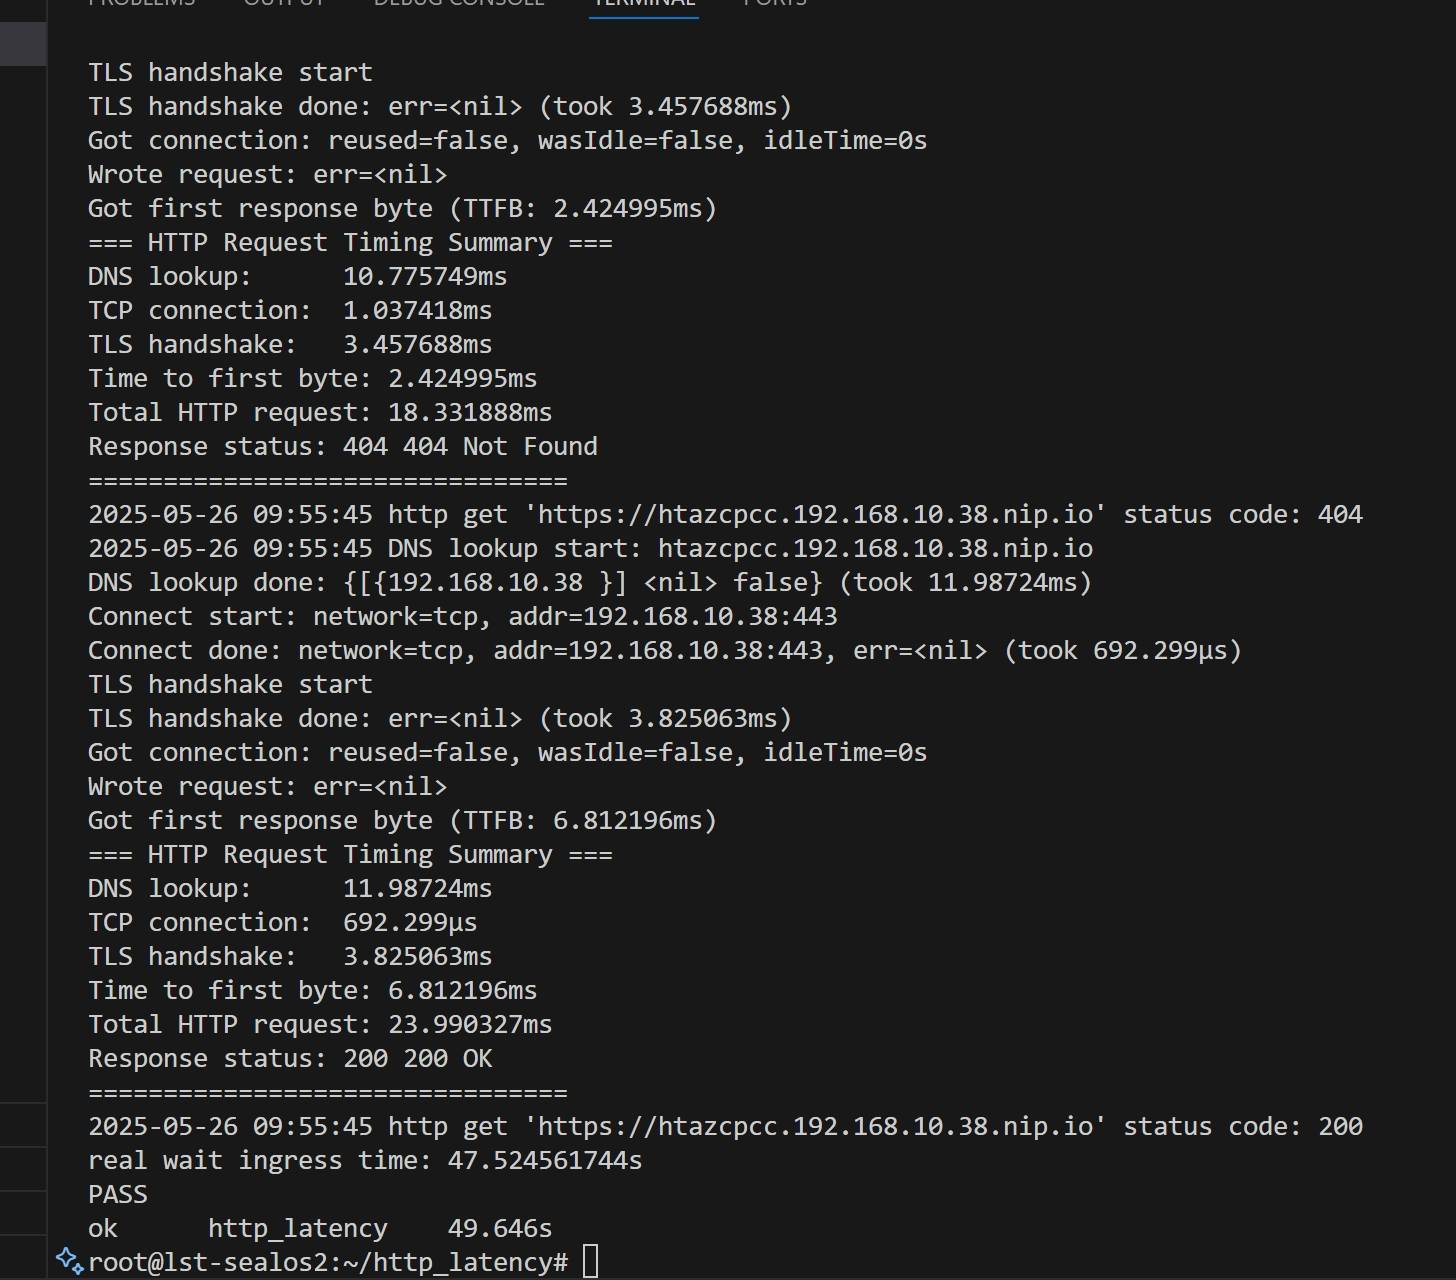 Higress Ingress synchronization time before optimization
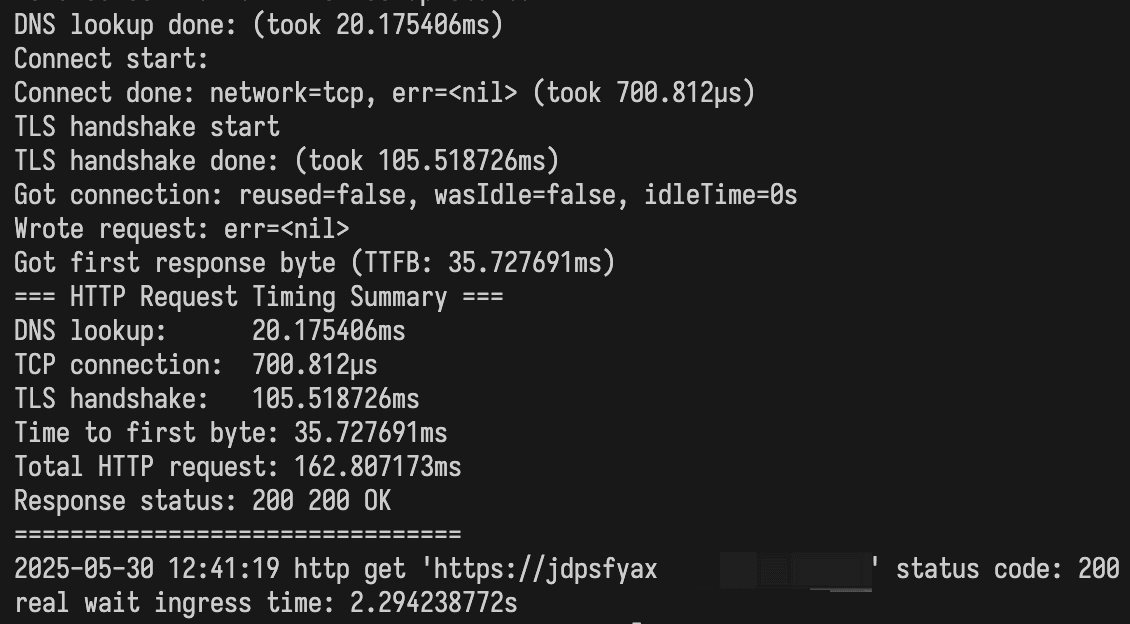 Higress Ingress synchronization time after optimization
The production results were even more spectacular:
Our current production statistics demonstrate the scale we're operating at:
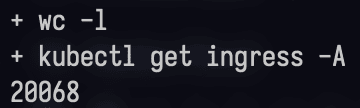 Sealos production Ingress count
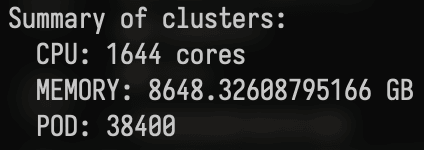 Sealos production resource stats
The before-and-after production performance tells the complete story:
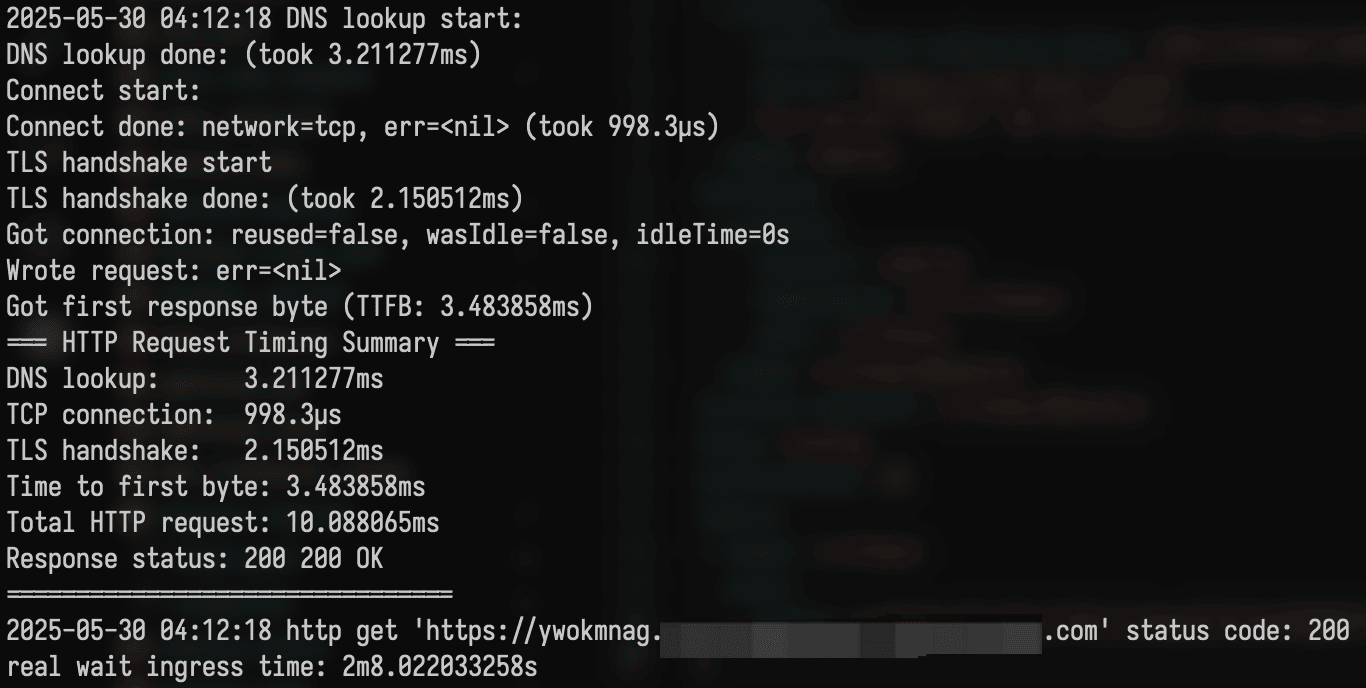 Sealos production Ingress response time - before
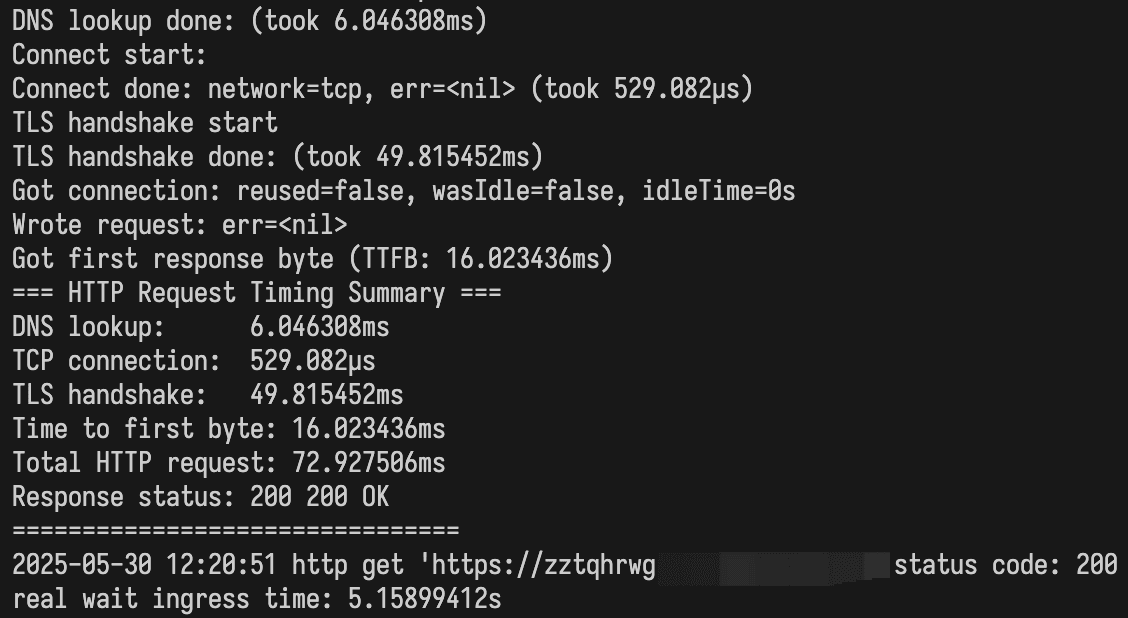 Sealos production Ingress response time - after
Our Hangzhou cluster, previously plagued by multi-minute domain activation delays, now delivers sub-5-second response times consistently. The improvements scale beautifully - what used to become unusable at large scales now maintains peak performance.
These optimizations represent more than performance improvements - they demonstrate the power of systematic investigation and surgical optimization. By understanding the deep architecture of modern service mesh systems, we transformed a scaling disaster into a competitive advantage.
This optimization victory marks just the beginning of our performance journey. Sealos now confidently serves 200,000 users across 40,000 instances, with our gateway handling 20,000+ Ingress configurations without breaking a sweat.
Our experience has generated invaluable expertise in:
The lessons learned extend far beyond our specific use case. Any organization wrestling with Kubernetes Ingress performance at scale can benefit from these deep optimization techniques. As cloud-native adoption accelerates and single-cluster multi-tenancy becomes the norm, these performance patterns will prove increasingly crucial.
This story illustrates a fundamental truth about modern distributed systems: surface-level optimizations often miss the real performance killers lurking in complex system interactions. By diving deep into the architecture of Higress, Istio, and Envoy, we discovered that the most devastating bottlenecks existed at the intersection of well-designed components.
Our journey from 10-minute delays to 5-second responsiveness wasn't just about fixing code - it was about understanding the intricate dance between control planes and data planes, serialization and caching, algorithms and architecture. The result? A gateway system that scales beautifully and performs consistently, no matter how ambitious our users' demands become.
Follow the Sealos Blog for more deep dives into cloud-native performance optimization and architectural innovations.
此内容由惯性聚合(RSS阅读器)自动聚合整理,仅供阅读参考。 原文来自 — 版权归原作者所有。