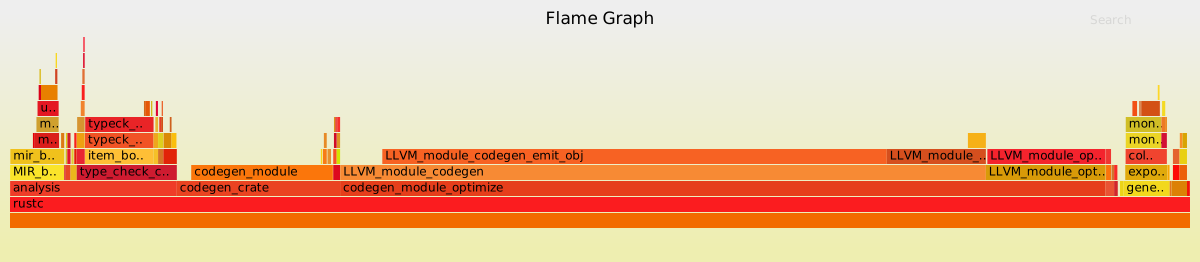
Over the last year, the Self-Profile Working Group has been building tools to profile rustc because we often hear requests to know where compilation time is being spent.
This is useful when optimizing the compiler, one of the Compiler Team's ongoing efforts to improve compile times, but it's also useful to users who want to refactor their crate so that it will compile faster.
We've been working on a new feature that will help with that and this blog post gives a preview of how it works.
Be warned, though: it is still experimental and we expect the interface to change over time.
The Rust Unstable Book has documentation for this feature and we'll keep that up to date so you can always find the latest instructions there.
In this post, we'll look at the tools currently available and use them to profile rustc while it compiles an example crate.
First, we'll install the tools we're going to use from the measureme repository to analyze self-profile trace data.
$ cargo install --git https://github.com/rust-lang/measureme crox flamegraph summarizeNow that we have our tools, let's download an example crate to profile its build.
$ cd ..
$ git clone https://github.com/rust-lang/regex.git
$ cd regex
We'll need to use a recent nightly compiler to get access to unstable -Z flags.
$ rustup override set nightlyIf you haven't installed a nightly compiler before, this will download the nightly compiler for you. If you have, then update it to make sure you're on a recent version.
$ rustup update nightlyNow we can build it and tell rustc to profile the build of the regex crate.
This will cause three new files to be created in the working directory which contain the profiling data.
$ cargo rustc -- -Zself-profile
$ ls
CHANGELOG.md        LICENSE-APACHE       UNICODE.md              regex-17088.string_data       regex-syntax         target
Cargo.lock          LICENSE-MIT          bench                   regex-17088.string_index      rustfmt.toml         test
Cargo.toml          PERFORMANCE.md       examples                regex-capi                    scripts              tests
HACKING.md          README.md            regex-17088.events      regex-debug                   src
The new files follow the format {crate name}-{rustc process id}.{events,string_data,string_index}.
We'll use each of the three main tools to analyze the profiling data:
summarizeAs its name suggests, this tool summarizes the data found in the trace files.
Additionally, summarize can also show a "diff" between two trace files but we won't be using this mode.
Let's run the tool, passing just the file name (but not the extension) for the trace:
$ summarize summarize regex-17088
+-----------------------------------------------+-----------+-----------------+----------+------------+
| Item                                          | Self time | % of total time | Time     | Item count |
+-----------------------------------------------+-----------+-----------------+----------+------------+
| LLVM_module_codegen_emit_obj                  | 4.89s     | 42.752          | 4.89s    | 159        |
+-----------------------------------------------+-----------+-----------------+----------+------------+
| codegen_module                                | 1.25s     | 10.967          | 1.37s    | 159        |
+-----------------------------------------------+-----------+-----------------+----------+------------+
| LLVM_module_optimize_module_passes            | 1.15s     | 10.022          | 1.15s    | 159        |
+-----------------------------------------------+-----------+-----------------+----------+------------+
| LLVM_module_codegen_make_bitcode              | 786.56ms  | 6.875           | 960.73ms | 159        |
+-----------------------------------------------+-----------+-----------------+----------+------------+
| typeck_tables_of                              | 565.18ms  | 4.940           | 689.39ms | 848        |
+-----------------------------------------------+-----------+-----------------+----------+------------+
| LLVM_module_codegen                           | 408.01ms  | 3.566           | 6.26s    | 159        |
+-----------------------------------------------+-----------+-----------------+----------+------------+
| mir_borrowck                                  | 224.03ms  | 1.958           | 543.33ms | 848        |
+-----------------------------------------------+-----------+-----------------+----------+------------+
| LLVM_module_codegen_emit_compressed_bitcode   | 174.17ms  | 1.522           | 174.17ms | 159        |
+-----------------------------------------------+-----------+-----------------+----------+------------+
| optimized_mir                                 | 157.91ms  | 1.380           | 205.29ms | 1996       |
+-----------------------------------------------+-----------+-----------------+----------+------------+
| evaluate_obligation                           | 146.50ms  | 1.281           | 184.17ms | 8304       |
+-----------------------------------------------+-----------+-----------------+----------+------------+
| codegen_crate                                 | 139.48ms  | 1.219           | 1.58s    | 1          |
+-----------------------------------------------+-----------+-----------------+----------+------------+
| mir_built                                     | 123.88ms  | 1.083           | 168.01ms | 848        |
+-----------------------------------------------+-----------+-----------------+----------+------------+
| metadata_decode_entry                         | 88.36ms   | 0.772           | 117.77ms | 55642      |
+-----------------------------------------------+-----------+-----------------+----------+------------+
| incr_comp_copy_cgu_workproducts               | 64.21ms   | 0.561           | 64.21ms  | 1          |
+-----------------------------------------------+-----------+-----------------+----------+------------+
| monomorphization_collector_graph_walk         | 54.11ms   | 0.473           | 344.00ms | 1          |
+-----------------------------------------------+-----------+-----------------+----------+------------+
| link_rlib                                     | 43.21ms   | 0.378           | 43.21ms  | 1          |
+-----------------------------------------------+-----------+-----------------+----------+------------+
| check_impl_item_well_formed                   | 41.36ms   | 0.362           | 77.14ms  | 736        |
+-----------------------------------------------+-----------+-----------------+----------+------------+
| codegen_fulfill_obligation                    | 40.36ms   | 0.353           | 51.56ms  | 1759       |
+-----------------------------------------------+-----------+-----------------+----------+------------+
| expand_crate                                  | 37.24ms   | 0.326           | 48.52ms  | 1          |
+-----------------------------------------------+-----------+-----------------+----------+------------+
| symbol_name                                   | 36.31ms   | 0.317           | 39.06ms  | 5513       |
+-----------------------------------------------+-----------+-----------------+----------+------------+
| free_global_ctxt                              | 34.34ms   | 0.300           | 34.34ms  | 1          |
+-----------------------------------------------+-----------+-----------------+----------+------------+
...
Total cpu time: 11.440758871s
The output is sorted by the self time (time spent in the query or activity but not other queries or activities called by itself). As you can see, most of the compilation time is spent in LLVM generating the binary code for the executable.
flamegraphAs you may have guessed, flamegraph will produce a flame graph of the profiling data.
To run the tool, we'll pass just the filename without a file extension like we did for summarize:
$ flamegraph regex-17088This will create a file called rustc.svg in the working directory:
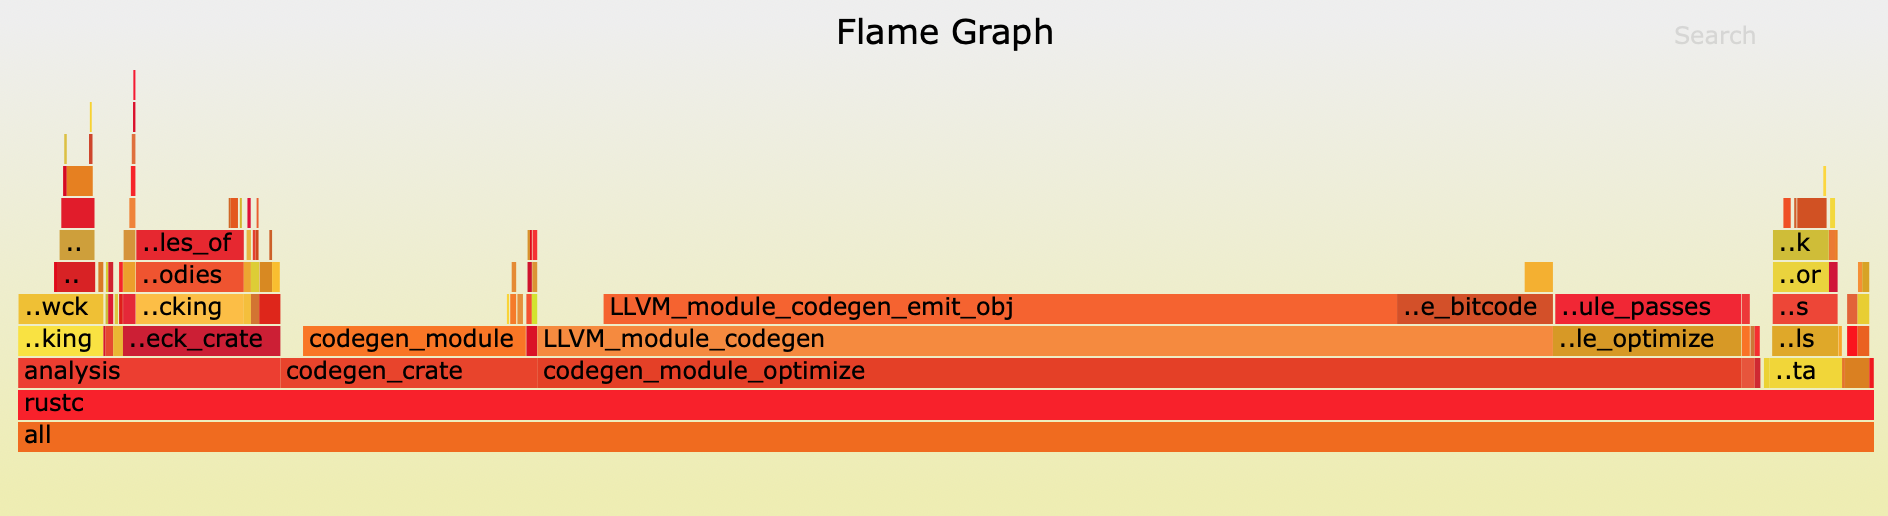
Click here to try the interactive svg.
croxThis tool processes self-profiling data into the JSON format that the Chromium profiler understands. You can use it to create a graphical timeline showing exactly when various traced events occurred.
In this section, we'll cover a few different modes crox can run in such as profiling an entire crate compilation including dependencies and filtering out small events.
Let's get started with the basics!
To run the tool, we'll just pass the filename without a file extension like we've done before:
$ crox regex-17088This creates a file called chrome_profiler.json in the working directory.
To open it, we'll use the regular Chromium performance tools you might already be familiar with:
Ctrl + Shift + i (Windows/Linux) or Cmd + Option + i (macOS)chrome_profiler.json file we created.You should now see something similar to this:
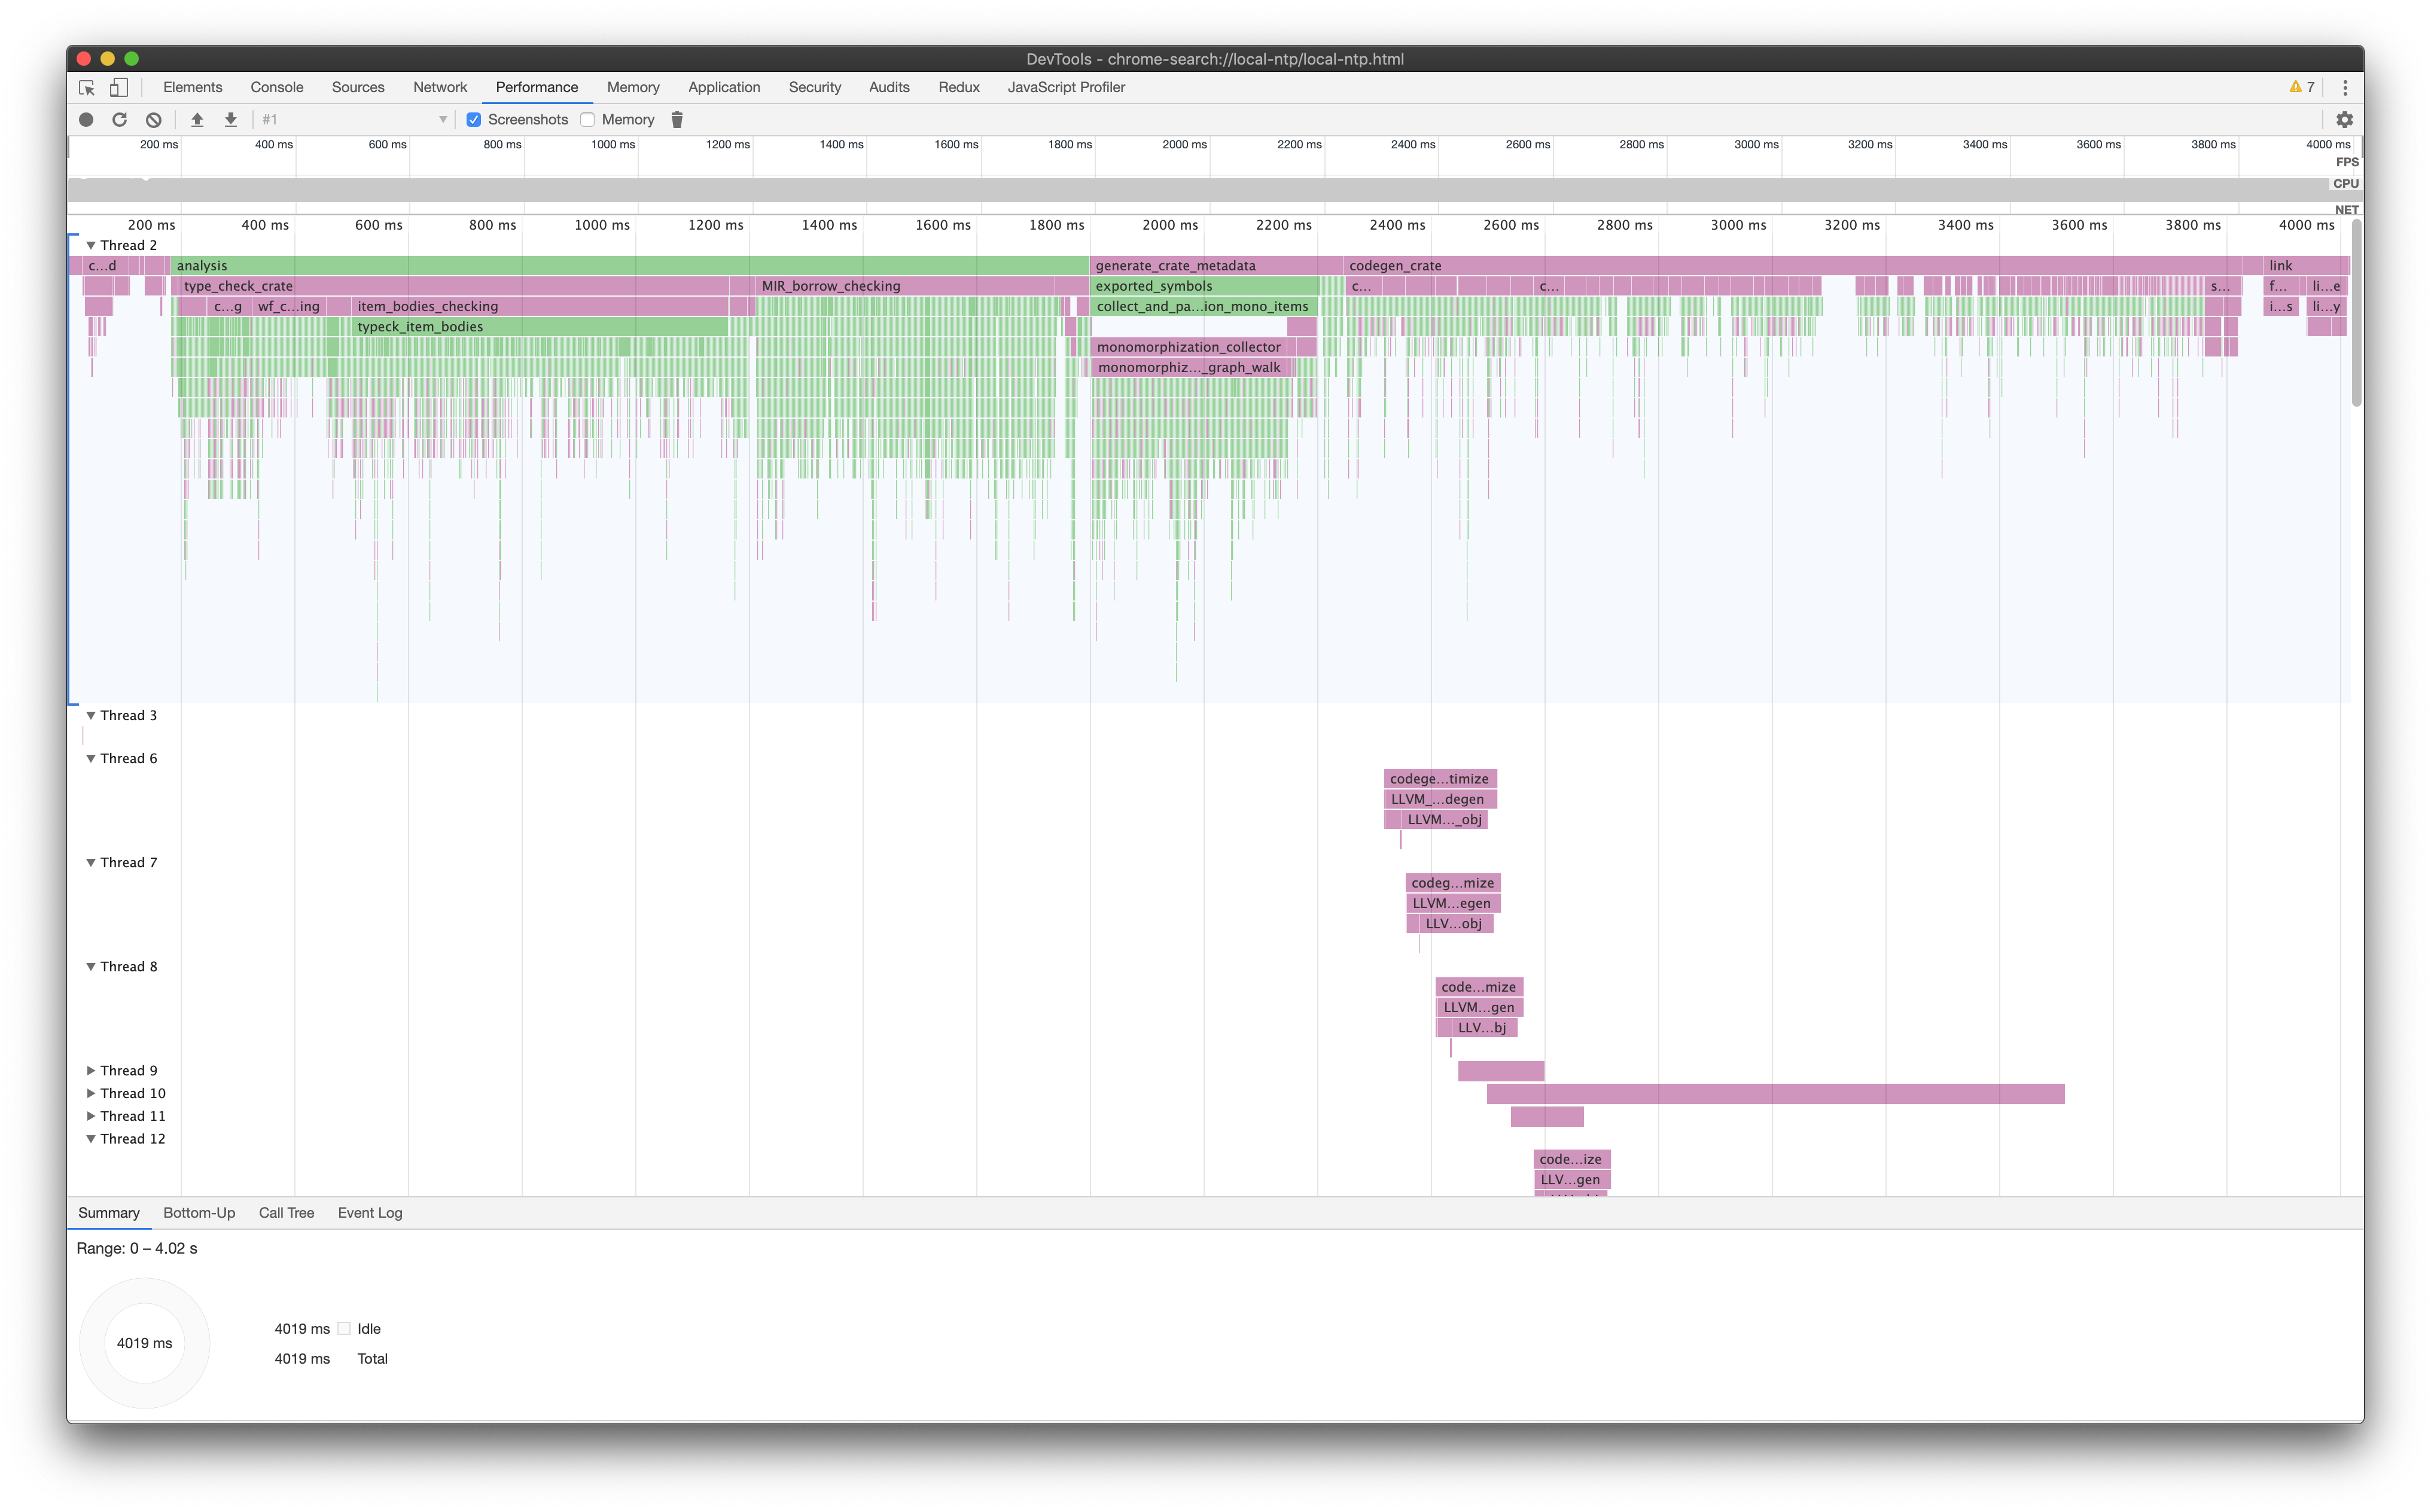
You can use the scroll wheel on a mouse or the appropriate gesture on a touchpad to zoom in or out of the timeline.
If the chrome_profiler.json file gets too large, the normal Chromium performance tools have issues opening the file.
One easy way to deal with this is to tell crox to remove events shorter than a chosen duration:
$ crox --minimum-duration 2 regex-17088Filtering out events less than 2 microseconds shrinks our chrome_profiler.js file from 27mb to 11mb.
The self-profiler can be configured to record event arguments during compilation. For example, queries will include their query key. This functionality is turned off by default because it increases the self-profiler overhead.
To turn this feature on, we'll need to record a new compilation, passing an additional argument to rustc:
$ cargo clean
$ cargo rustc -- -Zself-profile -Zself-profile-events=default,args
And then process the new output files:
$ crox regex-23649Now in the Chromium profiler, if you click on a node, you can see additional data about many of the events at the bottom of the screen:
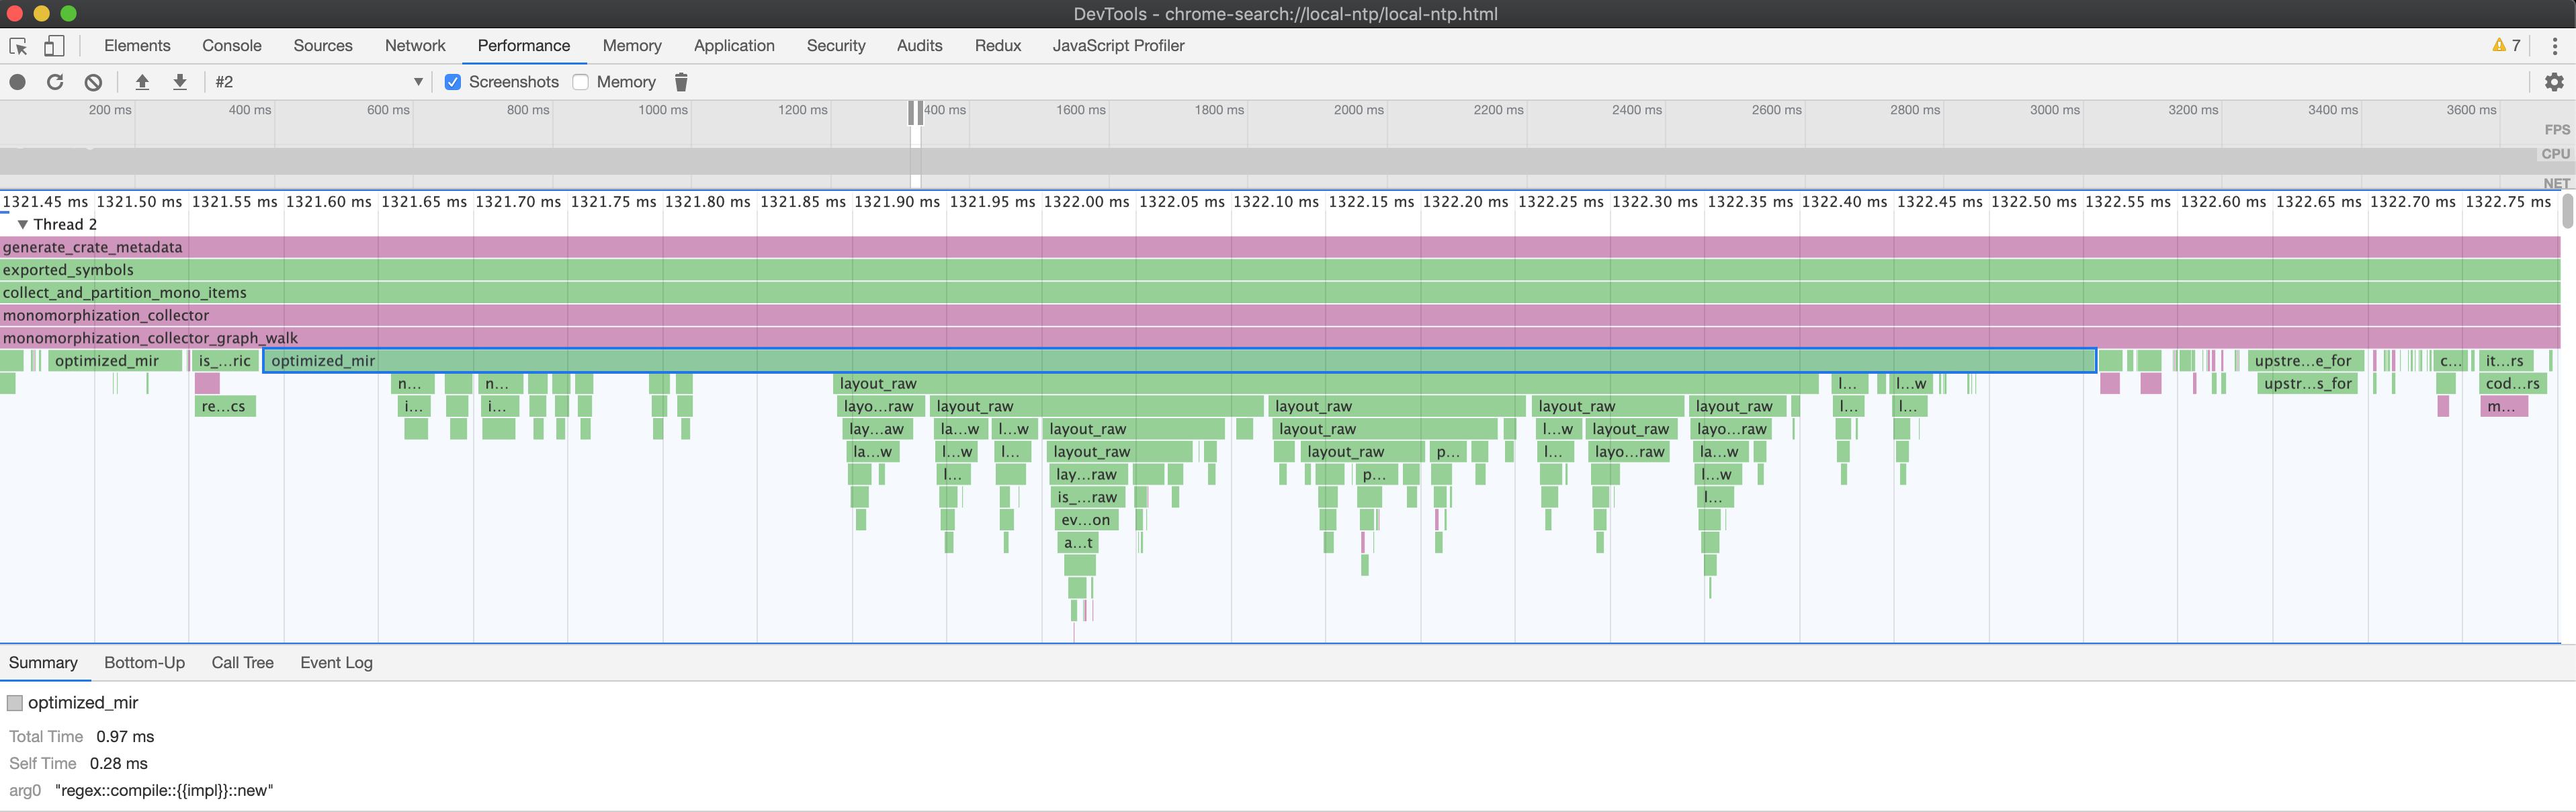
Which shows this optimized_mir query was processing the regex::compile::{{impl}}::new function body.
By using the RUSTFLAGS environment variable, we can profile every rustc invocation, not just the final crate's.
crox can then combine all of the profiles together into one output file.
Since this will create a lot of files, we'll tell rustc to create a folder to put all the traces in.
$ rm regex-17088.* regex-23649.* # clean up the old trace files since we're done with them
$ cargo clean
$ RUSTFLAGS="-Zself-profile=$(pwd)/profiles -Zself-profile-events=default,args" cargo build
This creates quite a few trace files in the working directory.
Now, we'll tell crox to combine all of the trace files in the current directory together:
$ crox --dir profilesOpening this file shows all of the crates compiled:
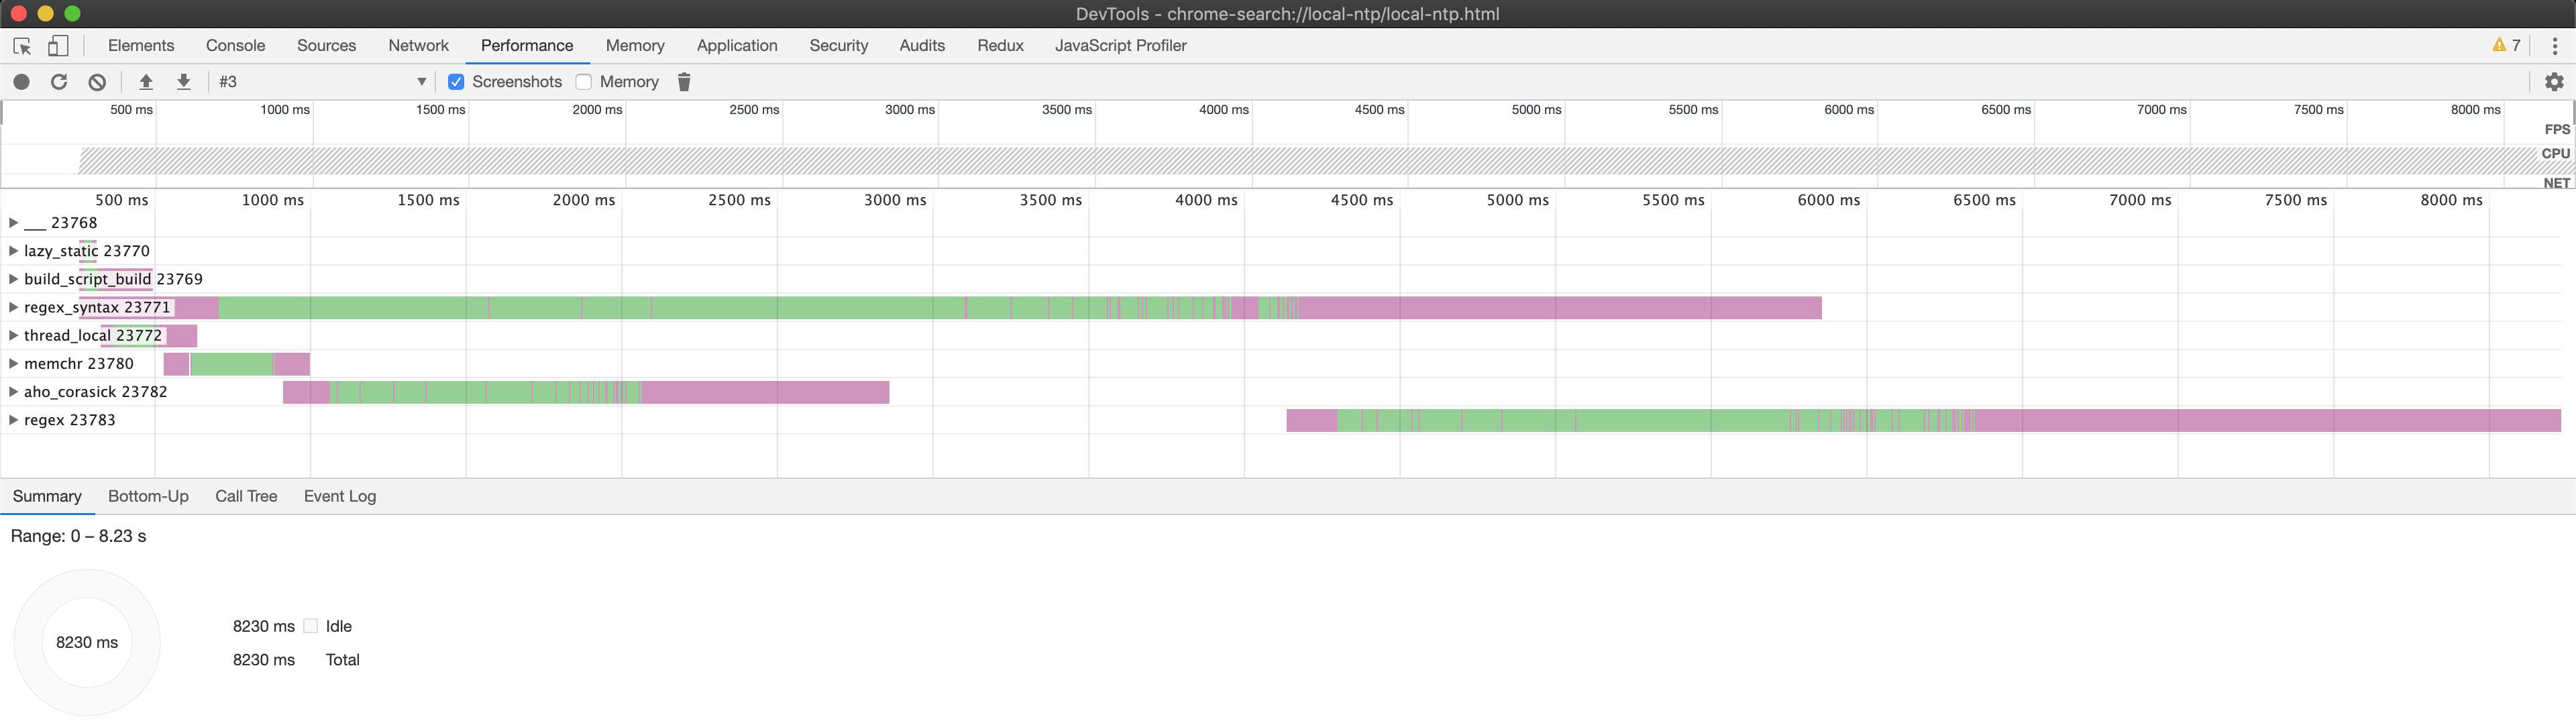
Clicking on a crate will expand it to show the threads and event data inside it:
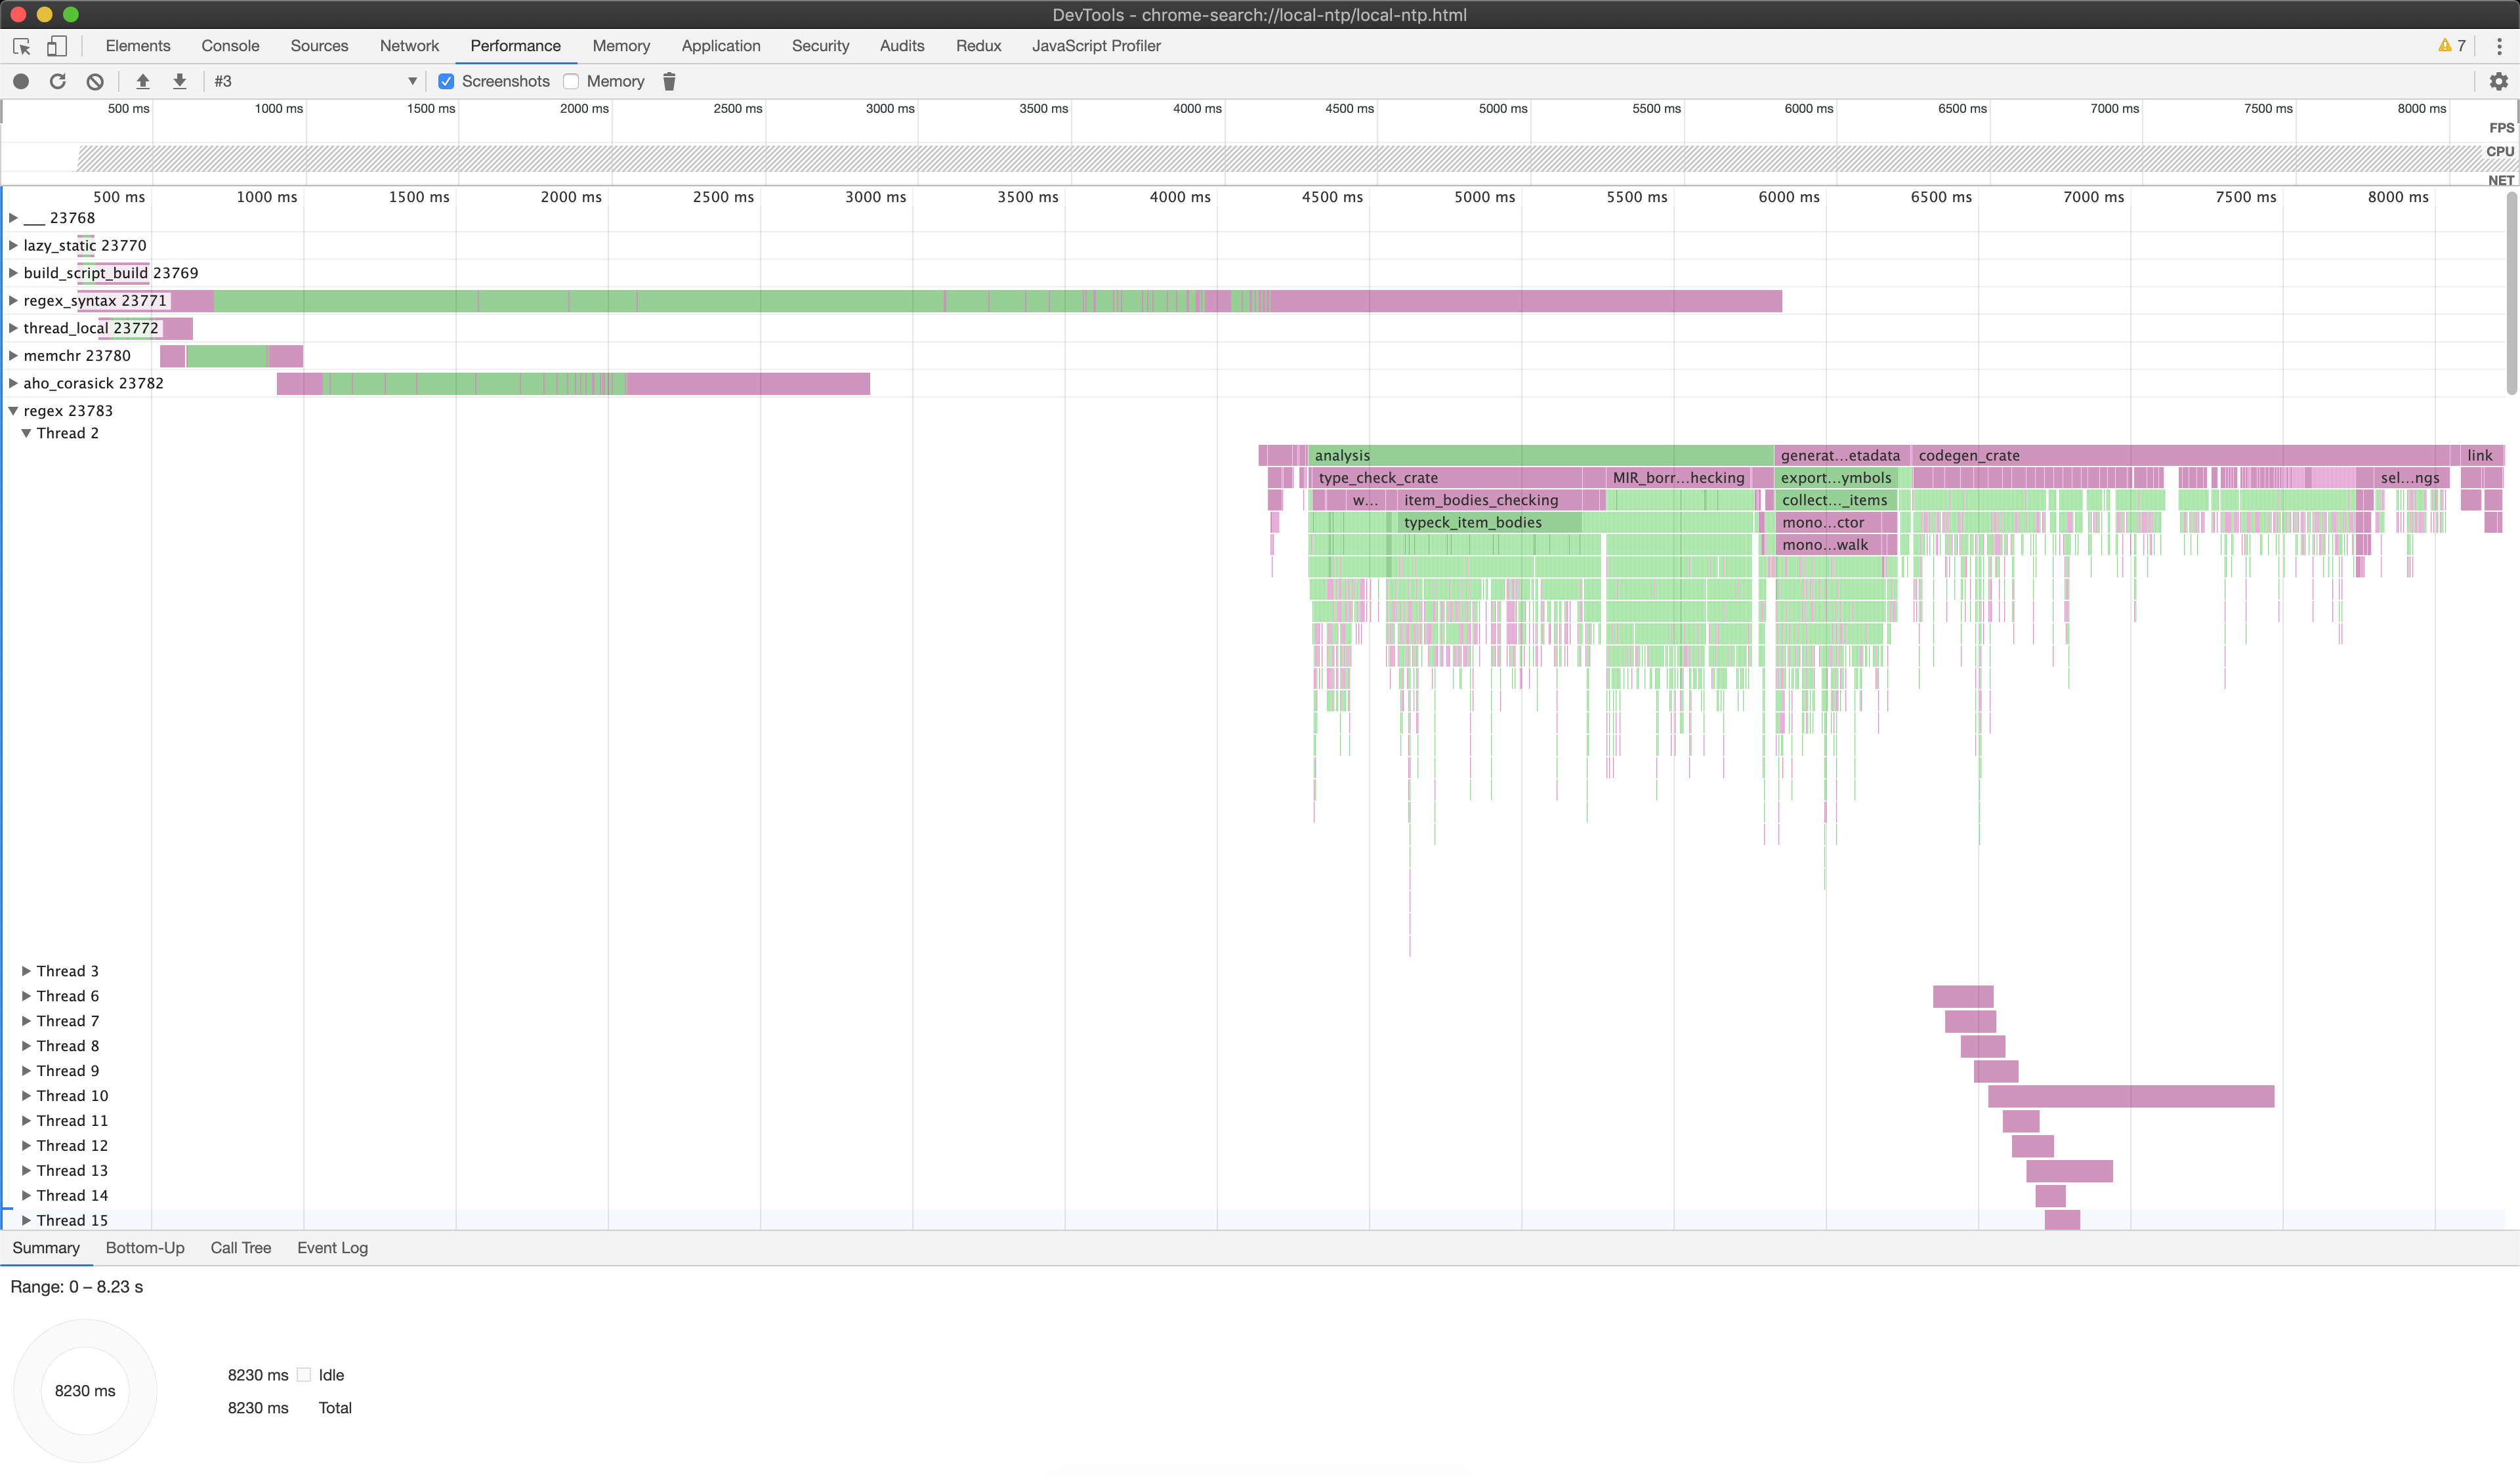
Thanks for reading!
We've been using these tools extensively ourselves over the last few months and they've helped us tremendously in understanding where the compiler spends its time. In the future we'll be adding more features and we'll work on making the tooling easier to use. If you have questions or would like to get involved with the Self-Profile Working Group, please check out the measureme repository or stop by our Zulip stream.
此内容由惯性聚合(RSS阅读器)自动聚合整理,仅供阅读参考。 原文来自 — 版权归原作者所有。