


TLDR -- PGO makes the compiler faster but is not straightforward to realize in CI.
For the last few months Mozilla has been using Profile-Guided Optimization (PGO) to build their own optimized version of Clang, leading to an up to 9% reduction of Firefox compile times on their build infrastructure. Would the same be possible for the Rust compiler, that is, could we apply profile-guided optimization to rustc itself in order to make it faster? This post explores exactly this question, detailing first the steps needed for generating a PGOed versions of rustc (in two flavors), and then taking a look at the resulting performance implications. But before that let's have a little reminder what PGO even is and how it works in general.
Here is how the respective chapter from the rustc book describes profile-guided optimization:
The basic concept of PGO is to collect data about the typical execution of a program (e.g. which branches it is likely to take) and then use this data to inform optimizations such as inlining, machine-code layout, register allocation, etc.
There are different ways of collecting data about a program's execution. One is to run the program inside a profiler (such as perf) and another is to create an instrumented binary, that is, a binary that has data collection built into it, and run that. The latter usually provides more accurate data and it is also what is supported by
rustc.
In other words, we first generate a special, "instrumented" version of the program we want to optimize, and then use this instrumented version to generate an execution profile. This execution profile is then used by the compiler for better optimizing the actual, final version of the program.
Generating a PGOed version of rustc involves the same basic steps as it does for any other kind of program:
However, as opposed to many other programs, rustc is a bit of a special case because it consists of two very large chunks of code written in different programming languages: the LLVM backend (written in C++) and the front and middle parts of the compiler (written in Rust). Consequently, there are also two separate compilers involved in building rustc -- both of which support their own version of PGO. This complicates things slightly but fortunately the PGO setup for each of the two components can be treated in isolation. Let's take a look at the LLVM part first, since that is slightly simpler.
PGO is a toolchain specific feature, so how it works might be different for different C++ compilers. In this article I will only go into how it works with Clang because (a) I have no experience with PGO in other compilers, and (b) Clang is what the Rust project actually uses in production.
In order to enable PGO for rustc's LLVM we basically follow the steps laid out in the previous section.
We make sure that our LLVM gets instrumented by applying the following changes to the config.toml file in the root directory of our Rust checkout:
[llvm]

# Pass extra compiler and linker flags to the LLVM CMake build.
# <PROFDATA_DIR> must be an absolute path to a writable
# directory, like for example /tmp/my-rustc-profdata
cflags = "-fprofile-generate=<PROFDATA_DIR>"
cxxflags = "-fprofile-generate=<PROFDATA_DIR>"

# Make sure that LLVM is built as a dylib
link-shared = true

# Make sure we use Clang for compiling LLVM
# (assuming that we are building for x86_64 Linux in this case)
[target.x86_64-unknown-linux-gnu]
cc = "clang"
cxx = "clang++"
linker = "clang"
The -fprofile-generate flag tells Clang to create an instrumented binary that will write any profile data it generates to the given directory.
It is advisable to always use an absolute path here since we don't want things to depend on the working directory of the compiler.
We also set link-shared = true which makes sure that rustc's linker does not have to deal with linking the instrumentation runtime into C++ code.
It's possible to make that work but it's not worth the trouble.
Now we just need to run ./x.py build and wait until we have a working rustc with an instrumented LLVM.
Next we collect profile data by running the compiler we built in the previous step.
This is straightforward because data collection happens completely transparently.
Just run the compiler as you always would (e.g. via Cargo) and the profile data will show up in the <PROFDATA_DIR> we specified in the -fprofile-generate flag above.
In order to make the collected data as useful as possible, we should try to exercise all the common code paths within the compiler.
I typically use the "standard" rustc-perf benchmark suite for this purpose, which includes debug builds, optimized builds, check builds, both incremental and non-incremental.
After this is done, you will find a number of .profraw files in <PROFDATA_DIR>.
As described in the Clang user manual these .profraw files need to be merged into a single .profdata file by using the llvm-profdata tool that comes with your Clang installation:
$ cd <PROFDATA_DIR>
$ llvm-profdata merge -output=rustc-llvm.profdata *.profraw
Now that the combined profile data from all rustc invocations can be found in <PROFDATA_DIR>/rustc-llvm.profdata it is time to re-compile LLVM and rustc again, this time instructing Clang to make use of this valuable new information.
To this end we modify config.toml as follows:
[llvm]
# Instead of -fprofile-generate, we now pass -fprofile-use to Clang
cflags = "-fprofile-use=<PROFDATA_DIR>/rustc-llvm.profdata"
cxxflags = "-fprofile-use=<PROFDATA_DIR>/rustc-llvm.profdata"
Now we make sure that LLVM is properly rebuilt by deleting the old version and build everything again:
$ cd $RUST_PROJECT_ROOT
$ rm -rf ./build/x86_64-unknown-linux-gnu/llvm
$ ./x.py build
Once this is done, we have a Rust compiler with PGO-optimized LLVM. Congratulations!
As mentioned above Firefox build times have improved by up to 9% with a PGOed compiler. Clang's own documentation even reports an up to 20% improvement. The best way we have for assessing the Rust compiler's performance is the rustc-perf benchmark suite. Since compiling with PGO does not quite fit with how the Rust project's CI works, we cannot use the perf.rust-lang.org version of the benchmark suite. Fortunately, thanks to good documentation, running the benchmarks locally is straightforward enough. Here's a glance at the effect that a PGOed LLVM has on rustc's performance:
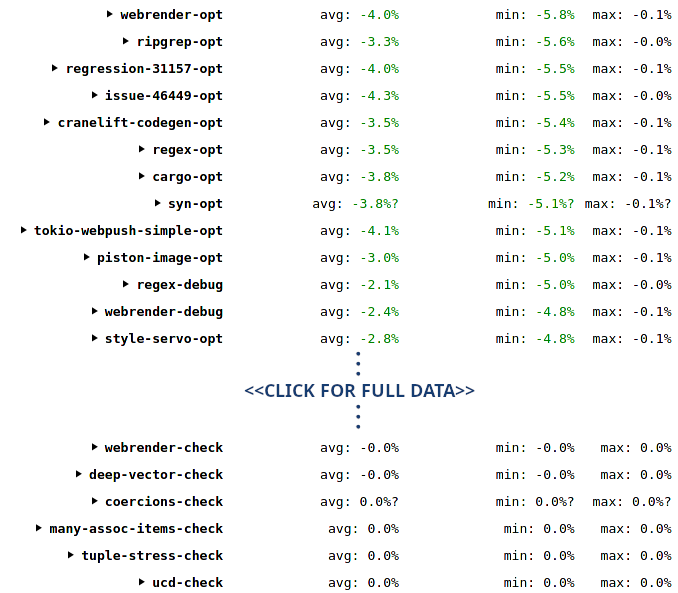
The results are not quite as spectacular as the anecdotal 20% improvement from Clang's documentation; but they are pretty encouraging and show no significant performance regressions. Diving more into details shows the expected profile:
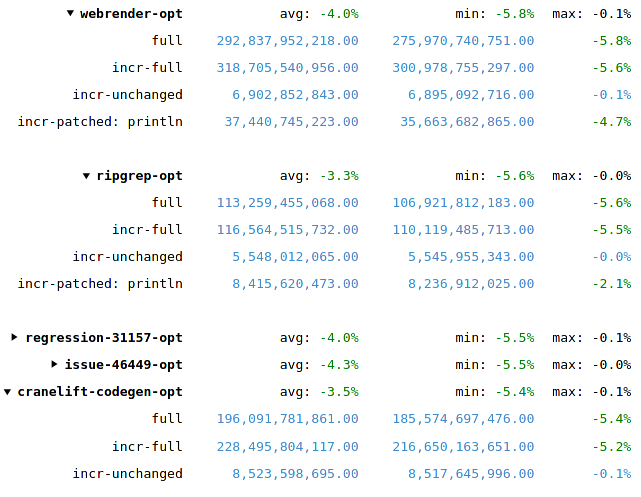
Workloads that spend most of their time in LLVM (e.g. optimized builds) show the most improvement, while workloads that don't invoke LLVM at all (e.g. check builds) also don't profit from a faster LLVM. Let's take a look at how we can take things further by applying PGO to the other half of the compiler.
The basic principle stays the same:
create an instrumented compiler, use it to collect profile data, use that data when compiling the final version of the compiler.
The only difference is that this time we instrument a different part of the compiler's code, namely the part generated by rustc itself.
The compiler has had support for doing that for a while now and, as can be seen in the respective chapter of the rustc book, the command-line interface has been modeled after Clang's set of flags.
Unfortunately, the compiler's build system does not support using PGO out of the box, so we have to directly modify src/bootstrap/compile.rs in order to set the desired flags.
We only want to instrument the compiler itself, not the other tools or the standard library, see we add the flags to rustc_cargo_env():
pub fn rustc_cargo_env(builder: &Builder<'_>,
                       cargo: &mut Cargo,
                       target: TargetSelection) {
    // ... omitted ...

    if builder.config.rustc_parallel {
        cargo.rustflag("--cfg=parallel_compiler");
    }
    if builder.config.rust_verify_llvm_ir {
        cargo.env("RUSTC_VERIFY_LLVM_IR", "1");
    }

    // This is new: Hard code instrumentation in the
    // RUSTFLAGS of the Cargo invocation that builds
    // the compiler
    cargo.rustflag("-Cprofile-generate=<PROFDATA_DIR>");

    // ... omitted ...
}
As before <PROFDATA_DIR> must be an actual, absolute path to a directory.
Once we have collected enough profile data, we go back to src/bootstrap/compile.rs and replace the -Cprofile-generate flag with a -Cprofile-use flag:
pub fn rustc_cargo_env(builder: &Builder<'_>,
                       cargo: &mut Cargo,
                       target: TargetSelection) {
    // ... omitted ...

    if builder.config.rustc_parallel {
        cargo.rustflag("--cfg=parallel_compiler");
    }
    if builder.config.rust_verify_llvm_ir {
        cargo.env("RUSTC_VERIFY_LLVM_IR", "1");
    }

    // Replace `-Cprofile-generate` with `-Cprofile-use`,
    // assuming that we used the `llvm-profdata` tool to
    // merge the collected `<PROFDATA_DIR>/*.profraw` files
    // into a common file named
    // `<PROFDATA_DIR>/rustc-rust.profdata`.
    cargo.rustflag(
        "-Cprofile-use=<PROFDATA_DIR>/rustc-rust.profdata"
    );

    // ... omitted ...
}
Let's take a look at the effects PGO has on this portion of the compiler.
As expected the results are similar to when PGO was applied to LLVM: a reduction of instruction counts by roughly 5%. NOTE: These numbers show the improvement from applying PGO exclusively to the Rust part of the compiler. The LLVM part was not compiled with PGO here:
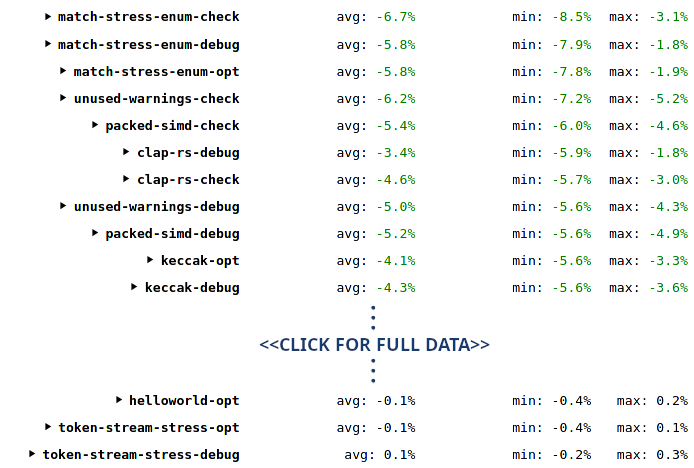
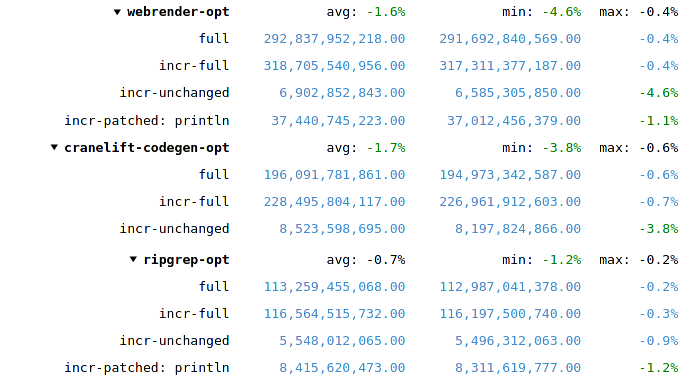
Because different workloads execute different amounts of Rust code (vs C++/LLVM code), the total reduction can be a lot less for LLVM-heavy cases. For example, a full webrender-opt build will spend more than 80% of its time in LLVM, so reducing the remaining 20% by 5% can only reduce the total number by 1%. On the other hand, a check build or an incr-unchanged build spends almost no time in LLVM, so the 5% Rust performance improvement translates almost entirely into a 5% instruction count reduction for these cases:
The short answer is yes.
The longer answer is that we have to be careful about profile data incompatibilities.
Both Clang and the Rust compiler use the same LLVM-based PGO mechanisms underneath.
If both Clang and the Rust compiler use the exact same version of LLVM, we can even combine the two into a single .profdata file.
However, if the two LLVM versions are different, we better make sure that the two compilers don't get into each other's way.
Luckily it's straightforward to facilitate that:
We need to specify different directories for the respective -fprofile-generate and -Cprofile-generate (and *-use) flags.
This way the instrumentation code coming from Clang will write into one directory and the code coming from rustc will write into another.
We need to make sure that we use the right llvm-profdata tool for each set of .profraw files.
Use the one coming with Clang for handling the files in the Clang directory and the one coming with the Rust compiler for the files in the Rust directory.
If we do that, we get a compiler with both parts optimized via PGO, with the compile time reductions adding up nicely.
When I looked at the the final numbers, I was a bit underwhelmed. Sure, PGO seems to lead to a pretty solid 5% reduction of instruction counts across basically all real world workloads in the benchmark suite, for check, debug, and opt builds alike. That is pretty nice -- but also far away from the 20% improvement mentioned in the Clang documentation. Given that PGO adds quite a few complications to the build process of the compiler itself (not to mention the almost tripled build times) I started to think that applying PGO to the compiler would probably not be worth the trouble.
I then took a glance at the benchmarks' wall time measurements (instead of the instruction count measurements) and saw quite a different picture: webrender-opt minus 15%, style-servo-opt minus 14%, serde-check minus 15%?
This looked decidedly better than for instruction counts.
But wall time measurements can be very noisy (which is why most people only look at instruction counts on perf.rust-lang.org), and rustc-perf only does a single iteration for each benchmark, so I was not prepared to trust these numbers just yet.
I decided to try and reduce the noise by increasing the number of benchmark iterations from one to twenty.
I only did "full" builds in this configuration as PGO's effect seemed to translate pretty predictably to incremental builds.
After roughly eight hours to complete both the PGO and the non-PGO versions of the benchmarks these are the numbers I got:
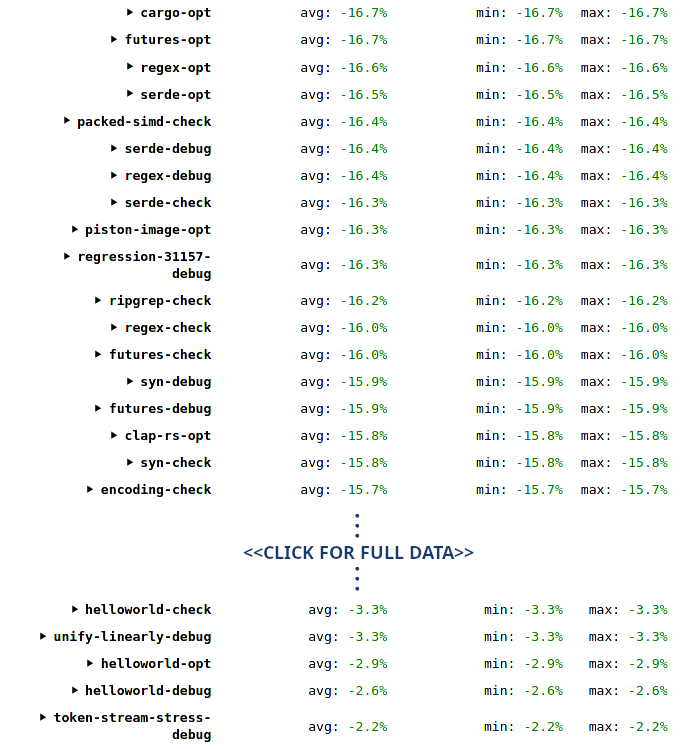
As you can see we get a 10-16% reduction of build times almost across the board for real world test cases. This was more in line with what I had initially hoped to get from PGO. It is a bit surprising that the difference between instruction counts and wall time is so pronounced. One plausible explanation would be that PGO improves instruction cache utilization, something which makes a difference for execution time but would not be reflected in the amount of instructions executed. I also don't know how branch mispredictions factor into instruction counts -- branch prediction being another aspect explicitly targeted by PGO.
As good as these numbers look, please keep in mind that they come from a single machine. It's possible that the Ryzen 1700X processor I used has some idiosyncrasies that favor the kind of optimizations that PGO does, and a different processor with a different caching system and branch predictor would generate quite different numbers. Nonetheless, the numbers undoubtedly are very encouraging and warrant further investigation.
The numbers above suggest that PGO can indeed provide noticeable compile time reductions. Unfortunately, bringing these improvements to end users is not as simple as adding a few compiler flags to our dist builds. PGO is different from most other optimizations in that it
Both of these problems pose substantial hurdles for actually using PGO on the compiler itself. Rust's CI build times have always been too long and we already forgo some optimizations because of them (e.g. macOS still does not get the 10% performance boost from using a ThinLTOed LLVM because the build machines on that platform are especially slow). However, I think there's still a way forward. There's a tradeoff between the two obstacles mentioned above:
I estimate that the first approach is more fruitful, as it is always better to put more value on low engineering and maintenance costs than on low compute times.
Having a straightforward way of obtaining a PGOed compiler (e.g. by adding a simple setting in config.toml) would unblock the path to a couple of scenarios:
It's unlikely that I can spend a lot of time on this personally -- but my hope is that others will pick up the baton. I'd be happy to provide guidance on how to use PGO specifically.
PS -- Special thanks to Mark Rousskov for uploading my local benchmarking data to perf.rust-lang.org, which makes it much nicer to explore!
此内容由惯性聚合(RSS阅读器)自动聚合整理,仅供阅读参考。 原文来自 — 版权归原作者所有。