


For the past couple of years, I’ve been creating visualizations of the internet’s physical infrastructure. This project pieces together data from a few sources, and for me, seeing this data visualized together is compelling. These maps show the undersea fiber optic cables that form the backbone of global connectivity and the Internet Exchange Points (IXPs) where networks meet. This year, I’m thrilled to announce a major evolution of the project. Instead of static images and pre-rendered videos, the Internet Map is now a fully interactive, animated map that you can see online.
You can explore the new map live at map.kmcd.dev.
The new version lets you take control. You can pan, zoom, and step through time from the earliest days of the subsea cable network to the latest deployments in 2025. A new statistics panel provides a detailed snapshot for any given year, offering a richer understanding of how our connected world has grown.
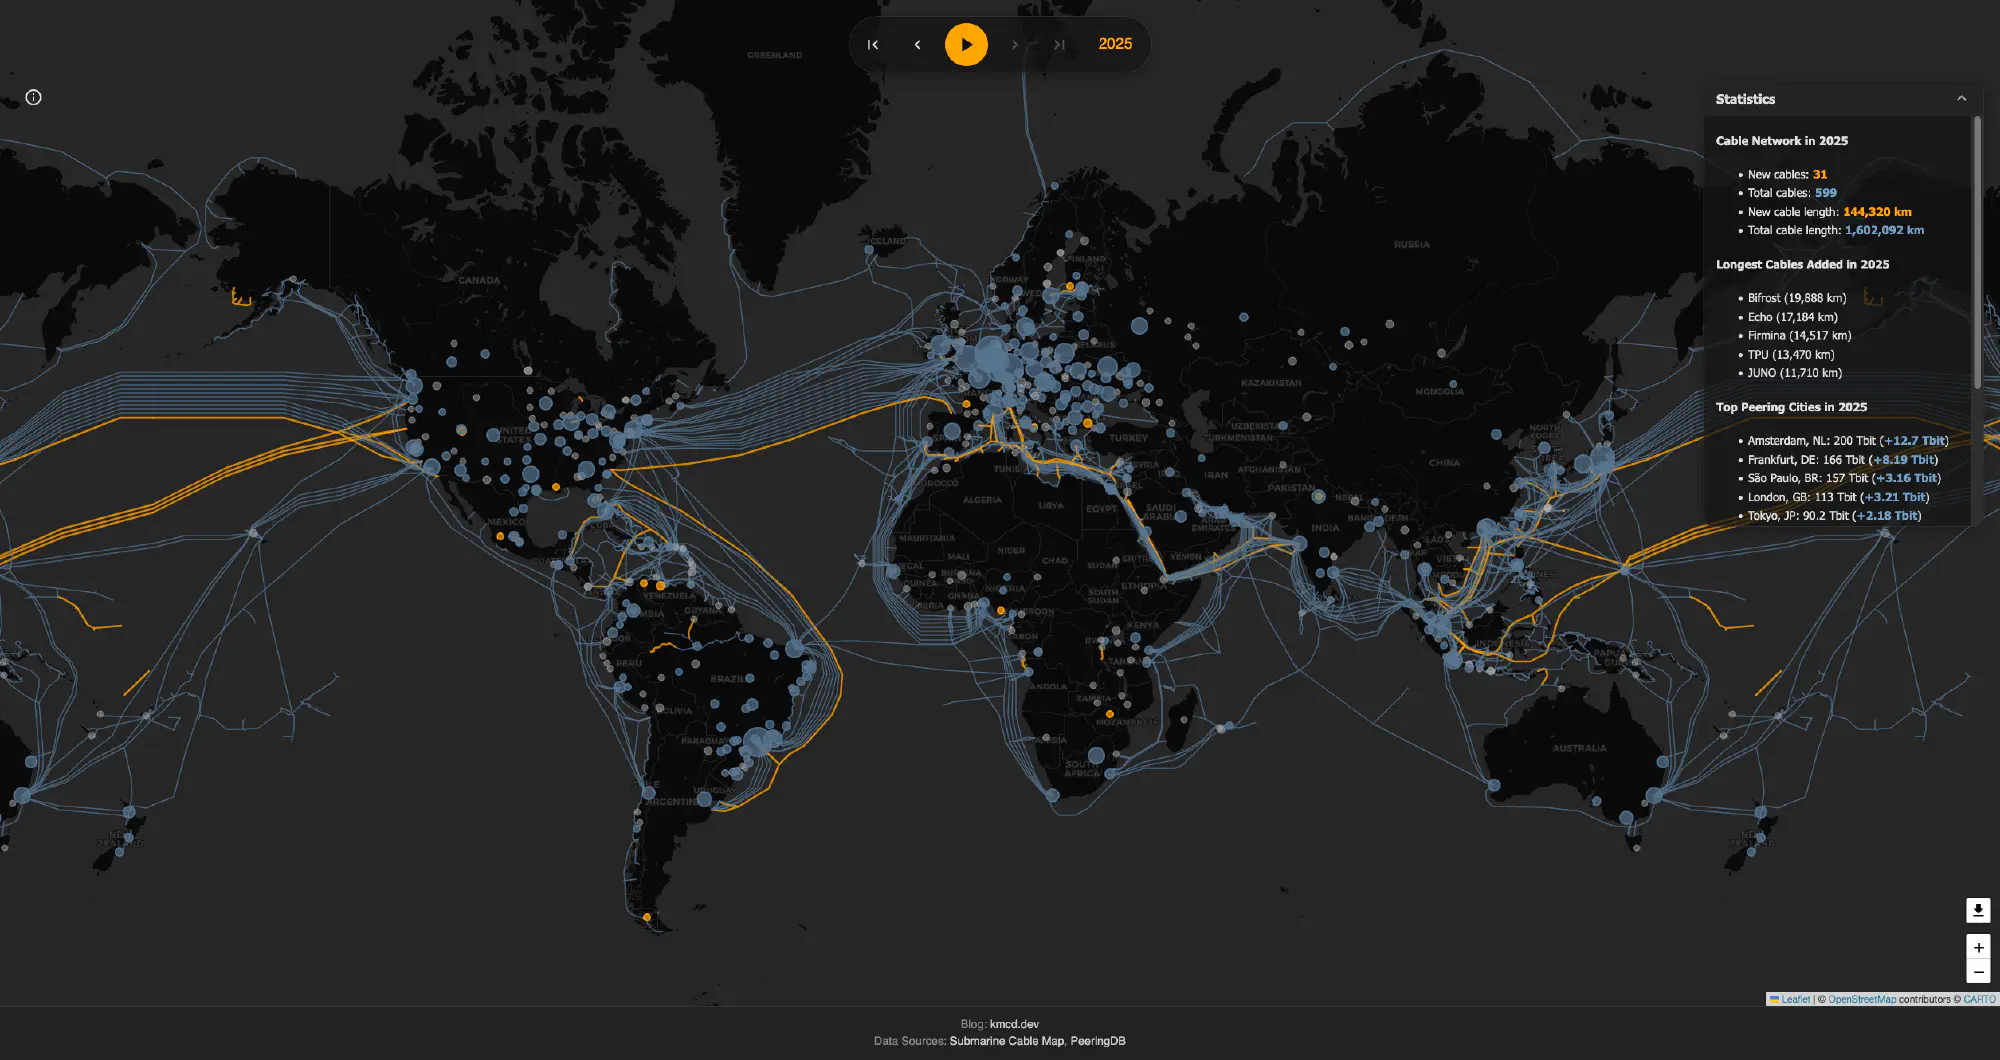
The map visualizes two critical components of the internet’s physical layer.
It’s important to note that this map visualizes publicly available data, which doesn’t capture the full picture of global connectivity. The city peering information, for instance, is sourced from PeeringDB, which tracks publicly advertised connections at IXPs. A vast amount of internet traffic also flows through private peering arrangements and paid transit links that are not publicly documented and therefore do not appear here.
Similarly, the map focuses on the intercontinental backbone of submarine cables. It does not show the incredibly dense web of terrestrial fiber optic cables that run under our streets and alongside major roads. While that data would be fascinating, visualizing it would be overwhelming, and acquiring a complete dataset is nearly impossible as network providers rarely share this proprietary information.
The lines snaking across the ocean floors are submarine communications cables. These bundles of fiber optic strands are the high-speed data arteries that connect continents. Laying and maintaining them is a modern marvel of engineering, involving everything from specialized cable-laying ships to underwater robots for repairs. As you explore the map, you can see how the web of these cables has become denser over time, enabling the global, real-time communication we now take for granted. By the start of 2025, the network has grown to 599 cables, spanning a staggering 1,602,092 kilometers.
While these cables are heavily armored, especially in shallower coastal waters where most damage occurs, their isolation on the seabed makes them vulnerable. For decades, the most common threat has been accidental damage from fishing trawlers and dragged anchors. However, in recent years, a more alarming trend has emerged: intentional sabotage. The increasing frequency of suspicious cable cuts suggests that these vital arteries of communication are becoming targets in geopolitical conflicts, a reality that may have brought many new visitors to this map.
Here are just a few of the many recent incidents:
The Balticconnector Pipeline and Cable Damage (October 2023): The Balticconnector gas pipeline and two telecom cables between Finland and Estonia were damaged by a dragged anchor from the Hong Kong-flagged ship Newnew Polar Bear. China later admitted its vessel was responsible but claimed it was an accident.
The C-Lion1 and BCS East-West Interlink Cuts (November 2024): Two key telecom cables in the Baltic Sea, C-Lion1 (Finland-Germany) and BCS East-West Interlink (Lithuania-Sweden), were severed. The Chinese-owned cargo ship Yi Peng 3 was the primary suspect after it was observed making anomalous movements in the area.
The Christmas Day Baltic Cable Cuts (December 2024): On Christmas Day 2024, the Estlink 2 power cable and other telecom cables between Finland and Estonia were damaged by a dragged anchor. Finnish authorities seized the suspected vessel, the oil tanker Eagle S, which was identified as part of Russia’s “shadow fleet”.
The Matsu Islands Blackout (February 2023): Two undersea cables connecting Taiwan to its outlying Matsu Islands were severed by Chinese vessels, leaving the 14,000 residents with severely disrupted internet for over 50 days. The incident highlighted the societal impact of such disruptions and was seen as part of a broader pressure campaign by China.
The Trans-Pacific Express Cable Cut (January 2025): The major Trans-Pacific Express international cable was cut near Taiwan, with suspicion falling on the Chinese-owned cargo ship Shunxin 39. The vessel had a history of using multiple identities to evade tracking and sailed erratically over the cable’s location before the incident.
The Red Sea Cable Disruption (February 2024): Three critical cables in the Red Sea were severed by the anchor of the sinking cargo ship Rubymar, which had been struck by a Houthi missile. The incident disrupted a significant portion of Europe-Asia data traffic and highlighted the vulnerability of infrastructure in contested maritime chokepoints.
The Gulf of St. Lawrence Sabotage (December 2023 & 2024): A subsea cable connecting Nova Scotia and Newfoundland was deliberately cut in December 2023 and again in December 2024. Evidence showed an “angle grinder cut” through the steel-wrapped cable, confirming sabotage, though the perpetrator and motive remain unknown.
These examples represent only a fraction of such incidents, which have escalated in frequency and impact in recent years.
The circles on the map represent cities with Internet Exchange Points. If submarine cables are the interstate highways of the internet, then IXPs are the bustling, hyper-connected metropolitan areas where all the traffic is headed.
An IXP is a physical data center, or a set of connected data centers, where many different networks can physically plug into each other to exchange traffic directly. This process is called “peering.”
So why do hundreds of networks choose to gather in the same buildings in cities like Frankfurt or Amsterdam? The answer is a powerful network effect that you could call digital gravity. The value of an IXP is determined by the networks present there. Once a major network joins, it becomes exponentially more attractive for others to join as well.
The most powerful sources of this gravity are large content providers like Google, Meta, Apple, and Netflix. These companies have an “open peering policy.” In essence, they are saying to any Internet Service Provider (ISP): “Connect with us directly here at the IXP, and we will give your customers a faster, better path to our services.”
This creates a powerful win-win scenario:
This economic incentive is the engine that drives the growth you see on the map. ISPs flock to the IXPs where the big content providers are, which in turn attracts more content providers, creating a feedback loop of ever-increasing capacity and value. This is why a handful of cities have become global hubs with staggering traffic volumes, while others remain smaller, regional nodes.

The animation and data now extend to 2025, revealing significant ongoing investment. In this year alone, 31 new cables were added (or are promised very soon), stretching over 144,320 kilometers, enough to circle the earth three and a half times.
Some of the longest and most impactful new cables of 2025 include:
Looking at the total peering capacity reveals a clear global hierarchy. Europe remains the undisputed leader, with an incredible 1.5 Pbit/s of capacity. Asia and North America follow with robust networks of their own, while South America shows impressive growth.
pie title Peering Capacity by Region (2025)
    "Europe": 1500
    "Asia": 430
    "North America": 403
    "South America": 313
    "Africa": 67.9
    "Oceania": 67.2
This massive regional capacity is concentrated in a few key metropolitan hubs. The list of top peering cities shows just how vital they are to the global network:
The growth in a city like São Paulo is remarkable and shows the increasing investment in internet infrastructure in South America, directly supported by new cables like Firmina.
The transition to an interactive map required a complete overhaul of the technology stack. The previous versions, which relied on generating static SVG images, faced several challenges. It was difficult to dynamically size the lines representing cables and find the right balance of detail for country borders; too much detail slowed the map down, while too little looked simplistic when zoomed in.
The solution was to adopt a tile-based methodology, where map tiles at different levels of detail are fetched dynamically as a user zooms—the same concept used by Google Maps. I was faced with a choice: implement this highly complex tiling logic myself or use a well-supported library. Since the project’s focus was on data visualization, I opted for the more direct path by using Leaflet, a powerful library for creating dynamic and interactive maps.
The back-end Go scripts that gather and process the data from sources like TeleGeography and PeeringDB were largely unchanged, only needing a few new fields in the JSON output to power the new front end.

Beyond the core technology, I also wanted to incorporate a few small details to improve the user experience and make the map feel more intuitive and personal:
This project continues to be a fascinating exploration of the physical reality of our digital world. By making the map interactive, I hope to provide a more powerful tool for anyone curious about the immense and intricate infrastructure that underpins our daily lives. As global data demand soars, the growth of these subsea cables and peering exchanges will only become more critical. Explore the map, watch the internet grow, and see for yourself how the world gets connected.
This project was a significant undertaking, and I’ve been thrilled to see it shared in various places online. If you choose to share it, I only ask that you please provide attribution by linking back to the project, just as I give credit to my own data sources, TeleGeography and PeeringDB.
Thank you for reading, and please feel free to explore and share the map with others! map.kmcd.dev
此内容由惯性聚合(RSS阅读器)自动聚合整理,仅供阅读参考。 原文来自 — 版权归原作者所有。