惯性聚合 高效追踪和阅读你感兴趣的博客、新闻、科技资讯
阅读原文 在惯性聚合中打开

推荐订阅源

P
Palo Alto Networks Blog
大猫的无限游戏
大猫的无限游戏
Martin Fowler
Martin Fowler
GbyAI
GbyAI
CTFtime.org: upcoming CTF events
量子位
T
The Blog of Author Tim Ferriss
Y
Y Combinator Blog
Microsoft Azure Blog
C
CERT Recently Published Vulnerability Notes
Recent Announcements
A
About on SuperTechFans
aimingoo的专栏
aimingoo的专栏
P
Privacy International News Feed
cs.CL updates on arXiv.org
博客园 - 叶小钗
L
Lohrmann on Cybersecurity
G
GRAHAM CLULEY
T
The Exploit Database - CXSecurity.com
Hugging Face - Blog
Hugging Face - Blog
P
Proofpoint News Feed
NISL@THU
NISL@THU
博客园 - Franky
C
Cybersecurity and Infrastructure Security Agency CISA
The Register - Security
M
MIT News - Artificial intelligence
Know Your Adversary
Know Your Adversary
A
Arctic Wolf
F
Full Disclosure
T
Threat Research - Cisco Blogs
P
Privacy & Cybersecurity Law Blog
The Hacker News
The Hacker News
博客园 - 【当耐特】
D
Docker
T
Tailwind CSS Blog
S
SegmentFault 最新的问题
Cyber Security Advisories - MS-ISAC
Jina AI
Jina AI
Help Net Security
Help Net Security
V
Visual Studio Blog
小众软件
小众软件
B
Blog
Vercel News
Vercel News
云风的 BLOG
云风的 BLOG
N
News and Events Feed by Topic
Forbes - Security
Forbes - Security
N
Netflix TechBlog - Medium
让小产品的独立变现更简单 - ezindie.com
C
Cisco Blogs
Security Archives - TechRepublic

MadLife

算法部署从docker到K8s 聊一聊:AI时代的前夜 Web服务打包exe 聊一聊:我眼中的数据中台 内网ubuntu环境下离线部署K8s 聊一聊:FaaS 在大规模网络爬虫的实践 聊一聊:Golang 使用sync.Pool 降低GC压力 聊一聊:Python和Golang的垃圾回收 聊聊数据库的那些索引 源码阅读——robfig/cron GitHub Actions+Serverless搭建博客 聊聊 MongoDB 聊一聊:敏捷开发 聊一聊:常见的分布式锁 2021书单 sentry部署 MongoDB——TTL索引 S3协议入门 使用 Go 客户端控制 Kubernetes
聊一聊:Prometheus监控系统
Yance Huang · 2023-07-23 · via MadLife

一个健全的系统总是离不开监控系统,一个选择合适的监控系统可以让我们的系统更加健壮,更加稳定。

Prometheus是一种开源的系统监控和警报工具,最初由SoundCloud开发,后来捐赠给了Cloud Native Computing Foundation(CNCF)。它被广泛用于监控容器化应用程序和微服务架构。

Prometheus的主要用途是收集、存储和查询时间序列数据。它通过定期从目标应用程序中获取指标数据,并将这些数据保存在本地数据库中。用户可以使用PromQL(Prometheus查询语言)来查询和分析这些数据,并创建灵活的监控仪表盘和警报规则。

核心组件包括:

Prometheus Server:负责收集和存储时间序列数据。它通过HTTP协议从目标应用程序或者Exporter获取指标数据,并将数据存储在本地的时间序列数据库中。

Exporters:这些是用于从各种应用程序和服务中收集指标数据的客户端软件。Prometheus使用Exporter来监控不同类型的服务,如数据库、Web服务器、消息队列等。常见的Exporter包括Node Exporter(用于监控主机指标)、Blackbox Exporter(用于监控网络服务)、MySQL Exporter(用于监控MySQL数据库)等。

Pushgateway:用于暂存短期的批量指标数据,当目标作业的生命周期较短或不稳定时,这些作业可以将指标推送到Pushgateway,然后由Prometheus从Pushgateway中拉取数据。

Alertmanager:负责处理警报规则并触发警报通知。它可以根据用户定义的条件和聚合逻辑来管理警报的发送。

Grafana(虽然不是Prometheus的一部分,但经常与之配合使用):用于创建漂亮的仪表盘和图表展示Prometheus收集到的监控数据。——chatgpt

dockprom快速搭建

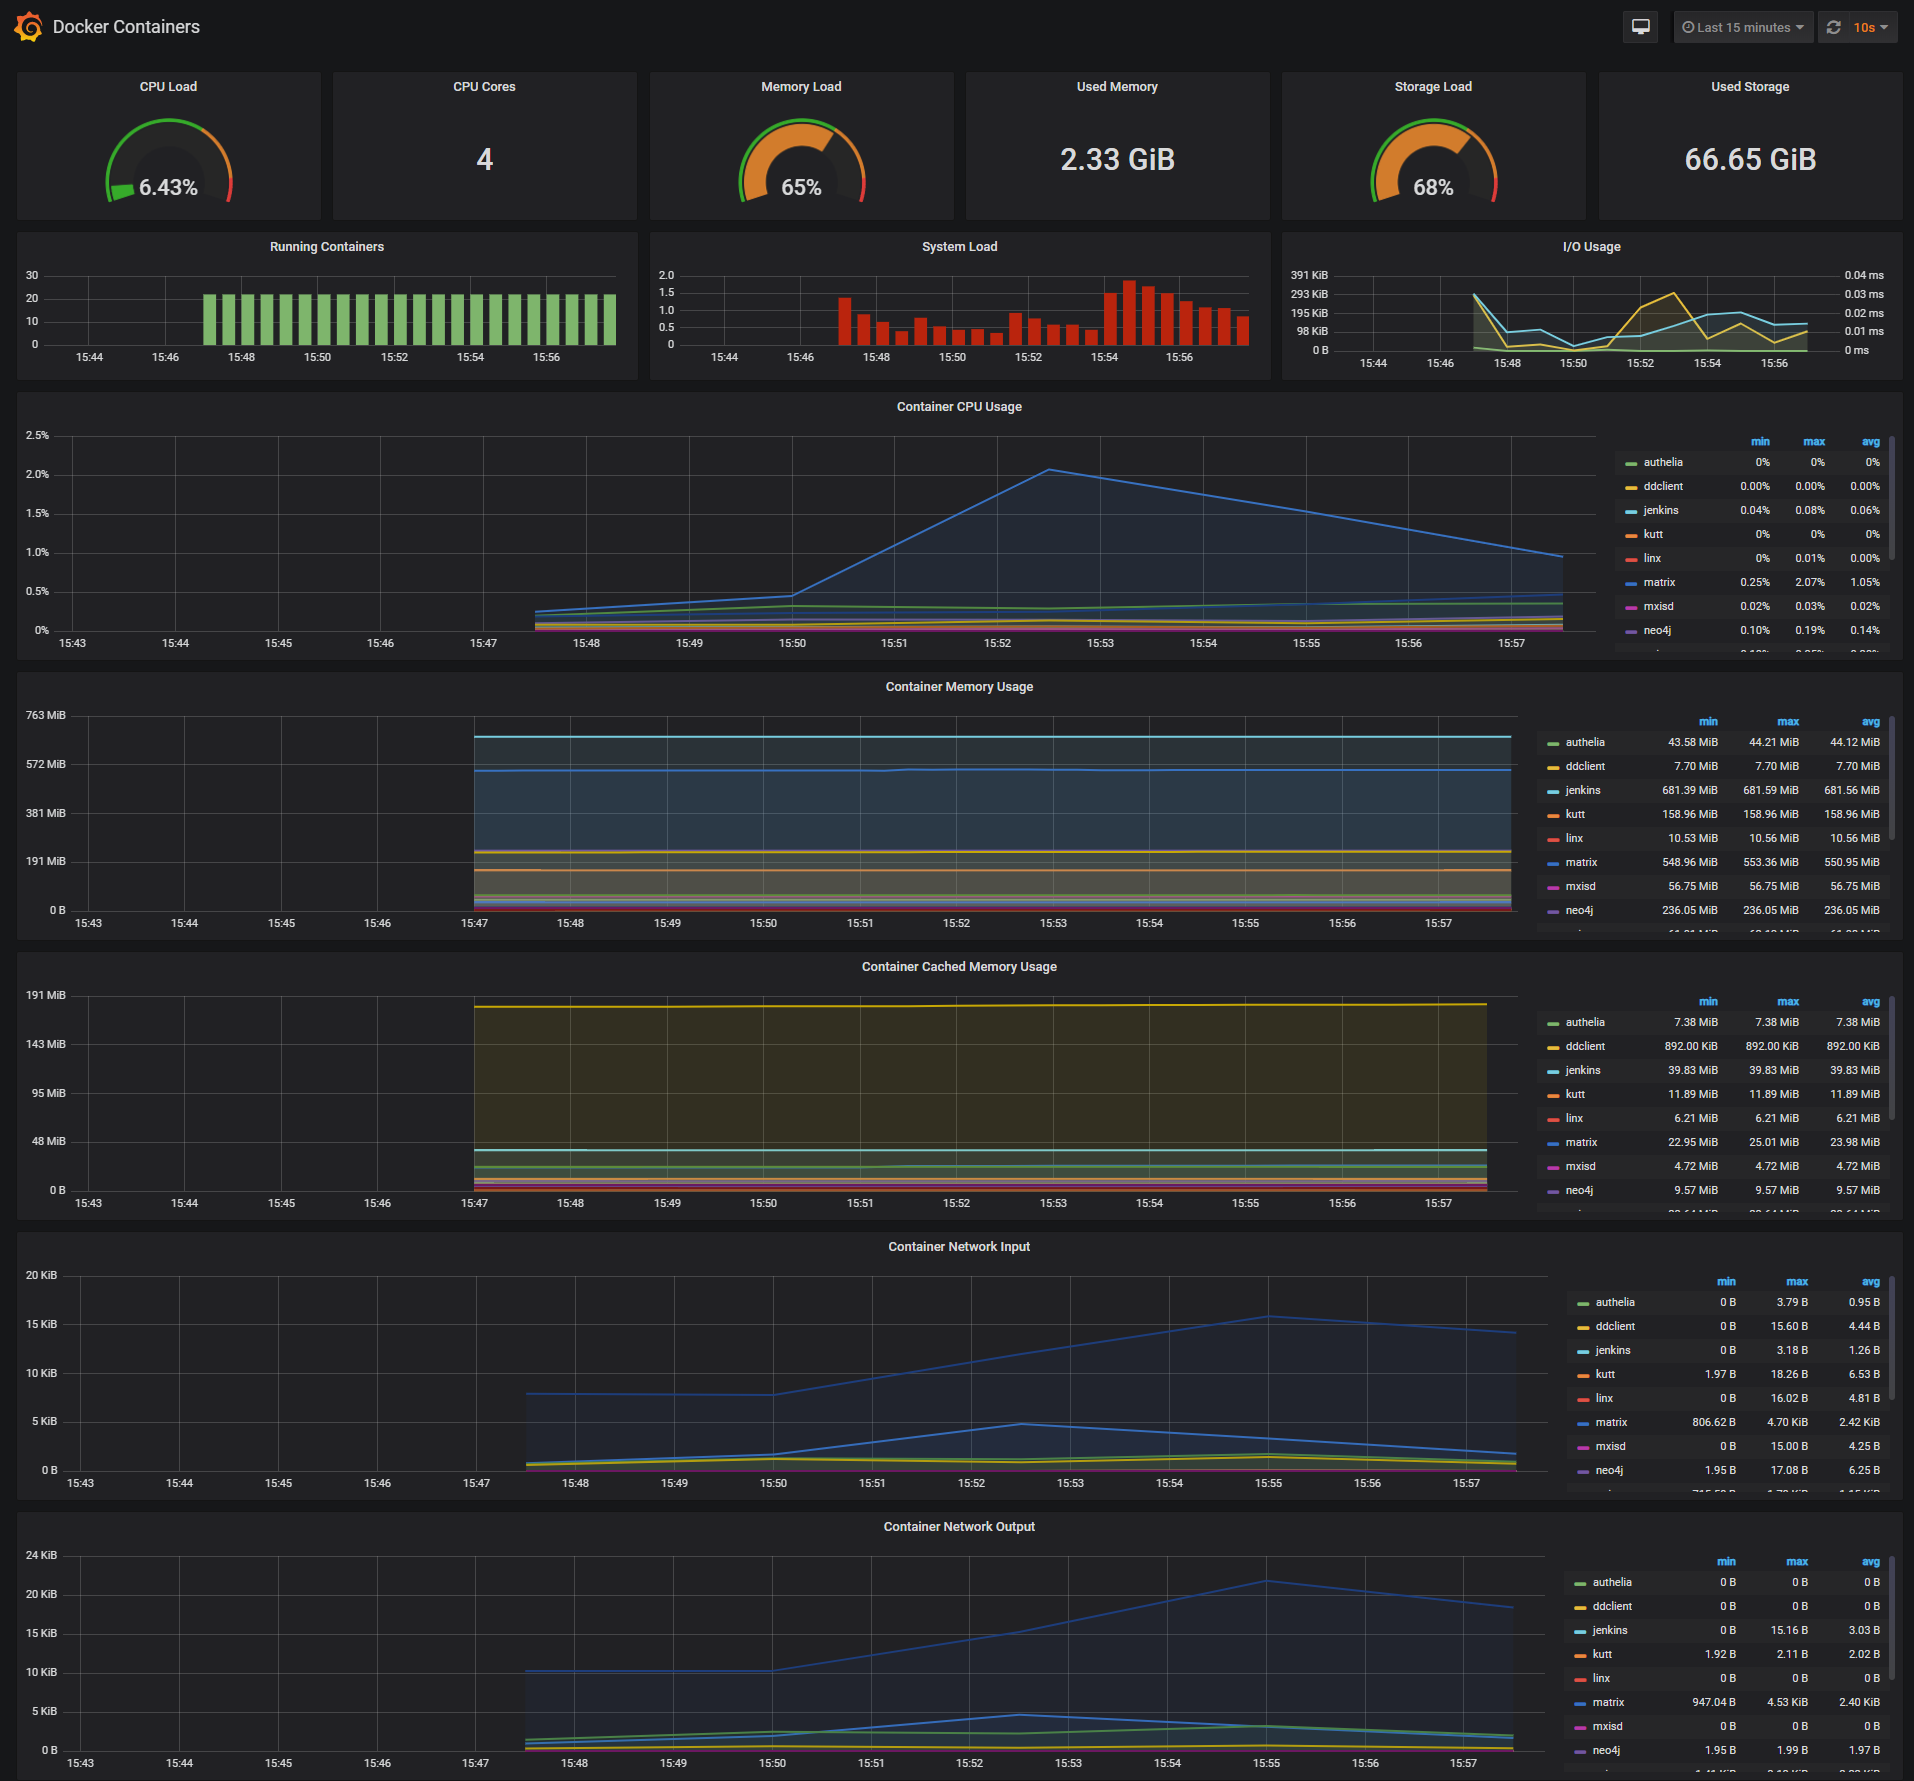
dockprom是一个开源的快速Prometheus部署方案,可以快捷的兼容多台机器上的容器或者硬件指标:

1
2
3
4
git clone https://github.com/stefanprodan/dockprom
cd dockprom

ADMIN_USER='admin' ADMIN_PASSWORD='admin' ADMIN_PASSWORD_HASH='$2a$14$1l.IozJx7xQRVmlkEQ32OeEEfP5mRxTpbDTCTcXRqn19gXD8YK1pO' docker-compose up -d

pCLEzIU.png

WEB服务的监控

这里我已最简单的flask服务来作为例子, prometheus-flask-exporter提供了一系列默认的监控指标:

  • flask_http_request_duration_seconds
  • flask_http_request_total
  • flask_http_request_exceptions_total
  • flask_exporter_info

基于上面的指标可以细化到每一个api的基础使用情况

1
2
3
4
5
6
7
8
9
10
11
12
13
14
15
16
17
18
19
20
21
22
23
24
25
26
27
28
29
30
31
32
33
34
35
36
37
38
39
40
41
42
43
44
45
46
47
48

from flask import Flask, request
from flask_restx import Resource, Api

from prometheus_flask_exporter import PrometheusMetrics

metrics = PrometheusMetrics.for_app_factory()

def create_app():
app = Flask(__name__)
metrics.init_app(app)

with app.app_context():
setup_api(app)

metrics.register_default(
metrics.counter(
'by_path_counter', 'Request count by request paths',
labels={'path': lambda: request.path}
)
)

metrics.register_default(
metrics.counter(
'outside_context',
'Example default registration outside the app context',
labels={'endpoint': lambda: request.endpoint}
),
app=app
)

return app

def setup_api(app):
api = Api()
api.init_app(app)

@api.route('/test')
class ExampleEndpoint(Resource):
def get(self):
return {'hello': 'world'}

if __name__ == '__main__':
app = create_app()
app.run('0.0.0.0', 4000)

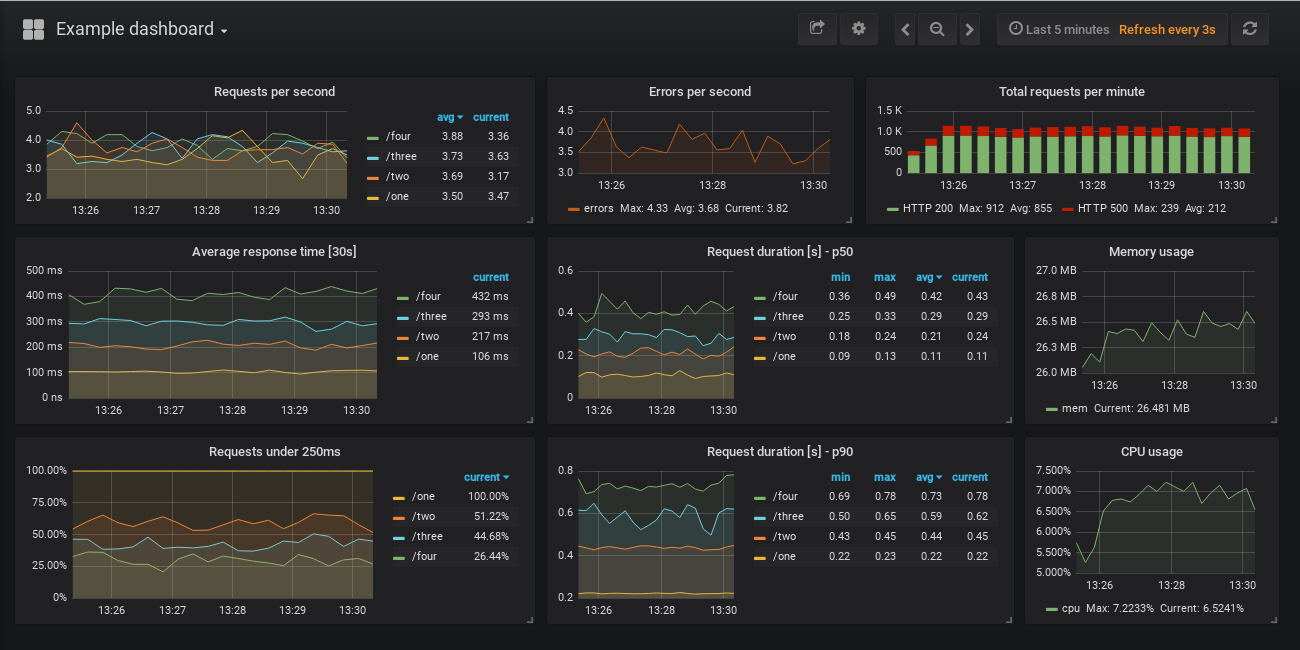
运行后,访问http://localhost:4000/metrics

pCLExaT.png

celery的监控(flower)

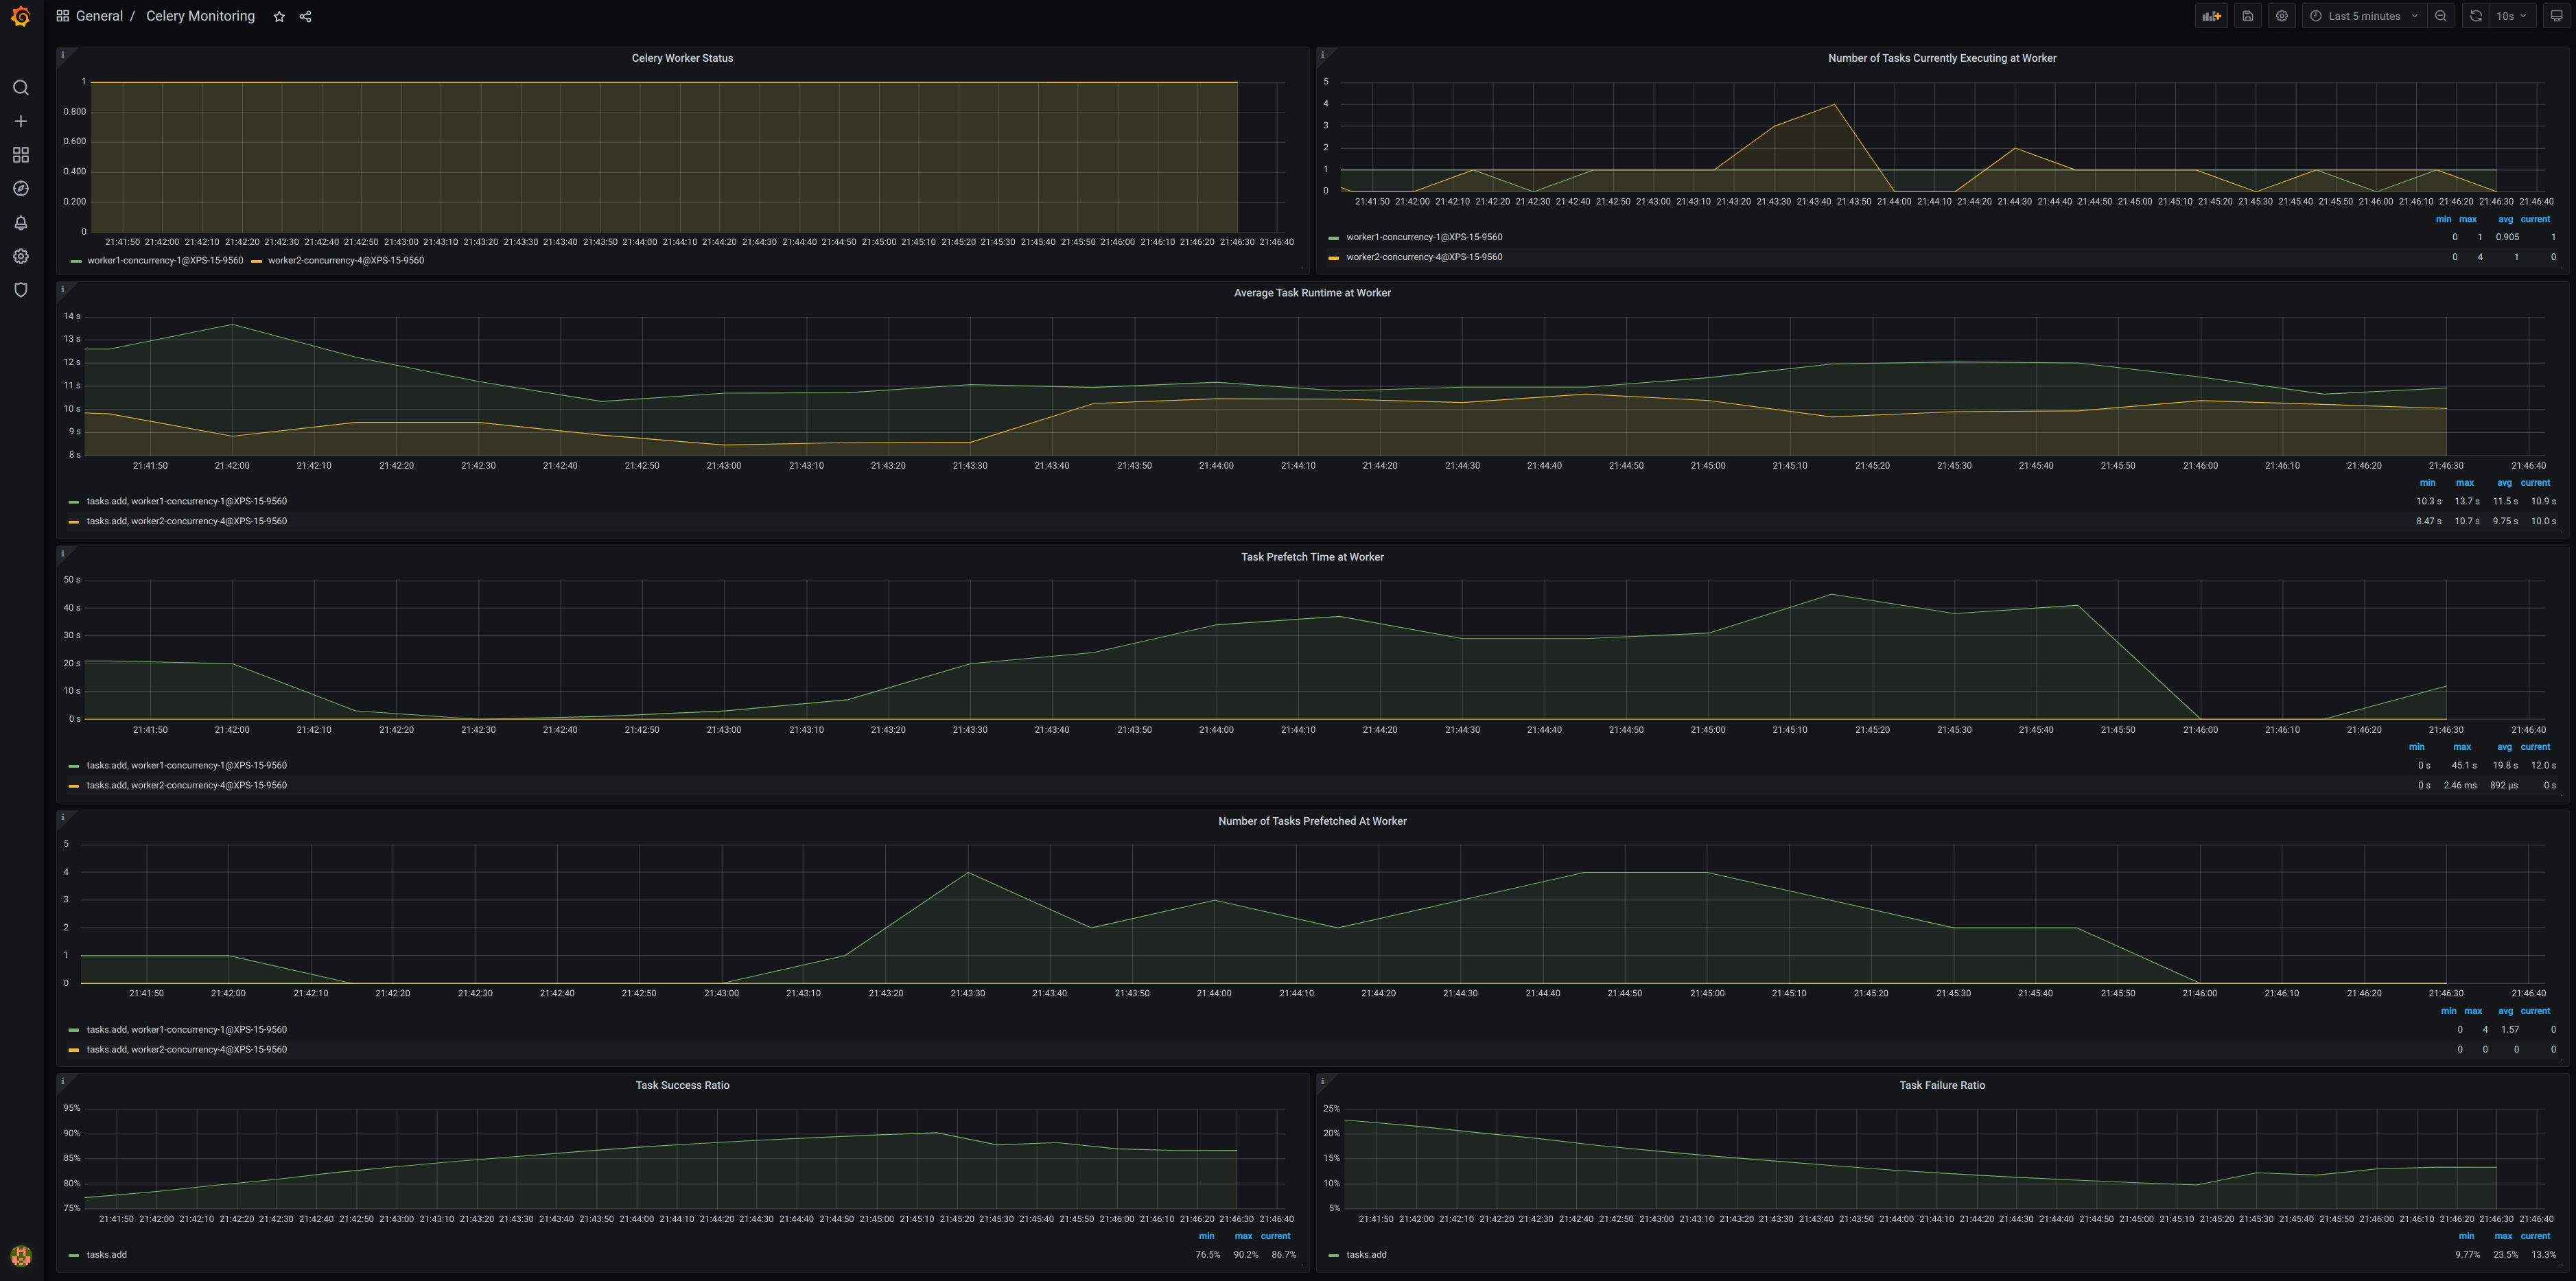
celery已经有了很成熟的flower的监控,同时flower也提供了面向Prometheus的接口,便于统一的监控。具体的见flower文档

其中提供的指标有:

Name Description Labels Instrument Type
flower_events_total Number of times a celery task event was registered by Flower. task, type, worker counter
flower_task_prefetch_time_seconds The time the task spent waiting at the celery worker to be executed. task, worker gauge
flower_worker_prefetched_tasks Number of tasks of given type prefetched at a worker. task, worker gauge
flower_task_runtime_seconds The time it took to run the task. task, worker histogram
flower_worker_online Shows celery worker’s online status. worker gauge
flower_worker_number_of_currently_executing_tasks Number of tasks currently executing at this worker. worker gauge

我习惯于使用一个单独的容器来运行:

1
docker run -v examples:/data -p 5555:5555 mher/flower celery --app=tasks.app flower

prometheus.yml中添加以下配置来进行爬取:

1
2
3
4
scrape_configs:
- job_name: flower
static_configs:
- targets: ['localhost:5555']

pCLVpiF.png