










Local log analysis with PII redaction, rule-based threat detection, anomaly detection, LLM-powered insights, and a web dashboard — all running on your machine, no data leaves your infrastructure by default.
Or stay in the terminal — format auto-detected, PII redacted, threats flagged:
$ logatory scan tests/data/auth.log
------------------------------------------------------------
  Source   : tests/data/auth.log
  Format   : auth_log
  Events   : 7
  PII hits : 5 (mode: redact)
  Findings : 1
------------------------------------------------------------

  Events (7 of 7):

  [    1] 2026-05-18 10:00:01  INFO      Accepted publickey for admin from ip_8390373f port 52341 ssh2
  [    2] 2026-05-18 10:00:15  WARNING   Failed password for invalid user guest from ip_2bcf3253 port 22 ssh2
  [    3] 2026-05-18 10:00:16  WARNING   Failed password for invalid user guest from ip_2bcf3253 port 22 ssh2
  [    4] 2026-05-18 10:00:17  WARNING   Failed password for invalid user guest from ip_2bcf3253 port 22 ssh2
  [    5] 2026-05-18 10:01:00  INFO      admin : TTY=pts/0 ; PWD=/home/admin ; USER=root ; COMMAND=/bin/systemctl restart nginx
  [    6] 2026-05-18 10:01:30  INFO      new user: name=deploy, UID=1002, GID=1002, home=/home/deploy, shell=/bin/bash
  [    7] 2026-05-18 10:02:00  INFO      Disconnected from ip_8390373f port 52341

  Findings (1):

  [LOW] 2026-05-18 10:01:00  sudo_misuse  Sudo Command to Root: admin : TTY=pts/0 ; PWD=/home/admin ; USER=root ; COMMAND=/bin/systemctl restart nginx
The IP addresses above (ip_8390373f, …) are deterministic pseudonyms — the same IP always maps to the same token, so correlation survives while the raw value never reaches storage. This example is reproducible: the log file ships with the repo.
Table of Contents
- Features
- Quick Start
- Installation
- CLI Reference
- Configuration
- PII Redaction
- Detection Rules
- Plugin System
- Anomaly Detection
- LLM Integration
- Web Dashboard & REST API
- Docker
- Contributing
Features
| Capability | Details |
|---|---|
| Format support | Syslog, Nginx access/error, JSON Lines, Windows Event Log (EVTX), plaintext — auto-detected |
| PII redaction | Emails, IPs, credit cards, phone numbers, UUIDs, JWTs, SSH keys — deterministic pseudonymisation or masking |
| Rule engine | YAML-based rules with contains, regex, startswith, endswith, gte, lte operators; multi-field AND/OR |
| Sigma support | Convert Sigma rules to native format |
| Anomaly detection | Statistical Z-score baseline over 60-second buckets, trains automatically from historical logs |
| LLM integration | Ollama (default), Claude, OpenAI-compatible APIs; explain findings, summarize errors, RAG Q&A |
| Web dashboard | FastAPI + HTMX; findings/errors table, trend chart (ECharts), inline LLM explain, log file upload |
| Log upload | Drag-and-drop log upload in the browser — instant scan with PII redaction, results shown inline |
| REST API v1 | Bearer-token auth, JSON endpoints for findings, errors, stats, live event ingestion |
| OpenSearch | Query and analyse logs from OpenSearch / Elasticsearch clusters |
| systemd journal | Read logs straight from journald via journalctl — scan history or follow live |
| Docker logs | Read container logs straight from the Docker daemon — scan or follow, no log stack required |
| Remote over SSH | Pull logs from any SSH-reachable host — no agent on the remote box; scan or follow live with auto-reconnect |
| Grafana Loki | Query a Loki instance with LogQL — scan or follow live |
| Graylog | Query a Graylog server via its search API — scan or follow live |
| Fleet | Declare many log sources in one file — scan, follow, and manage a whole fleet at once |
| Finding persistence | SQLite store for HIGH/CRITICAL findings with retention, dedup, severity filtering |
| FP suppression | Dismiss rules globally or per source file; reversible |
| Markdown export | Automated security reports from the SQLite database |
| Plugin system | Drop Python files into a directory to add custom rules and PII patterns |
| Docker | Multi-stage image, non-root user, /data volume — production-ready |
Quick Start
# Install (core only — no external dependencies beyond PyYAML and typer)
pip install logatory

# Scan a log file
logatory scan /var/log/syslog

# Watch a file in real time
logatory tail /var/log/nginx/access.log

# Start the web dashboard
pip install 'logatory[web]'
logatory serve
That's it. Open http://localhost:8080 in your browser.
Installation
Requirements: Python 3.11+
Core only
pip install logatory
Includes: file scanning, PII redaction, rule engine, anomaly detection, findings persistence, Markdown export, plugin system.
Optional feature sets
pip install 'logatory[web]'         # web dashboard + REST API (FastAPI, uvicorn, Jinja2)
pip install 'logatory[docker]'      # read logs from local Docker containers
pip install 'logatory[opensearch]'  # OpenSearch / Elasticsearch integration
pip install 'logatory[evtx]'        # Windows Event Log (.evtx) support
pip install 'logatory[claude]'      # Anthropic Claude API
pip install 'logatory[embed]'       # ChromaDB for RAG (llm ask command)
Install everything:
pip install 'logatory[web,docker,opensearch,evtx,claude,embed]'Shell auto-completion
logatory --install-completion # bash / zsh / fish / PowerShellCLI Reference
All commands accept --config/-c <path> to specify a config file. Defaults to config.yaml in the working directory.
scan
Parse a log file (or stdin), redact PII, run detection rules, and optionally persist errors and findings.
logatory scan [OPTIONS] [PATH]
| Option | Default | Description |
|---|---|---|
PATH |
stdin | Log file to scan. Use - explicitly for stdin. |
--config/-c |
config.yaml |
Config file path. |
--redact |
redact |
PII handling: redact (hash), mask (<TYPE>), dry-run (show only). |
--limit/-n |
50 |
Max events to display in output. |
--all |
off | Display all events (ignores --limit). |
--format-only |
off | Print detection summary and exit, skip event listing. |
--no-rules |
off | Skip the rule engine entirely. |
--rules-dir |
— | Additional YAML rules directory. |
--track-errors |
off | Persist error groups and HIGH/CRITICAL findings to SQLite. |
--detect-anomalies |
off | Run statistical anomaly detection against the trained baseline. |
--anomaly-source |
file stem | Override the baseline source key. |
--anomaly-threshold |
3.0 |
Z-score threshold for anomaly alerts. |
--explain-findings |
off | Ask the LLM to explain up to 3 HIGH/CRITICAL findings. |
--classify |
off | Ask the LLM to classify a sample of events by severity. |
Examples
# Basic scan with PII masking
logatory scan /var/log/auth.log --redact mask

# Scan a gzip-compressed file and persist results
logatory scan /var/log/nginx/access.log.gz --track-errors

# Read from stdin (e.g. pipe from journalctl)
journalctl -n 1000 | logatory scan -

# Scan with anomaly detection after training the baseline
logatory anomaly learn /var/log/syslog --source syslog
logatory scan /var/log/syslog --detect-anomalies --anomaly-source syslog

# Explain the worst findings with Ollama
logatory scan /var/log/auth.log --track-errors --explain-findings
Docker container logs
No log aggregation stack (ELK, Loki, Graylog) required — if your services
run in Docker, Logatory reads their logs straight from the daemon. Install
the optional dependency and use the native docker command:
pip install 'logatory[docker]'

# Scan all running containers
logatory docker scan

# One container, by name; persist errors
logatory docker scan --name my-service --track-errors

# Filter by label, include stopped containers
logatory docker scan --label app=web --all

# Follow containers in real time (Ctrl+C to stop)
logatory docker tail
logatory docker tail --name my-service --alert-webhook https://hooks.example/logs
Each event is auto-detected per container (JSON, Nginx, plaintext, …),
PII-redacted, and tagged with its container name. docker tail polls the
daemon, so containers started after it launches are picked up automatically.
systemd journal (journald)
On a systemd-based Linux system, Logatory reads logs straight from the
journal — no need to export to a file first. It shells out to journalctl,
so there is no extra dependency to install:
# Scan recent journal entries
logatory journald scan

# One unit, within a time window; persist errors
logatory journald scan --unit nginx.service --since '-1h' --track-errors

# Follow the journal in real time (Ctrl+C to stop)
logatory journald tail
logatory journald tail --unit sshd.service --alert-webhook https://hooks.example/logs
Syslog priorities map onto Logatory severities, and journald tail uses the
journal's native cursor — every poll resumes exactly where the last one left
off, so there are no duplicates and no gaps.
Remote servers (SSH)
For a server reachable only over SSH, Logatory pulls its logs straight over
an existing SSH connection — no agent on the remote box, no open port, no
daemon. It shells out to the system ssh client, so your ~/.ssh/config
(jump hosts, per-host keys, the agent) works unchanged. The remote source is
either a log file or the systemd journal:
# Scan a remote log file
logatory ssh scan user@host --path /var/log/auth.log

# Scan the remote journal, one unit
logatory ssh scan user@host --journald --unit nginx.service --since '-1h'

# Through a jump host, on a non-standard port
logatory ssh scan db01 --path /var/log/syslog --port 2222 --ssh-opt ProxyJump=bastion

# Follow a remote host in real time (Ctrl+C to stop)
logatory ssh tail user@host --path /var/log/app.log
logatory ssh tail user@host --journald --unit sshd.service --alert-webhook https://hooks.example/logs
ssh tail streams over a long-lived connection (journalctl -f / tail -F)
and reconnects automatically if it drops. In journald mode it resumes from
the journal cursor, so a dropped connection costs neither duplicates nor
gaps. Logs are redacted locally, after arriving over the encrypted SSH link.
tail
Watch a log file for new lines in real time. Applies PII redaction and detection rules to every incoming event. Press Ctrl+C to stop.
logatory tail [OPTIONS] PATH
| Option | Default | Description |
|---|---|---|
PATH |
— | Log file to watch (required). |
--redact |
redact |
PII mode: redact, mask, dry-run. |
--from-start |
off | Start from the beginning of the file instead of the tail. |
--no-rules |
off | Skip rule engine. |
--rules-dir |
— | Extra rules directory. |
--track-errors |
off | Persist new errors to SQLite. |
--track-findings |
off | Persist HIGH/CRITICAL findings to SQLite. |
--alert-webhook |
— | POST findings as JSON to this URL. |
--alert-min-severity |
high |
Minimum severity for webhook: low | medium | high | critical. |
--poll-interval |
0.2 |
File poll interval in seconds. |
Dismissed rules (see findings dismiss) are filtered out in real time — no spurious alerts for known false positives.
Examples
# Watch nginx access log and send critical findings to a webhook
logatory tail /var/log/nginx/access.log \
  --track-findings \
  --alert-webhook https://hooks.example.com/security \
  --alert-min-severity high

# Read from the beginning and don't bother persisting
logatory tail /var/log/auth.log --from-start --no-rules
serve
Start the Logatory web dashboard (requires pip install 'logatory[web]').
logatory serve [OPTIONS]
| Option | Default | Description |
|---|---|---|
--host |
127.0.0.1 |
Bind address. Use 0.0.0.0 to expose on all interfaces. |
--port/-p |
8080 |
Port to listen on. |
--config/-c |
config.yaml |
Config file. |
--reload |
off | Auto-reload on source file changes (development mode). |
logatory serve --port 9090
Open http://localhost:8080 to access the dashboard, or http://localhost:8080/api/docs for the interactive REST API documentation.
findings
Browse and manage HIGH/CRITICAL findings persisted by scan --track-errors or tail --track-findings.
logatory findings [list|show|summary|dismiss|undismiss|dismissed]
findings list
logatory findings list [--severity high] [--source nginx.log] [--since 7d] [-n 100]
--since accepts s, m, h, d suffixes: 30m, 24h, 7d, 30d.
findings show <RULE_ID>
Show all stored occurrences for a specific rule:
logatory findings show SSH_BRUTE_FORCE
logatory findings show SSH_BRUTE_FORCE -n 50
findings summary
Print counts by severity and the top 10 rules:
logatory findings summary
findings dismiss <RULE_ID>
Suppress a rule so future scans and tail sessions skip it:
# Global false-positive — suppress everywhere
logatory findings dismiss SSH_BRUTE_FORCE --reason "internal bastion host"

# Suppress only for one source file
logatory findings dismiss NGINX_404_SCAN --source nginx.log --reason "internal scanner"
findings undismiss <RULE_ID>
Re-enable a suppressed rule:
logatory findings undismiss SSH_BRUTE_FORCE
findings dismissed
List all currently active suppressions:
logatory findings dismissed
errors
Browse deduplicated error groups tracked by scan --track-errors.
logatory errors [list|show|new|regression]
errors list
logatory errors list [--sort last_seen|count|first_seen] [--severity error] [-n 50]
errors show <FINGERPRINT>
Show details and the 20 most recent occurrences for an error fingerprint:
logatory errors show abc123def456
errors new
Show errors first seen within a time window — useful for catching regressions after a deploy:
logatory errors new --since 1h
errors regression
Show errors that reappeared after a silence period:
logatory errors regression --silence 24h
rules
Manage and validate detection rules.
logatory rules list [--rules-dir ./my-rules]

logatory rules validate my_rule.yml
logatory rules validate sigma_rule.yml --sigma
anomaly
Train and manage the statistical anomaly detection baseline.
logatory anomaly [learn|status|reset]
anomaly learn
Feed a log file into the baseline. Run this several times on representative logs. At least 5 time buckets are needed before the baseline is considered trained.
logatory anomaly learn /var/log/syslog --source syslog
logatory anomaly learn /var/log/nginx/access.log --source nginx --bucket 300
anomaly status
Show baseline training state for all known source keys:
logatory anomaly status
anomaly reset
Delete baseline data for one source key or all sources:
logatory anomaly reset --source syslog
logatory anomaly reset --all
Once the baseline is trained, enable detection during scan:
logatory scan /var/log/syslog --detect-anomalies --anomaly-source syslog --anomaly-threshold 2.5
llm
LLM-powered log analysis. Supports Ollama (default, local), Claude (Anthropic), and any OpenAI-compatible API.
logatory llm [info|explain|summarize|ask|index]
llm info
Check provider connectivity and list available models:
logatory llm info
llm explain <FINGERPRINT>
Explain a tracked error in plain language:
logatory llm explain abc123def456
llm summarize
Generate a natural-language summary of recent errors:
logatory llm summarize --since 24h
llm ask <QUESTION>
Ask questions about your findings and errors using RAG over the local SQLite database:
# Build the vector index first (requires pip install 'logatory[embed]')
logatory llm index

# Then ask freely
logatory llm ask "What are the most critical security issues from the past week?"
logatory llm ask "Which source files had the most brute-force attempts?"
Privacy note: LLM queries use redacted log data. When using a cloud provider (Claude, OpenAI), a warning is shown before any data is sent.
opensearch
Query and analyse logs from an OpenSearch or Elasticsearch cluster.
logatory opensearch scan [OPTIONS]
logatory opensearch info
Configure the connection in config.yaml under the opensearch: key (see Configuration). Credentials can be set via environment variables to avoid storing them in the config file.
# Check cluster connectivity
logatory opensearch info

# Run detection rules on the last 2 hours of logs
logatory opensearch scan --index "logstash-*" --since 2h --track-errors
loki
Query and analyse logs from a Grafana Loki instance. No extra dependency — Loki is reached over plain HTTP.
# Scan the last hour, filtered by a LogQL stream selector
logatory loki scan --url http://loki:3100 --query '{job="nginx"}' --since 1h

# Multi-tenant Loki, with a bearer token
logatory loki scan --query '{namespace="prod"}' --token "$LOKI_TOKEN" --org-id team-a

# Follow Loki in real time (Ctrl+C to stop)
logatory loki tail --query '{job="app"}' --alert-webhook https://hooks.example/logs
Each Loki log line is run through format detection and parsing, just like a
local file. loki tail polls query_range and resumes from Loki's
nanosecond timestamp, so polls neither drop nor repeat entries. Credentials
can be supplied via LOKI_USERNAME / LOKI_PASSWORD / LOKI_TOKEN.
graylog
Query and analyse logs from a Graylog server via its universal search API. No extra dependency — Graylog is reached over HTTP.
# Scan the last hour with an access token
logatory graylog scan --url http://graylog:9000 --token "$GRAYLOG_TOKEN" --since 1h

# Filter with a Graylog search query
logatory graylog scan --query 'source:web01 AND level:<=3' --track-errors

# Follow Graylog in real time (Ctrl+C to stop)
logatory graylog tail --query '*' --alert-webhook https://hooks.example/logs
Graylog messages keep their structured fields (source, level, timestamp).
graylog tail polls the search API and skips already-seen messages by id.
Authenticate with a Graylog access token (GRAYLOG_TOKEN) or with
GRAYLOG_USERNAME / GRAYLOG_PASSWORD.
fleet
Most Logatory commands read one source. Fleet lets you declare many
sources in a targets.yaml and scan, follow, or manage them all at once —
each target can be any supported type (file, journald, docker, ssh,
opensearch, loki, graylog).
Build the file interactively — the wizard prompts for each target's fields
and keeps secrets out of the file as ${ENV_VAR} references:
logatory fleet init
…or write targets.yaml by hand:
targets:
  - name: web01
    type: ssh
    host: web01.example
    journald: true
    unit: nginx.service
    groups: [web, prod]
  - name: prod-loki
    type: loki
    url: http://loki:3100
    query: '{namespace="prod"}'
    token: ${LOKI_TOKEN}
Then work the whole fleet:
# List the configured targets; --check probes each for reachability
logatory fleet list --check

# Scan every target once, concurrently — redact PII, run rules
logatory fleet scan

# Only the 'web' group, findings only
logatory fleet scan --group web --findings-only

# Follow the whole fleet in real time (Ctrl+C to stop)
logatory fleet tail --alert-webhook https://hooks.example/logs
Targets are fetched concurrently, and a target that fails is reported
without aborting the run. fleet tail polls every target in its own thread,
merges the events into one stream, prints findings plus a periodic heartbeat,
and keeps going if a host drops out. Select subsets with --target NAME or
--group NAME (both repeatable).
In the web dashboard, the Fleet page lists the targets and offers an
add-target form with per-type fields; the Findings and Errors pages gain a
target/group filter populated from targets.yaml. When an API token is set
the browser editor is read-only — manage the fleet with fleet init instead.
export
Generate reports from the SQLite database.
logatory export report [OPTIONS]| Option | Default | Description |
|---|---|---|
--output/-o |
report.md |
Output file path. |
--since |
168h (7 days) |
Look-back window: 24h, 7d, 30d, etc. |
--severity |
all | Minimum severity filter. |
--title |
Logatory Security Report |
Report title. |
--open |
off | Open the report in the system default app after writing. |
# Weekly security report
logatory export report --since 7d --output weekly.md --open

# Critical-only daily report
logatory export report --since 24h --severity critical --title "Daily Critical Alerts"
demo
Interactive demo and database seeding using synthetic data — no real log files, Ollama, or database required for demo run.
logatory demo [run|seed|clear]
demo run
Guided CLI walkthrough of all 7 feature sections (log parsing, PII, rules, error tracking, findings, anomaly detection, LLM):
logatory demo run           # pause after each section
logatory demo run --no-pause  # print everything at once
demo seed
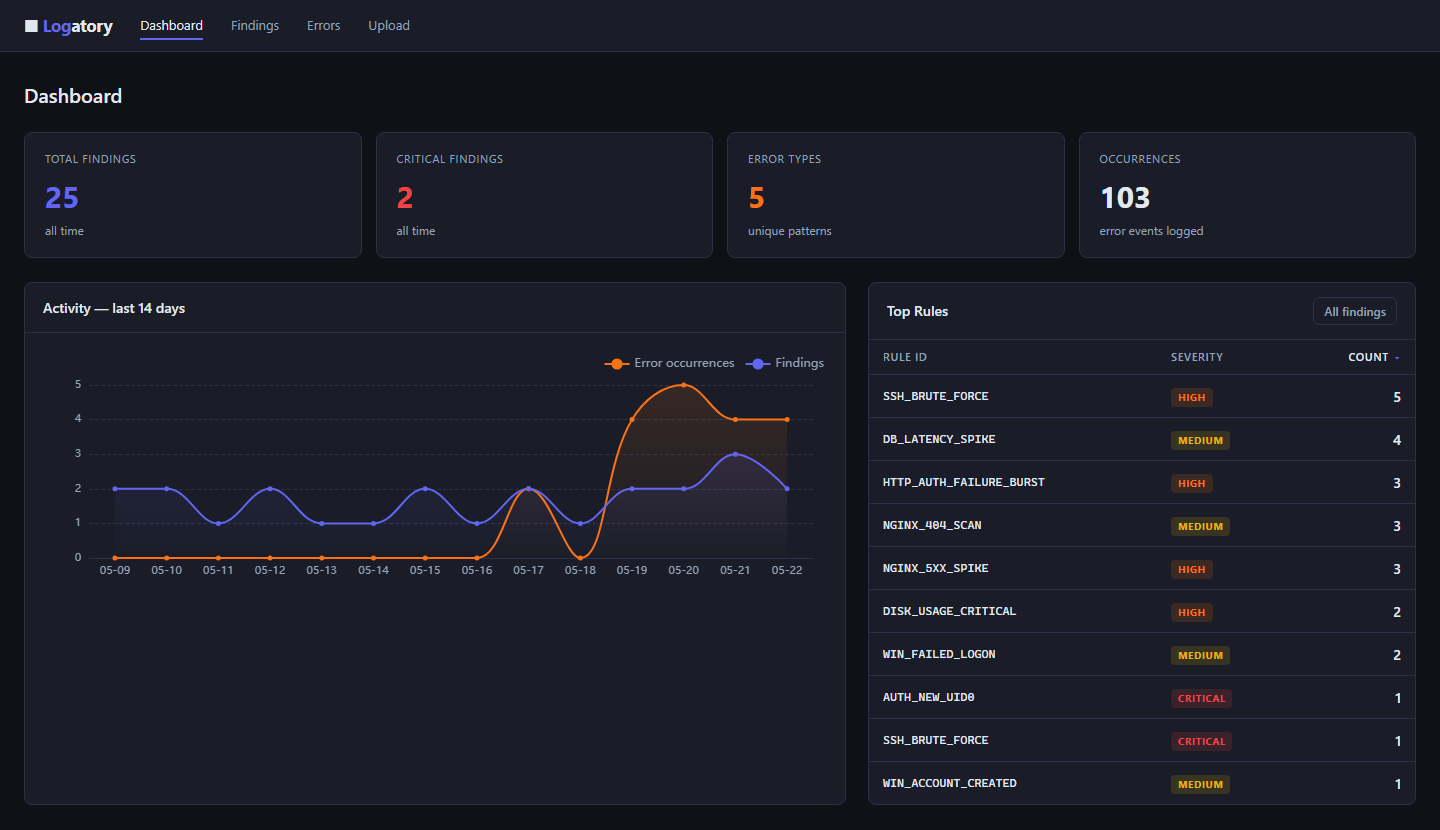
Populate the SQLite database with synthetic findings and errors so the web dashboard has something to display immediately. Inserts 25 findings spread over 14 days (for the trend chart) and 5 error groups. All records are tagged internally and never mixed with real data.
logatory demo seed
demo clear
Remove every record written by demo seed. Real findings and errors are never touched.
logatory demo clear
Configuration
Copy config.yaml.example to config.yaml and adapt:
# SQLite database for findings, errors, and baselines
db_path: logatory.db        # use /data/logatory.db inside Docker

# Custom PII patterns file (optional)
pii_rules_path: pii_rules.yaml

# Salt for deterministic PII pseudonymisation
# Prefer env var LOGATORY_PII_SALT over storing here
pii_salt: ""

# REST API Bearer token — leave empty to disable auth (local dev)
# Prefer env var LOGATORY_API_TOKEN
api_token: ""

# Plugin directory — all *.py files here are auto-loaded at startup
# plugins_dir: plugins/

# Findings persistence behaviour
# findings_retention_days: 30
# findings_min_severity: high   # low | medium | high | critical

llm:
  provider: ollama              # ollama | claude | openai
  model: gemma3:4b
  endpoint: http://localhost:11434
  temperature: 0.1
  max_context_tokens: 8000
  # api_key: ""                 # set via LLM_API_KEY env var for cloud providers

opensearch:
  host: localhost
  port: 9200
  use_ssl: false
  verify_certs: true
  # Credentials — always prefer env vars:
  #   OPENSEARCH_USERNAME / OPENSEARCH_PASSWORD
  #   OPENSEARCH_API_KEY
  #   OPENSEARCH_CLIENT_CERT / OPENSEARCH_CLIENT_KEY / OPENSEARCH_CA_CERTS
  default_index: "logstash-*"
  timestamp_field: "@timestamp"
  message_field: "message"
  severity_field: "level"
  source_name_field: "host.name"
Environment variables
| Variable | Description |
|---|---|
LOGATORY_PII_SALT |
Salt for PII pseudonymisation |
LOGATORY_API_TOKEN |
Bearer token for REST API auth |
OPENSEARCH_USERNAME |
OpenSearch basic auth username |
OPENSEARCH_PASSWORD |
OpenSearch basic auth password |
OPENSEARCH_API_KEY |
OpenSearch API key (id:base64key) |
OPENSEARCH_CLIENT_CERT |
Path to client certificate |
OPENSEARCH_CLIENT_KEY |
Path to client private key |
OPENSEARCH_CA_CERTS |
Path to CA certificate bundle |
LOGATORY_CONFIG |
Config file path used by logatory serve --reload |
PII Redaction
PII redaction runs on every log line before analysis. Three modes are available via --redact:
| Mode | Behaviour | Use case |
|---|---|---|
redact (default) |
Replaces PII with a salted HMAC hash: <email_a3f7c1> |
Preserves correlation across events |
mask |
Replaces PII with a generic tag: <email> |
Maximum anonymity |
dry-run |
Reports PII hits without changing the text | Audit what would be redacted |
Built-in patterns: email addresses, IPv4/IPv6, credit cards (Luhn-validated), phone numbers (international), UUIDs, JWTs, SSH private keys.
Custom PII patterns
Add patterns in pii_rules.yaml:
patterns:
  - name: employee_id
    pattern: '\bEMP-\d{4,8}\b'
    prefix: employee   # produces <employee_abc123>

  - name: order_id
    pattern: '\bORD-[A-Z0-9]{8,12}\b'
    prefix: order
Or register patterns via the Plugin System.
Detection Rules
Rules live in logatory/rules/builtin/ (shipped) or any YAML file you point to with --rules-dir.
Built-in rules
| ID | Severity | Triggers on |
|---|---|---|
SSH_BRUTE_FORCE |
high | Multiple SSH auth failures from one host |
SUDO_MISUSE |
high | sudo: auth failure / sudo: user NOT in sudoers |
AUTH_NEW_UID0 |
critical | New UID 0 account created |
NGINX_404_SCAN |
medium | High rate of 404 responses (scanner pattern) |
NGINX_5XX_SPIKE |
high | Multiple 5xx errors in a short window |
WIN_FAILED_LOGON |
medium | Windows Event ID 4625 (failed logon) |
WIN_ACCOUNT_CREATED |
medium | Windows Event ID 4720 (account created) |
Writing custom rules
id: MY_RULE_001
title: "Sensitive file accessed"
description: "Fires when /etc/passwd is accessed via nginx"
level: high     # low | medium | high | critical
detection:
  match:
    - field: message
      op: contains
      value: "/etc/passwd"
    - field: message
      op: regex
      value: 'GET\s+/etc/passwd'
  condition: any   # any (OR) | all (AND, default)
Supported operators: contains, not_contains, regex, not_regex, startswith, endswith, equals, gte, lte.
Validate a rule before using it:
logatory rules validate my_rule.yml
Sigma rules
Import a Sigma rule and convert it to the native format:
logatory rules validate sigma_rule.yml --sigma
Plugin System
Drop Python files into a directory and register custom rules and PII patterns. Enable in config.yaml:
plugins_dir: plugins/
A plugin file must expose a register(registry) function:
# plugins/my_plugin.py

def register(registry) -> None:
    # Custom detection rule
    registry.add_rule({
        "id": "MY_DB_LEAK",
        "title": "Database credentials exposed in log",
        "description": "Fires when a connection string appears in a log message.",
        "level": "critical",
        "detection": {
            "match": [
                {"field": "message", "op": "regex", "value": r"postgresql://\S+:\S+@"},
            ]
        },
    })

    # Custom PII pattern — redacts internal employee IDs
    registry.add_pii_pattern(
        name="employee_id",
        pattern=r"\bEMP-\d{4,8}\b",
        prefix="employee",
    )

    # Load an entire directory of YAML rule files
    from pathlib import Path
    registry.add_rule_dir(Path(__file__).parent / "my_rules")
Plugin rules participate in both logatory scan, logatory tail, and the web dashboard rule engine. Plugin PII patterns apply to every redaction pass. A plugin that raises an exception is logged as a warning and skipped — it never crashes the host process.
Anomaly Detection
Logatory uses a statistical Z-score baseline to detect unusual log activity without writing any rules. Features tracked per 60-second bucket: total event count, error rate, warning rate.
Training workflow:
# Step 1: Feed representative logs (repeat for several days of data)
logatory anomaly learn /var/log/syslog --source syslog

# Step 2: Check training state
logatory anomaly status
# shows: syslog → 42 observations  trained ✓

# Step 3: Enable detection in scan or tail
logatory scan /var/log/syslog --detect-anomalies --anomaly-source syslog
At least 5 time buckets are required before the baseline is used. The baseline grows automatically every time you scan with --detect-anomalies — no separate training step is needed once you're in production.
Adjust sensitivity with --anomaly-threshold (default: 3.0 standard deviations):
# More sensitive
logatory scan /var/log/syslog --detect-anomalies --anomaly-threshold 2.0

# Less sensitive
logatory scan /var/log/syslog --detect-anomalies --anomaly-threshold 4.0
LLM Integration
Ollama (recommended — fully local)
# Install and start Ollama: https://ollama.ai
ollama pull gemma3:4b

# Default config already points to http://localhost:11434
logatory llm info
Claude (Anthropic)
# config.yaml
llm:
  provider: claude
  model: claude-3-5-haiku-20241022
export LLM_API_KEY=sk-ant-...
logatory llm info
OpenAI-compatible APIs
llm:
  provider: openai
  model: gpt-4o-mini
  endpoint: https://api.openai.com/v1
export LLM_API_KEY=sk-...When using a cloud provider, Logatory prints a warning before sending any redacted data to the external API.
Web Dashboard & REST API
Start the server (requires pip install 'logatory[web]'):
logatory serve --port 8080
Dashboard pages
| URL | Description |
|---|---|
/ |
Overview with 14-day trend chart and quick stats |
/findings |
Findings table with severity filter, inline LLM explain |
/errors |
Error group table with frequency and recency sorting |
/upload |
Drag-and-drop log file upload with instant scan results |
Log file upload
Navigate to /upload in the browser to scan any log file without leaving the dashboard:
- Drag-and-drop or click to browse —
.log,.txt,.gz,.json - Choose PII mode: Redact (pseudonymize), Mask (
<TYPE>), or Dry-run - Results appear inline (no page reload): stat cards, findings table sorted by severity, 20-event sample
- Nothing is persisted — purely transient analysis; use
logatory scan --track-errorsto save results - Maximum upload size: 10 MB
REST API v1
Base path: /api/v1/
Interactive docs: /api/docs
| Method | Path | Description |
|---|---|---|
GET |
/api/v1/health |
Liveness probe (no auth) |
GET |
/api/v1/findings |
List findings (?severity=high&since_hours=24&source=nginx.log) |
GET |
/api/v1/findings/{id} |
Get finding by ID |
GET |
/api/v1/errors |
List error groups (?sort=count) |
GET |
/api/v1/errors/{fingerprint} |
Get error group + recent occurrences |
GET |
/api/v1/stats |
Aggregate counts |
POST |
/api/v1/events |
Ingest a raw log line → returns triggered findings |
Authentication
Set api_token in config.yaml or via LOGATORY_API_TOKEN. Pass it as:
Authorization: Bearer <token>
Leave empty to disable auth (for local development or Docker with network-level access control).
Event ingestion example
curl -X POST http://localhost:8080/api/v1/events \
  -H "Authorization: Bearer mytoken" \
  -H "Content-Type: application/json" \
  -d '{"raw": "Failed password for root from 1.2.3.4 port 22", "source": "sshd"}'
Docker
Quick start
docker compose up -d
The stack starts Logatory on port 8080 with a named volume for the SQLite database.
Environment variables for Docker
# docker-compose.yml (or .env file)
LOGATORY_API_TOKEN=change-me-in-production
LOGATORY_PII_SALT=a-long-random-string
Build and run manually
docker build -t logatory .

docker run -d \
  -p 8080:8080 \
  -v logatory-data:/data \
  -e LOGATORY_API_TOKEN=mytoken \
  -e LOGATORY_PII_SALT=mysalt \
  logatory
The container runs as a non-root user (logatory, UID 1001). The database and config are stored in /data.
Scanning log files inside Docker
Mount the host log directory and run a one-shot scan:
docker run --rm \
  -v /var/log:/logs:ro \
  -v logatory-data:/data \
  logatory \
  logatory scan /logs/syslog --track-errors
Demo data for the web dashboard
Seed the database with synthetic findings and errors so the dashboard shows data immediately:
# Populate (25 findings over 14 days + 5 error groups)
docker compose exec logatory logatory demo seed

# Remove all demo data (real data is untouched)
docker compose exec logatory logatory demo clear
Alternatively, upload a real log file via the browser at http://localhost:8080/upload for an instant, transient scan.
Contributing
Contributions are welcome. See CONTRIBUTING.md for the development setup, the test and lint workflow, the project layout, and how to submit changes.
Security issues: please follow the Security Policy — do not open a public issue.