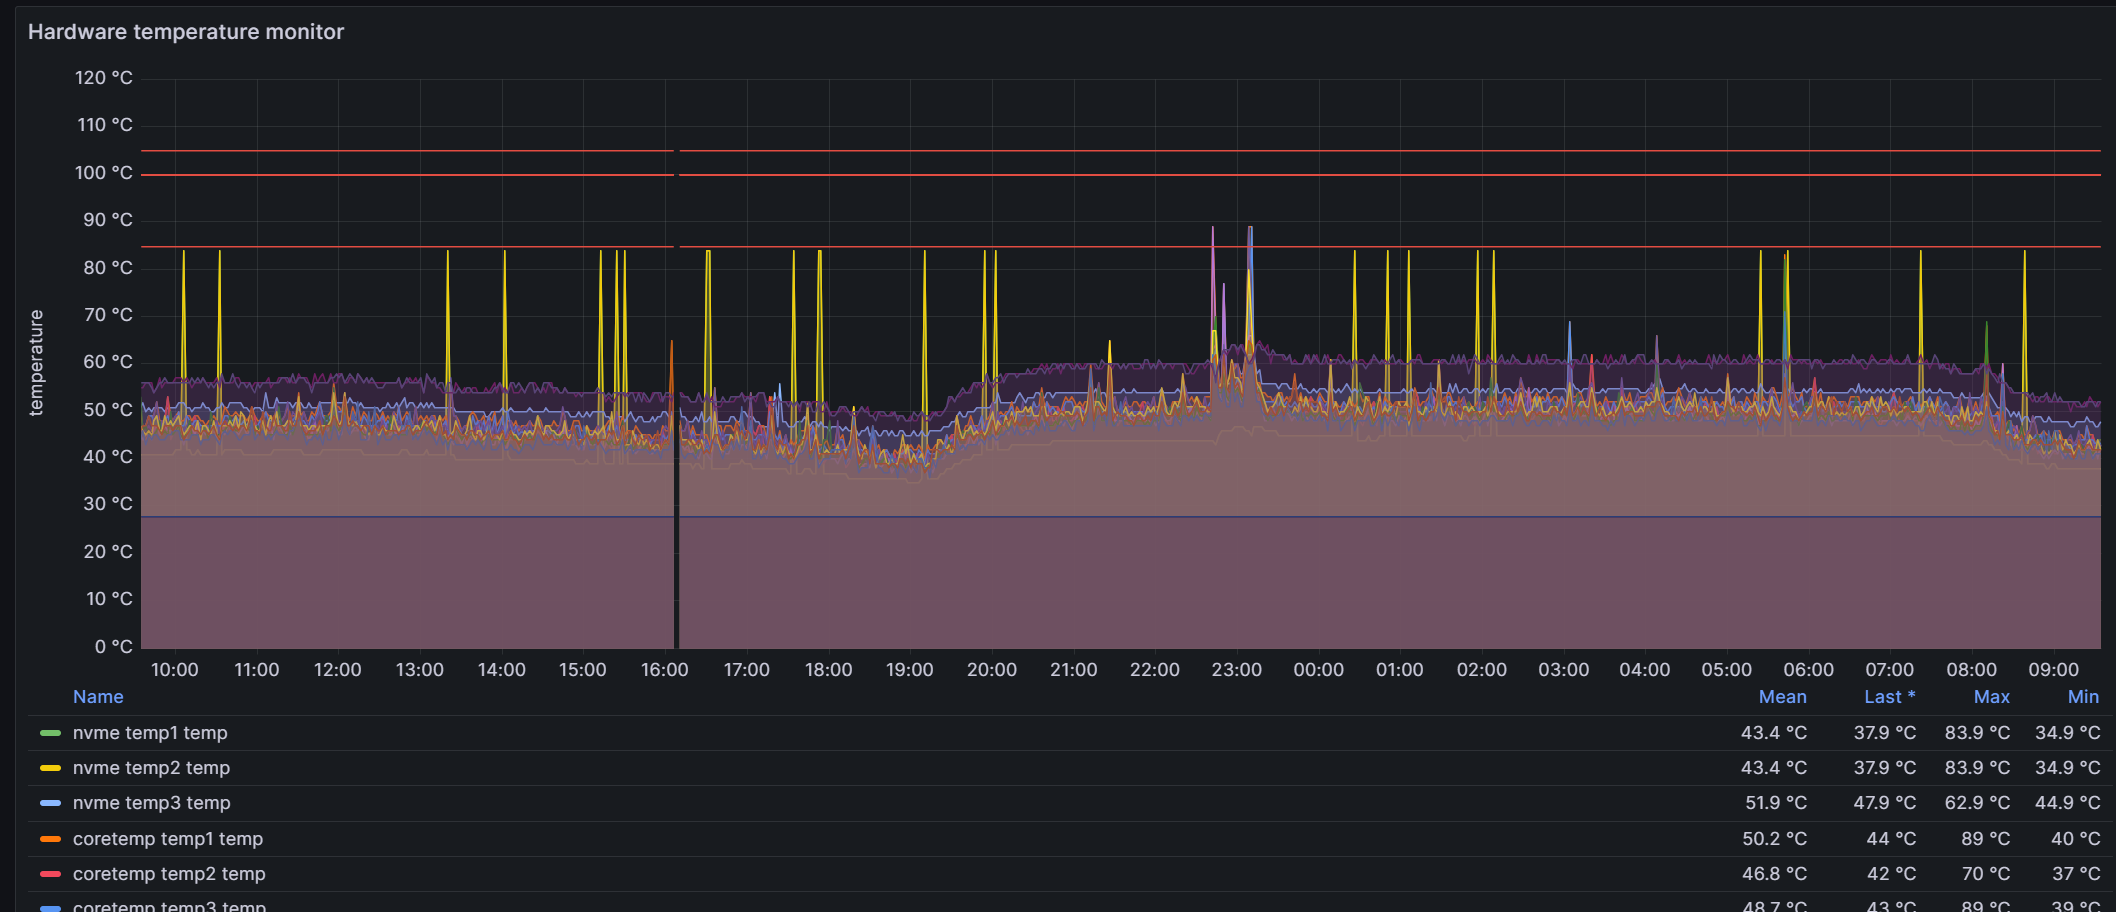
pve中一块nvme磁盘最近偶尔会报温度过高, 所以需要加个监控, 之前已经装过node_expoter, 但是其磁盘硬件监控这一块的信息不够全面,其更多强调的是磁盘的性能,比如IO等。 温度监控这一块也有, 但是不够直观明显,而且缺少其他的一些磁盘硬件本身的信息, 下图是node_exporter监控硬件温度,在Hardware Misc里的Hardware temperature monitor中的显示信息:
基于此, 需要一个专门用来收集磁盘硬件本身信息的exporter, prometheus提供了一个基于smart ctl的exporter, 地址是https://github.com/prometheus-community/smartctl_exporter
因为这是直接监控硬件的, 所以我是直接安装在宿主机上的(包括之前的node_exporter), 没有安装在虚拟机上。
smartctl _exporter安装
进入 https://github.com/prometheus-community/smartctl_exporter/releases下载自己机器需要的版本, 此处以0.11.0版本为例, 登录宿主机执行命令:
1
wget https://github.com/prometheus-community/smartctl_exporter/releases/download/v0.11.0/smartctl_exporter-0.11.0.linux-amd64.tar.gz
解压
tar -xzf smartctl_exporter-0.11.0.linux-amd64.tar.gz移动
cp smartctl_exporter /usr/bin此时执行
smartctl_exporter命令, 如果有正确输出,则表示安装成功
设置开启自启
在
/etc/systemd/system下新建一个配置文件smartctl_exporter.service,内容如下:1
2
3
4
5
6
7
8
9
10
11[Unit]
Description=AutoStart smartctl_exporter
After=network.target
[Service]
ExecStart=/usr/bin/smartctl_exporter
RemainAfterExit=yes
Restart=on-failure
[Install]
WantedBy=multi-user.target执行命令:
1
2
systemctl enable smartctl_exporter.service
systemctl start smartctl_exporter.service
prometheus与grafana设置
prometheus的配置文件加上smart_ctl的监控(默认的端口是9633), 配置如下:
1
2
3
- job_name: 'pve-smart-ctl-exporter'
static_configs:
- targets: ['主机IP:9633']grafana导入模板, 模板ID为
20204, 效果如下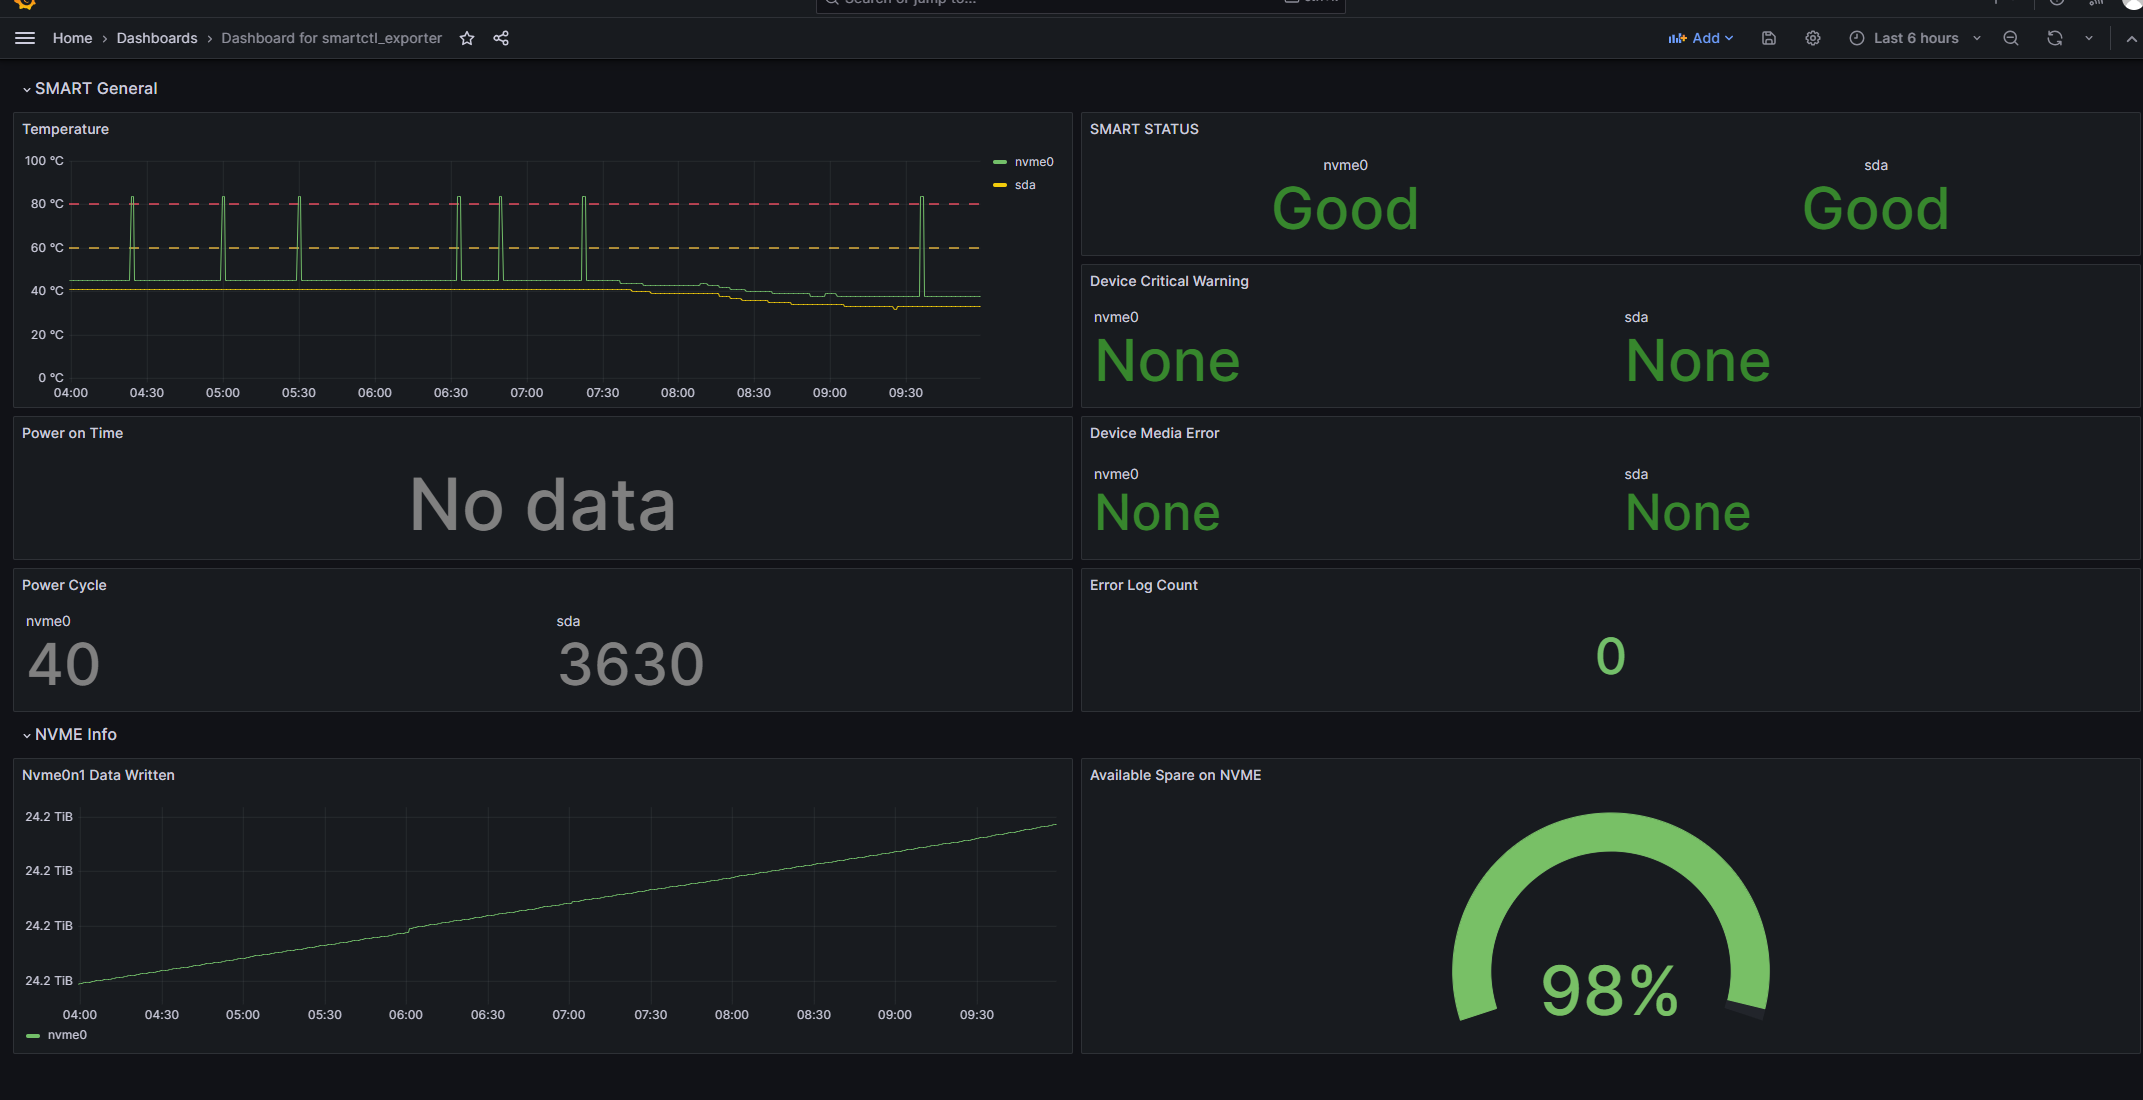
至此, 大功告成。