







The AI debate is stuck on the wrong question.
The question is not whether AI is a bubble. Nor is it whether NVIDIA is expensive, whether Michael Burry is early again, or whether productivity gains will eventually lower inflation. The better question is an accounting one: who needs to earn what return for the AI capex cycle to make sense?
At the bottom of the stack, GPU, HBM, networking, power, and cooling suppliers are already earning. The capex is real. The checks have cleared. That was the first phase of the trade.
The harder question sits one layer above. Hyperscalers and neoclouds are converting capital into compute. Compute becomes tokens. Tokens must become revenue. Revenue must become gross profit after depreciation, power, financing, and model costs. And finally, the buyers of those tokens must earn a return high enough to keep spending.
Only then does AI become a true macro productivity shock rather than a capital-spending boom with better branding.
So this is not another bubble essay — that genre is already a landfill with charts. It is not a valuation note on any single stock, and it is not a referendum on Michael Burry’s track record. It is also not a claim that AI is inflationary, or that it is disinflationary; it will turn out to be both, through different channels, on different clocks. The claim is structural: AI is a chain of required returns. A stack of linked ledgers, each of which must clear its own hurdle rate for the layer below it to stay funded. The market has priced the first ledger with enthusiasm. The macro consequences — for growth, for inflation, and above all for the long end of the bond market — depend on the ledgers it has barely begun to audit.
Every AI headline — a GPU order, a neocloud financing, an enterprise pilot, a Treasury selloff — is an entry on one of those ledgers, posted against one of those hurdles. What follows is the map.
Why does the bubble framing fail? Because it compresses four different balance sheets into one word.
A bubble verdict treats AI as a single asset with a single price. But the AI cycle is a stack of four linked ledgers, with different owners, different time horizons, and different required returns:
The infrastructure ledger. NVIDIA, HBM and memory suppliers, foundries, advanced packaging, networking, power equipment, and cooling. They earn today because hyperscalers and neoclouds are spending today. Their proof is quarterly and financial.
The hyperscaler and neocloud ledger. Cloud incumbents and GPU-rental specialists must convert installed compute into rented or sold capacity at utilization and gross margin sufficient to cover depreciation, power, financing, and the risk that the assets age out before they pay back.
The token buyer ledger. Enterprises and consumers must receive more value from tokens than the tokens cost — labor savings, revenue lift, faster software, automation, fewer errors. If the buyer’s return is negative, every ledger below it is being funded by a future that will not arrive.
The macro ledger. If token usage raises economy-wide productivity, trend growth and the neutral real rate can rise. If AI capex strains power, copper, grid equipment, and capital markets faster than it raises productivity, the same buildout shows up as bottleneck inflation and term premium instead. Either way, the bond market is in this trade whether it wants to be or not.
The geometry matters, so make it concrete. Each ledger is the revenue line of the one below it. NVIDIA’s revenue is hyperscaler capex. Hyperscaler revenue is enterprise token spend. Enterprise token spend is justified only by corporate operating leverage. And corporate operating leverage becomes macro productivity only if it is broad enough to move the aggregate data.
That is why AI cannot be judged by the bottom ledger alone. The bottom ledger can look spectacular while the top ledger is still unproven. And it is why the stack carries a peculiar funding asymmetry right now. The bottom has been paid in cash. The middle has paid in capital. The top has, so far, paid mostly in expectations.
That asymmetry is the entire macro question.
For the bottom ledger, the proof requirements are old-fashioned and near-term. Are orders real? Are margins holding? Are lead times tight? Are ASPs firm? Are customers taking delivery? Are inventories clean?
On those tests, the first ledger has already closed its books. NVIDIA’s most recent quarter — Q1 of fiscal 2027 — reported data-center compute revenue of $60.4bn and data-center networking revenue of $14.8bn, the latter up 199% year over year.1 Memory and HBM remain structurally tight. Power and cooling sit in the queue-constrained part of the cycle, where the binding question is delivery slots, not demand.
So the first-layer trade was simple: capex was real, supply was tight, suppliers earned. That part is not the debate anymore.
The relevant question about the bottom ledger is different: how long can the layer above keep paying it? Supplier earnings are not self-justifying. They are a derivative of someone else’s capital budget, and capital budgets are a derivative of someone else’s expected return. Which is why the cycle is best read not as one trade but as a ladder of hurdles.
Every layer’s revenue is the layer above’s cost. So each layer must generate a return that lets the next layer keep paying. Read from the bottom of the stack up, the ladder looks like this:
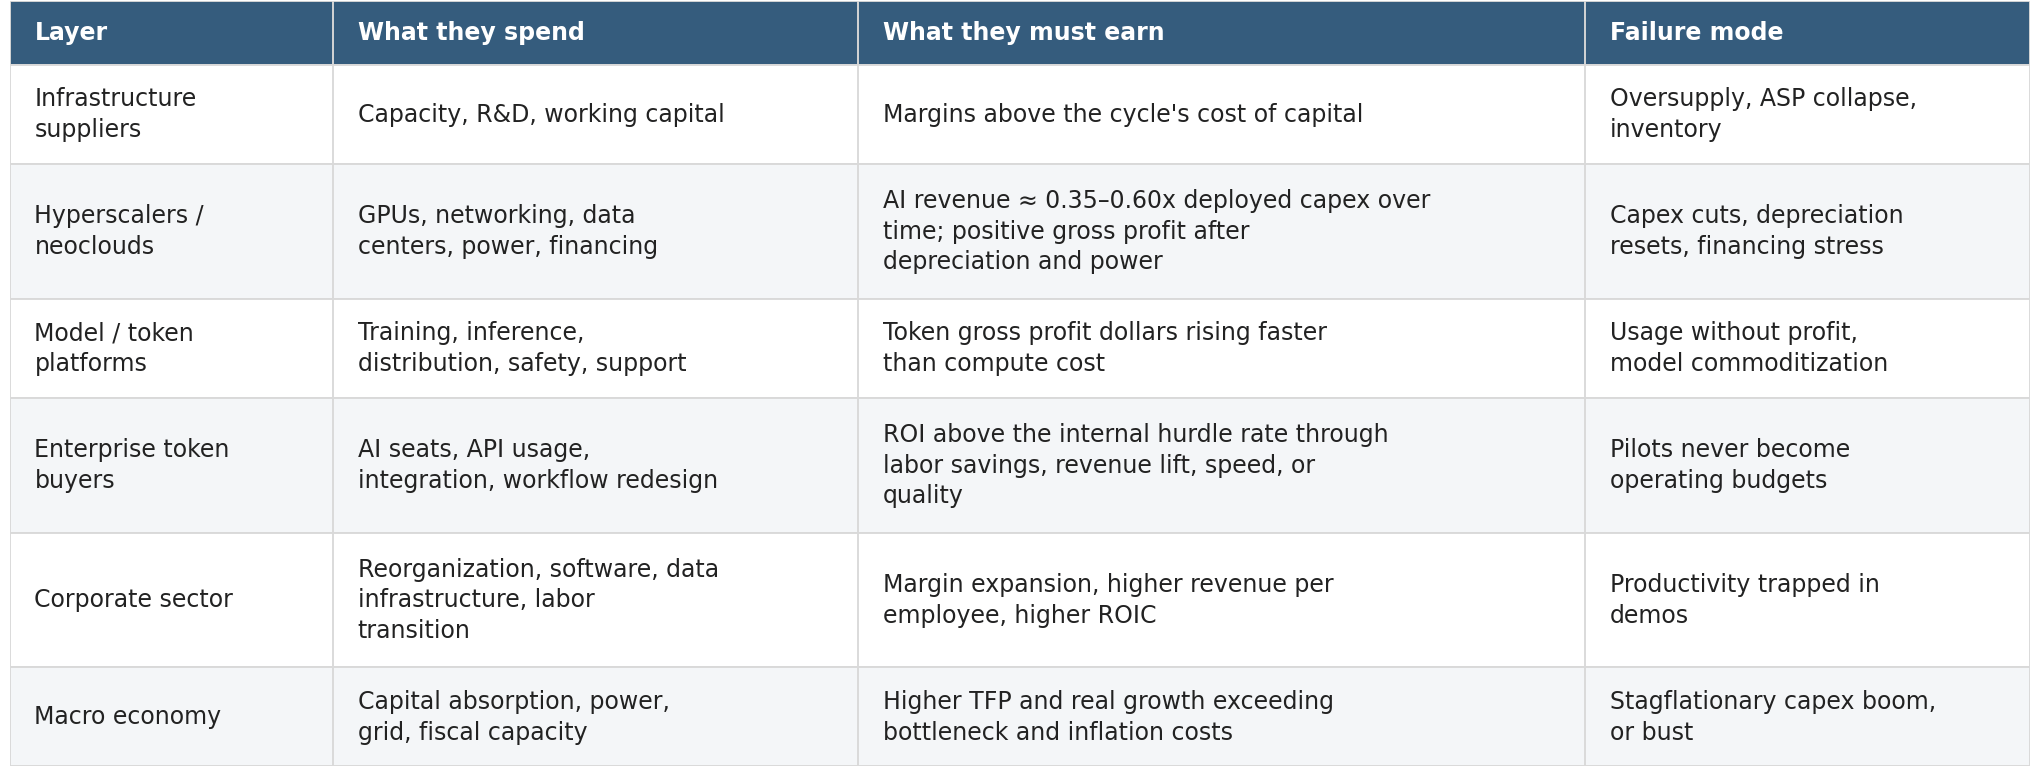
The middle rung deserves its arithmetic, because it anchors everything above and below it. Compute is short-lived capital. If the economic life of a deployed AI dollar is on the order of four to six years, depreciation alone consumes roughly 17–25 cents of it per year. Power, cooling, and operations take their share on top. Financing is no longer free. And the capital is supposed to earn a return, not merely amortize itself. Stack those, and annual monetizable AI revenue — revenue someone actually pays for AI capability, as opposed to internal usage and bundled giveaways — probably needs to approach something like 0.35–0.60x deployed AI capex over time for the system to earn its keep. Call the central hurdle 0.5x. The band is there to be argued with: stretch asset lives toward eight years and the hurdle slides toward 0.3x; shorten them toward three, or let power and financing costs climb, and it pushes past 0.6x.
Now scale it. If cumulative AI capex eventually approaches $3 trillion, the system needs roughly $1 trillion to $1.5 trillion of annual monetizable AI revenue — the bottom of the band up through the central 0.5x hurdle; the full 0.6x top would demand $1.8 trillion — to fully validate the capital cycle. That band is an estimate, not divine scripture delivered from Mount Spreadsheet. Its job is not to be right to the decimal. Its job is to give the debate a number — because a debate with a number can be settled by evidence, and a debate without one just gets louder. Whatever today’s monetizable AI revenue actually is — definitions vary widely enough to be their own argument — nobody serious puts it near a trillion dollars a year. The gap between here and the hurdle is not a footnote to the AI cycle. It is the AI cycle. The exact number matters less than the direction of travel: the ratio of monetizable AI revenue to cumulative AI capex has to rise materially — and soon — for the supplier-led capex boom to become a self-funding productivity cycle.
But the 0.5x hurdle is only the middle layer. It tells us what hyperscalers and neoclouds need to earn on deployed compute. It does not tell us whether the enterprise buyer earns a return on tokens. That is the next and more important hurdle. If a hyperscaler earns a 40% gross margin selling tokens, but the buyer gets only 70 cents of value for every dollar spent, the system can grow for a while but cannot compound. Eventually the buyer stops paying, and the hyperscaler’s return collapses back into the supplier’s order book.
The ladder, in other words, is only as strong as its weakest hurdle. The next three sections climb it.
What does a hyperscaler actually have to prove?
Not that demand exists. Demand observably exists. What the hyperscaler must prove is that capital converted into compute converts into gross profit. The chain runs through five conversions — capital into compute, compute into tokens, tokens into revenue, revenue into gross profit, gross profit into an acceptable return on the deployed base — and each conversion has a loss factor:
GPU and server depreciation,
power,
cooling,
financing,
networking,
maintenance,
model and inference costs,
obsolescence risk,
utilization risk.
Here a fence is needed, because the most quoted statistic in this debate is the wrong one. Revenue per token is not the metric. Falling revenue per token is routinely cited as evidence the economics are deteriorating. On its own it proves nothing. If inference costs fall faster than prices, and volume elasticity is high, falling revenue per token is exactly what a successful cost-curve collapse looks like from the inside. Cheaper tokens can mean more gross profit dollars, not fewer. Usage alone proves nothing either — usage is a necessary condition for the economics, not evidence of them.
The metrics that actually settle the token ledger are:
total token gross profit dollars,
gross profit per watt,
utilization-adjusted compute margin,
AI revenue as a share of cumulative AI capex,
depreciation-adjusted return on deployed compute.
None of these are disclosed cleanly today. That is worth pausing on. The decisive metrics of the largest capital-spending cycle in technology history are currently being estimated by outsiders from fragments — an accounting vacuum that both bulls and bears fill with temperament.
Why would anyone keep buying a trillion dollars of tokens a year?
This is the least discussed layer and probably the most important. Enterprises do not buy tokens because Sam Altman needs a data center. They buy tokens if — and only for as long as — the tokens generate a return. That return must show up somewhere concrete:
fewer labor hours,
higher output per worker,
faster software development,
customer-service automation,
lower SG&A,
higher conversion,
faster product cycles,
better retrieval and fewer errors,
lower external service spend.
The arithmetic is brutally simple. If an enterprise spends $1 on AI tokens and gets $1.30 of value, the cycle can compound: budgets grow, deployment widens, and token spend becomes a durable expense line, like cloud or electricity. If it gets $0.70 of value and keeps spending because the CEO wants to sound modern on earnings calls, that is not productivity. That is shareholder-funded theater — and CFOs eventually close theaters.
The current evidence is mixed in exactly the way you would expect a few years into a general-purpose technology: visible, measurable wins in narrow domains — software development, support automation, document-heavy workflows — and a long tail of pilots that have not yet escaped the innovation budget. The macro question is whether token spend graduates to the operating budget. Innovation budgets are sentiment. Operating budgets are returns.
And if buyers do earn their return, where does it show up first? Not in GDP. One ledger up.
The rosy AI case is not simply higher GDP. It is higher corporate operating leverage.
If enterprises earn positive returns on token spend, the first visible macro-financial evidence should be corporate margins. A firm using AI well should be able to grow revenue faster than headcount, reduce SG&A intensity, shorten software and product cycles, automate support, improve conversion, or cut external service spend. That is how token ROI becomes corporate earnings: revenue per employee rises, the labor input per unit of output falls, and operating leverage does the rest.
That is bullish corporate profits if capital captures the surplus. It is less obviously bullish labor.
In the clean bull case, AI lowers the labor input required for a given unit of output, and the surplus has to go somewhere. If competition is fierce, consumers capture much of it through lower prices. If labor bargaining power is strong, workers capture it through higher real wages. If market power is high and bargaining power is weak, capital captures it as higher margins and higher ROIC. And if the political system notices, the state will try to capture a share through taxation.
The backdrop makes this question unusually live. The BLS puts the labor share of nonfarm business income at 53.7% in Q1 2026 — the lowest value in a series that begins in 1947.2 That is not AI’s doing; the compression predates the token era. But AI arrives into an economy where the labor share is already historically compressed, which means any further capital-biased surplus lands on a political fault line that is already loaded. The plausible responses write themselves: windfall or digital-services taxation, payroll-tax reform, robot-tax proposals, limits on accelerated depreciation, new rules on data and model ownership.
A productivity boom that raises profits while suppressing labor income can deliver strong equity earnings and weak household income growth at the same time — disinflationary in the goods data, inflammatory in the politics. So the final ledger is not just GDP. It is the allocation of the AI surplus between consumers, labor, capital, and the state.
That is the chain in its rosy form: tokens to margins, margins to productivity, productivity to the macro ledger. Before pricing it, the two loudest audits of the chain deserve their hearing — because each is really an argument about which rung fails first.
Burry’s strongest point is not “NVIDIA is a fraud.” It is an accounting point: useful life, depreciation, residual value, and circular financing determine whether reported AI profits reflect true economic returns. He has argued that major AI buyers may be understating depreciation by assigning long accounting lives to hardware that depreciates economically much faster — roughly $176bn across 2026–2028, by his estimate — and that give-and-take deals and vendor financing can obscure true end demand.3
These are legitimate audit items. If GPUs are depreciated over five or six years while their economic life is closer to two or three, cloud earnings are overstated; if customers are funded by their vendors, revenue quality is lower than headline growth suggests.
Notice what all of those are: token-ledger audit items. Burry is auditing layer two. The critique is strongest when applied to hyperscaler and neocloud ROIC, not mechanically to NVIDIA revenue.
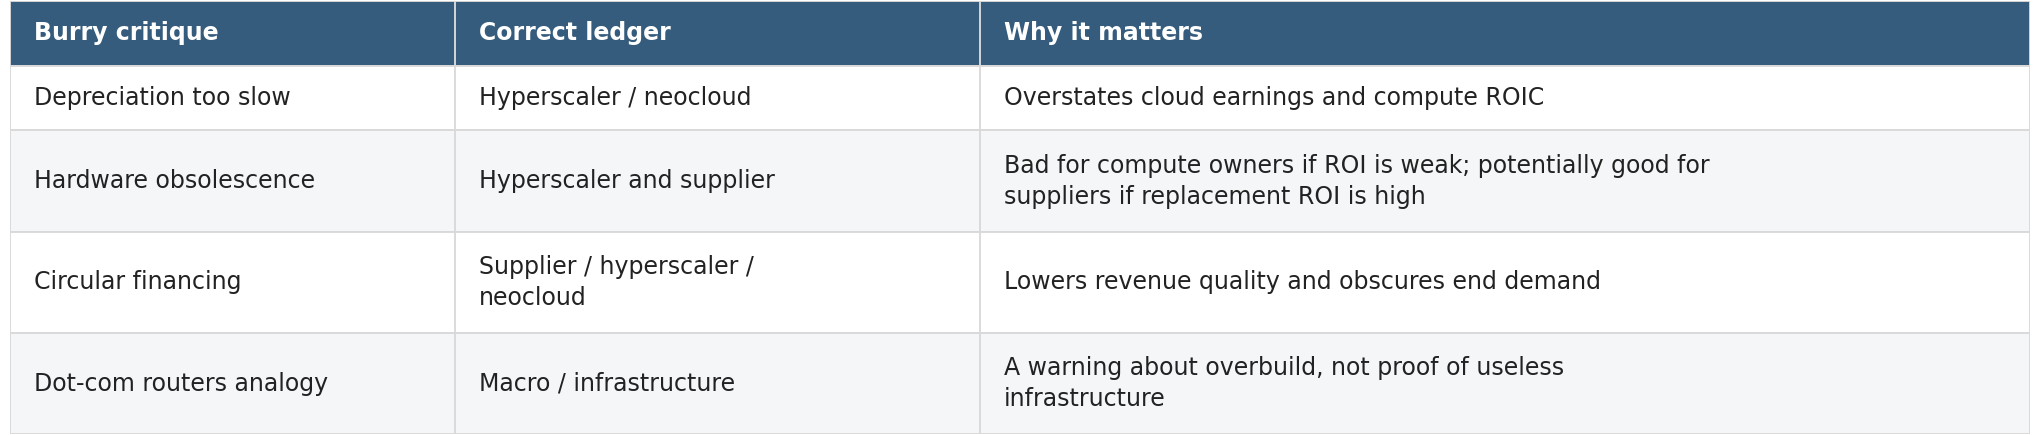
Where the argument thins is the jump from “hardware ages fast” to “the cycle dies.” Faster obsolescence might kill the economics — or do the opposite for suppliers: shorter replacement cycles sustain capex longer, provided each generation creates enough incremental value to justify replacement. A two-year GPU life with strong token economics is a supplier annuity. A six-year GPU life with weak token economics is a write-down on a delay timer. And the token ledger’s Jevons point cuts against him too: collapsing inference costs can grow total gross profit even as unit prices fall.
Stated cleanly: Burry is short the quality and durability of AI returns. The bulls are long the proposition that utilization, falling cost curves, and adoption will outrun depreciation and obsolescence. That is a real, decidable debate about rungs two and three of the ladder.
The bulls are right that this is not dot-com in the simplest sense. The leaders are profitable, the capex is funded largely from operating cash flow, and the infrastructure has actual users.
They are also right that early infrastructure cycles often look overbuilt before demand catches up — railroads, telegraphy, telecom fiber, broadband, cloud. Worth remembering, though, who that history consoles: the economy got the railroads; the railway shareholders got the lesson.
Where the bulls skip a step is the jump from “usage is growing” to “the capital cycle is justified,” which skips the gross-profit ledger. Usage is not validation; neither is rapid revenue growth if depreciation, power, and financing consume the economics underneath it. The related error is treating consumer engagement as enterprise ROI: a billion people asking AI to draft their emails does not create a trillion-dollar profit pool. Value created and value captured are different line items, and the capex is validated only by the captured kind, at a price someone willingly keeps paying.
The cleanest evidence that this debate is about ledgers is the equity market itself: it has already started keeping separate books.
Investors rarely describe it this way, but the tape has priced AI as a sequence of ledgers, not one trade.
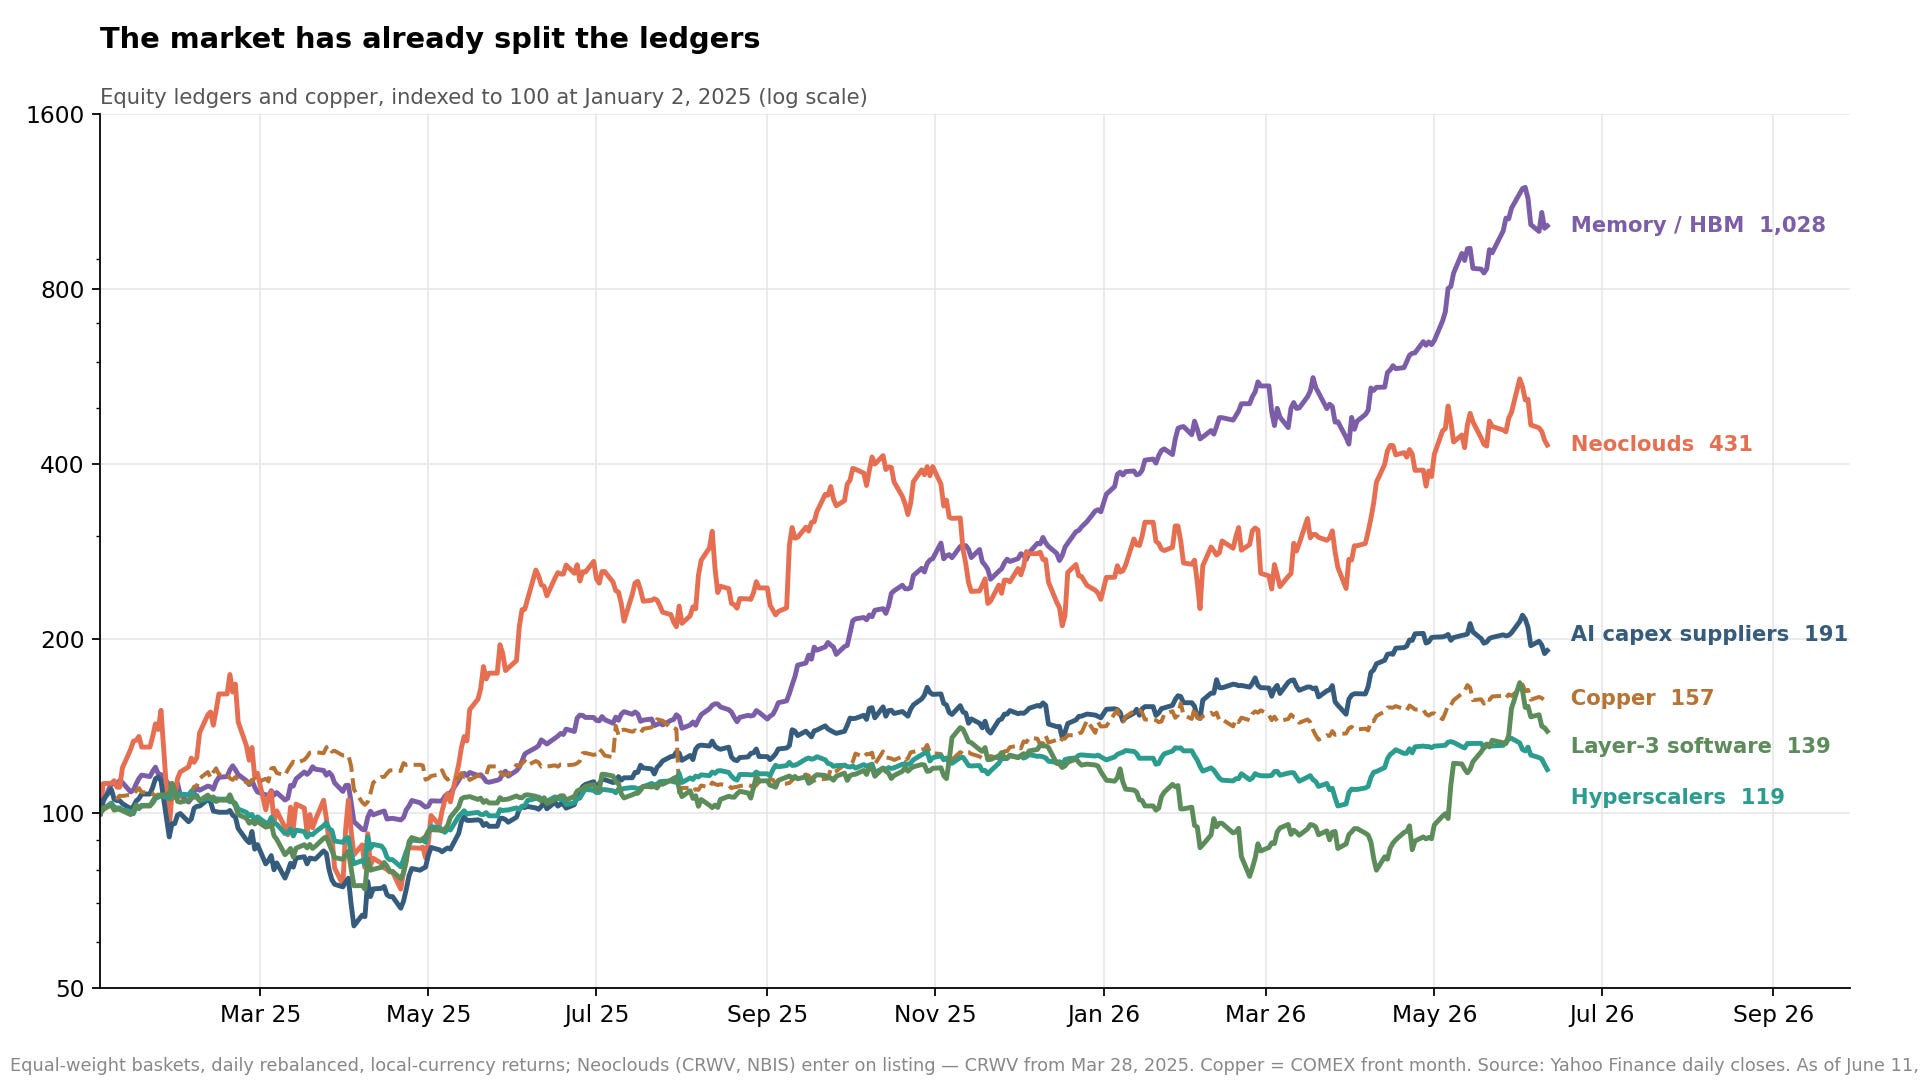
The first ledger is the capex ledger: GPUs, HBM, memory, foundry, advanced packaging, networking, power, and cooling. This was the simplest phase. Hyperscalers announced the capex. Suppliers showed the orders. Margins followed. The market learned, with only moderate delay, that “AI capex” was not a metaphor.
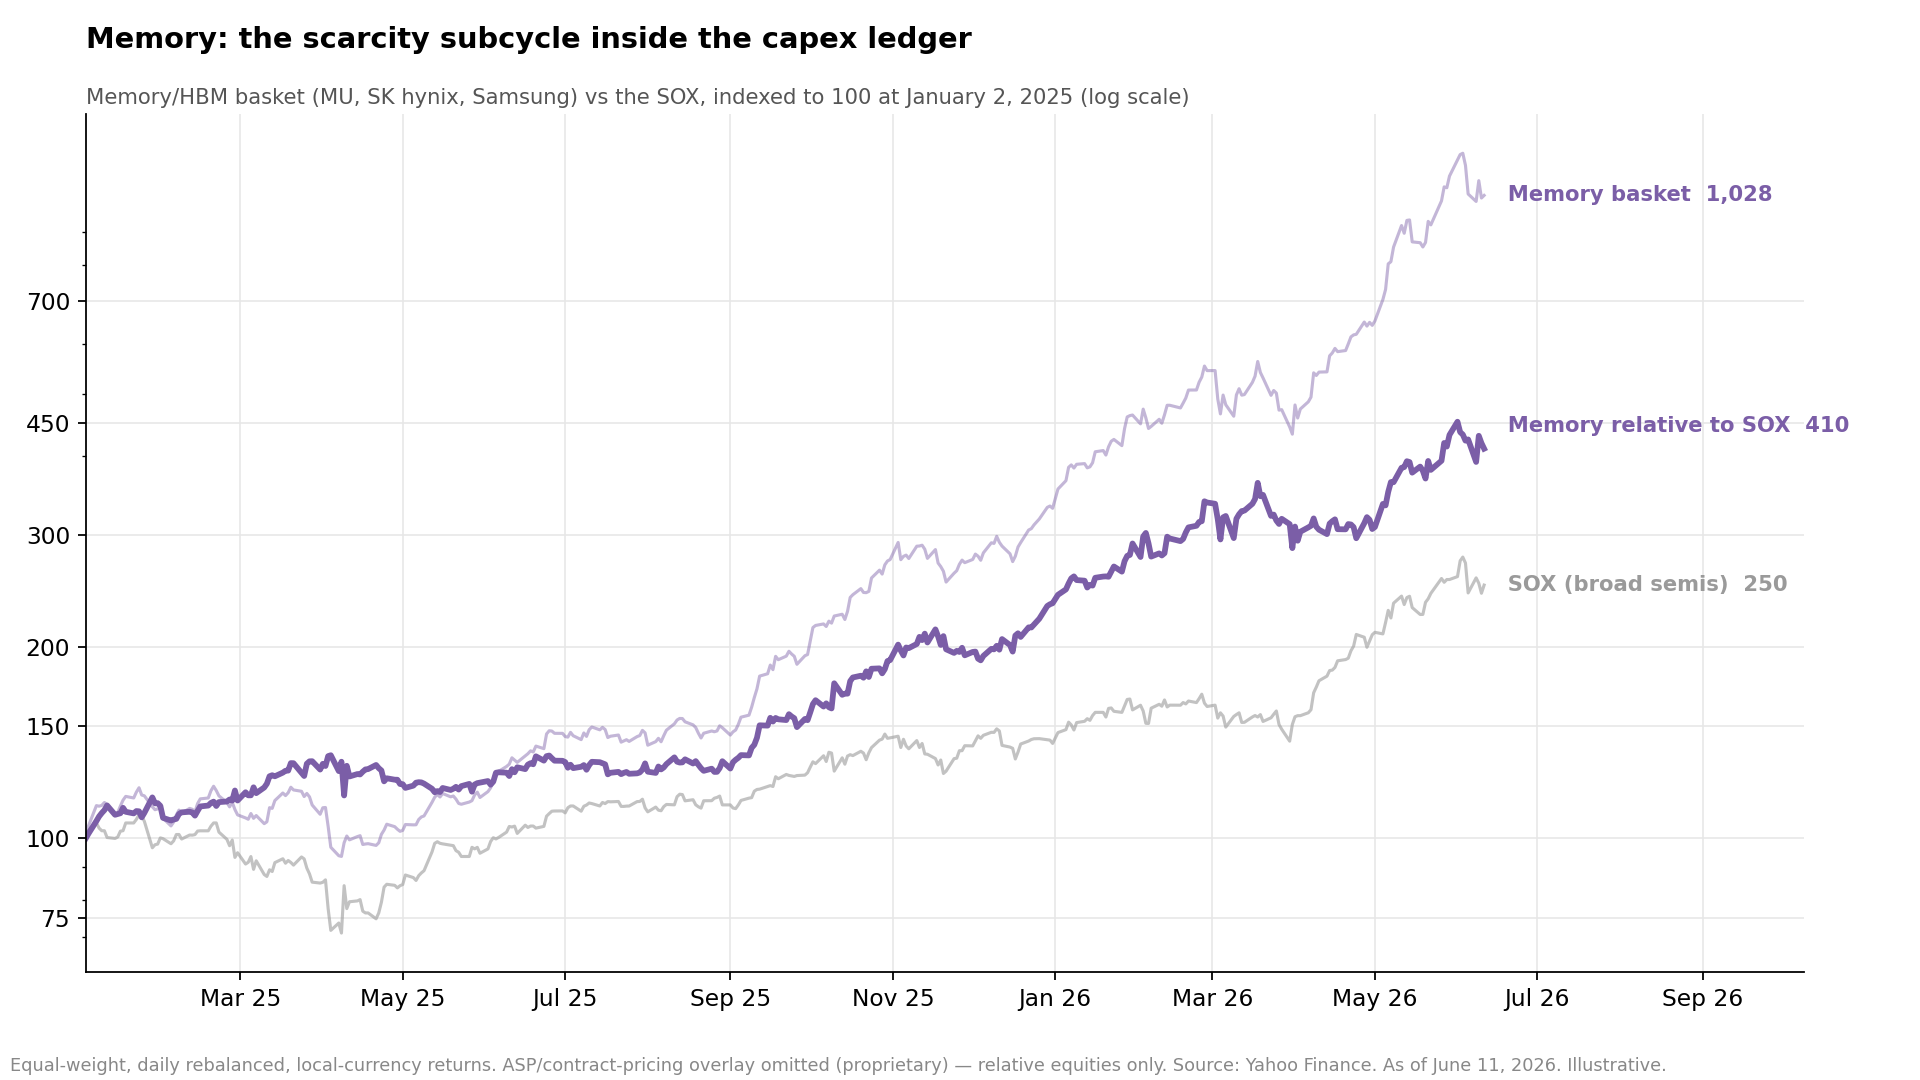
Memory deserves its own sub-ledger. It sits inside the capex complex but behaves differently, because memory is the most commodity-like part of the trade. GPU platforms are product cycles; memory is capacity, qualification, yield, pricing, and discipline. That makes the group especially powerful in the early scarcity phase and especially dangerous once the market starts extrapolating peak pricing.
The sequence was visible in early 2025: once hyperscalers had publicly ramped their capex plans, the implication for HBM and high-end memory was direct — the bottleneck had moved from theoretical demand to physical supply. That was the obvious part. The harder question is how long memory remains a bottleneck before capacity and substitution start to normalize returns. The bull case is that inference broadens memory demand beyond narrow HBM into server DRAM, LPDDR, high-bandwidth packaging, and storage-adjacent constraints. The bear case is old-fashioned: capacity arrives, pricing rolls, inventory builds, and investors discover that “structural” sometimes means “cyclical with a better slide deck.”
The failure test is precise: the memory ledger starts to break when contract pricing rolls before inventories normalize, or when capacity additions arrive while hyperscaler capex revisions stop rising. That combination means the market has shifted from scarcity to cycle. Memory is therefore the cleanest test of whether the bottleneck has moved from GPUs to the wider physical stack.
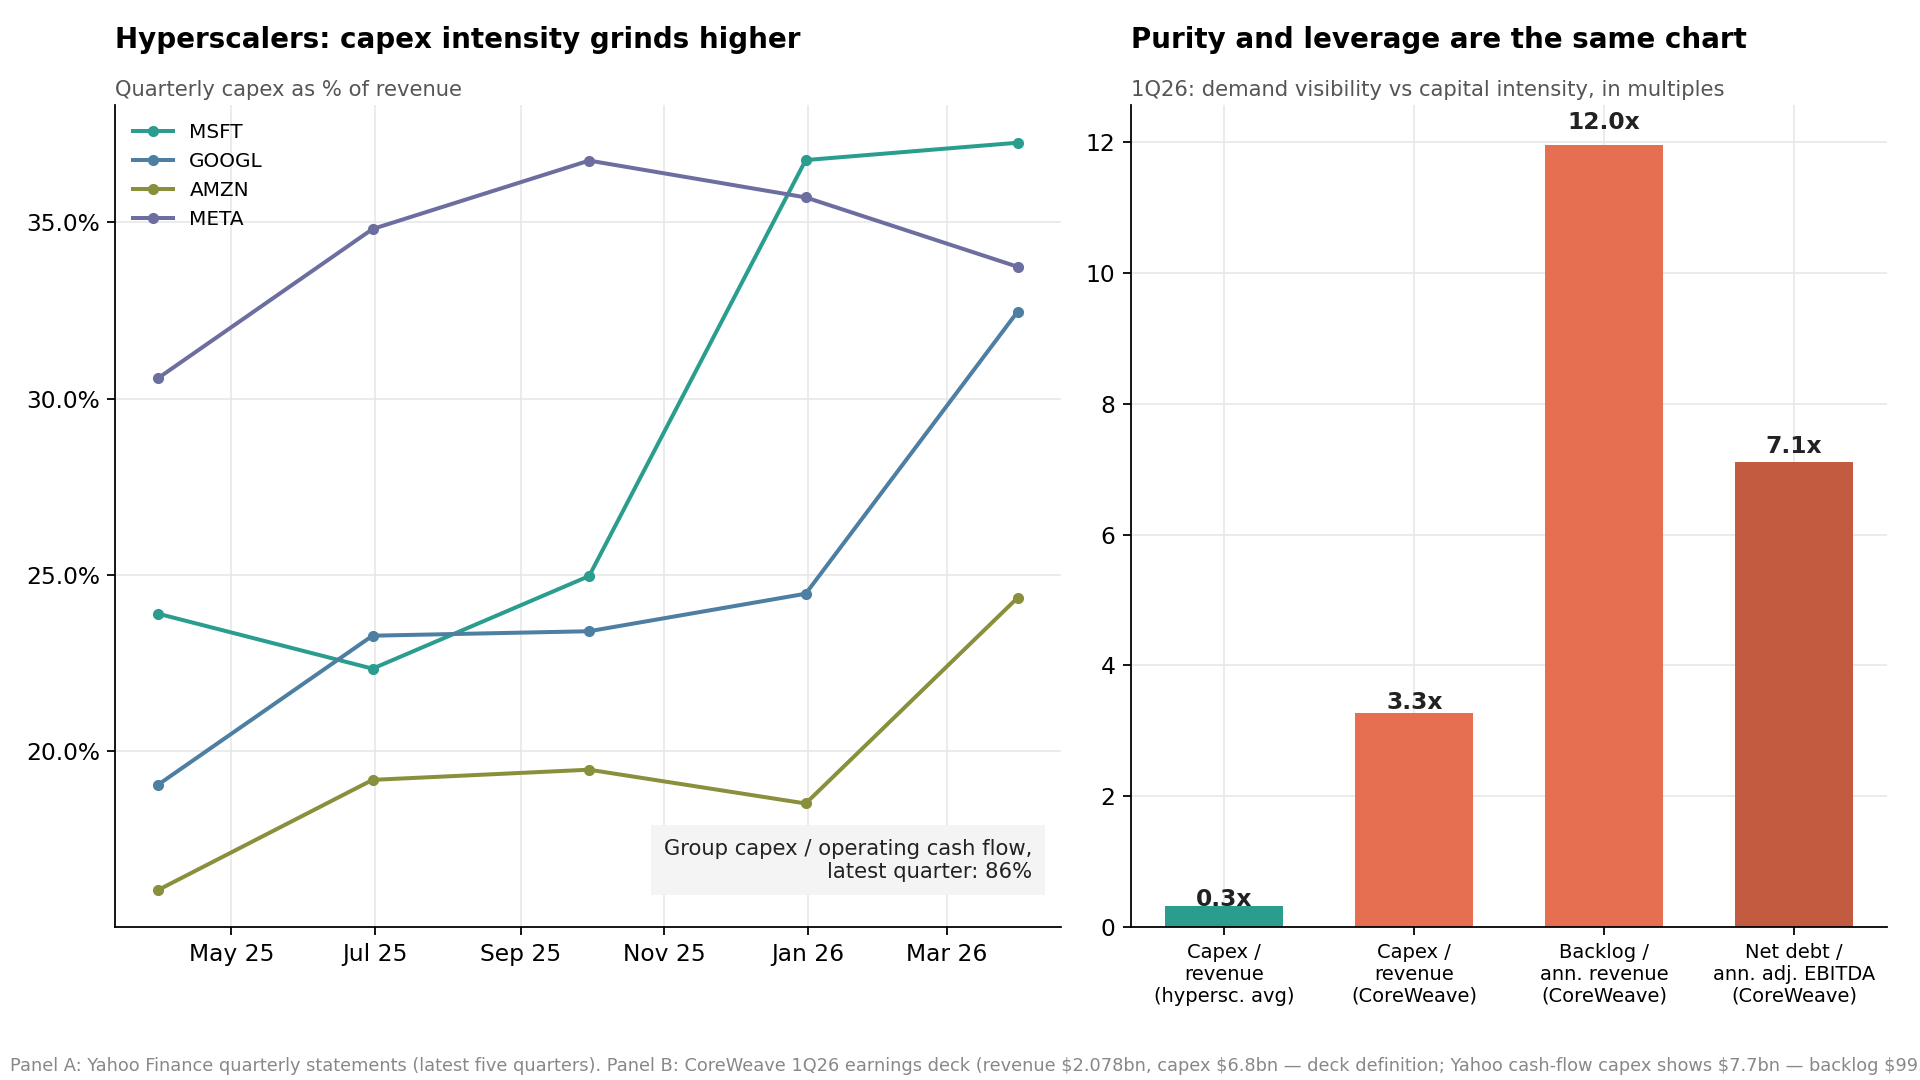
The second ledger is where the market stops being consistent. Hyperscalers are marked down for capex intensity, free-cash-flow pressure, depreciation uncertainty, and ROI skepticism. Neoclouds are frequently rewarded as purer, more levered AI infrastructure exposure. That dichotomy is not obviously rational. Hyperscalers are being asked to prove that AI capex will not destroy free cash flow — a reasonable demand. But some neoclouds are being priced as if the same capex, financed with more leverage and less diversification, is cleaner rather than riskier.
There is a rational version of the neocloud premium: purer exposure, faster growth, backlog visibility, and scarce energized capacity. But purity is not the same as quality. If the asset base is more leveraged, customer concentration is higher, and depreciation risk is less diversified, the same AI demand signal should carry a higher required return — and the less charitable read of the current pricing is that the market has rediscovered financial leverage and decided to call it infrastructure alpha.
The ledger framework handles the split cleanly. Hyperscalers and neoclouds are both layer-two compute owners, and they should be judged by the same tests: utilization, gross profit after power and depreciation, financing cost, customer concentration, residual value, and whether backlog converts into cash returns rather than accounting revenue.
CoreWeave is the starkest public example of why those tests matter. Its first-quarter 2026 results showed a revenue backlog of $99.4bn against quarterly revenue of $2.1bn, quarterly capex of $6.8bn, and a GAAP operating loss of $144mn.4 That is the whole neocloud debate in one accounting snapshot: enormous demand visibility, enormous capital intensity, and still-unsettled economics. Backlog validates demand. It does not validate return — not until the same layer-two tests, contract durability included, are visible in the numbers.
The third ledger is the corporate-user ledger, and no single stock captures it. That is the point: AI productivity will appear not as one ticker but as a pattern across companies that own workflows, telemetry, security, software supply chains, and business-process orchestration. ServiceNow is a proxy for workflow automation and enterprise process orchestration. Datadog is a proxy for observability and AI-infrastructure operations. JFrog is a proxy for software supply-chain governance as AI agents start writing, moving, and deploying code. None of these is “the AI productivity trade” by itself. Together they point at the right evidence: sticky revenue, platform consolidation, usage expansion, and margin durability — the places where token spend either becomes operating leverage or dies in pilot purgatory.
These are not recommendations. They are measurement points. The question is not whether these stocks should go up; it is whether workflow, observability, and software-supply-chain platforms are where enterprise token spend becomes durable operating expenditure.
The early prints lean toward stickiness. ServiceNow’s first quarter of 2026 showed subscription revenue up 22% year over year, remaining performance obligations up 25%, and customers spending more than $1mn on its AI assistant growing over 130%.5 Datadog grew revenue 32% while shipping GPU-monitoring and AI-operations products.6 JFrog grew cloud revenue 50% with net dollar retention of 120% as it launched registry products for AI agents.7 The scoreboard for this layer is not GPU shipments; it is contract durability:
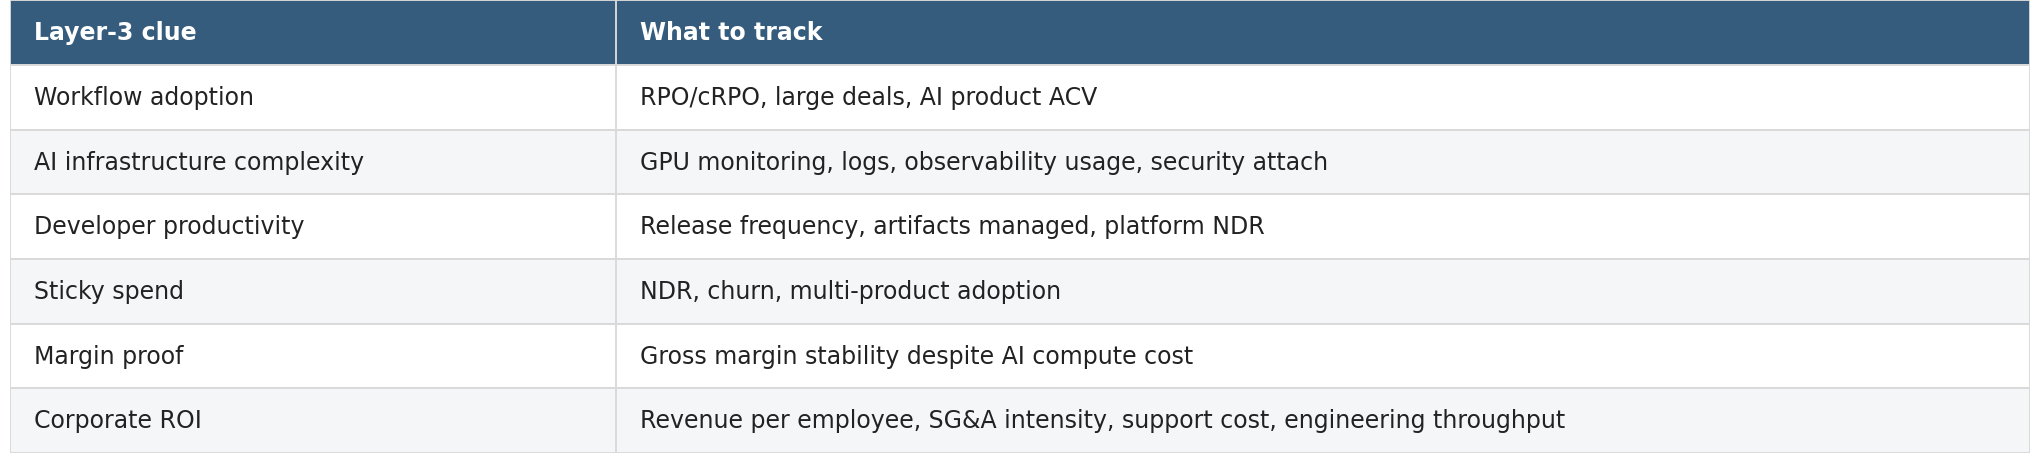
If AI is working at layer three, the evidence should look boring before it looks revolutionary: higher revenue per employee, lower SG&A intensity, faster release cycles, higher retention, more durable consumption revenue. The market will probably notice late, because it prefers clean labels, and “enterprise operating leverage from workflow redesign” is not exactly a meme.
Step back and the equity tape tells one story: The stock market has priced AI as a bottom-up capex cycle. The bond and commodity markets have to decide whether it is also a macro investment cycle. Which brings the argument to the market that has said the least and has the most at stake.
Suppose the chain holds. Every ledger clears its hurdle. What happens to bonds?
The easy answer — the one embedded in most AI-macro commentary — is that productivity rises, unit labor costs fall, inflation eases, and the Fed gains room to cut. That is the Warsh argument, and it is not wrong. It is incomplete, in two ways: the productivity is not yet observable, and even when it arrives it moves more than one variable.
Take observability first. Unit labor costs are hourly compensation divided by productivity, and the revised first-quarter 2026 data showed productivity up only 0.3% annualized with unit labor costs up 1.8% annualized.8 One quarter is noisy evidence, but the direction is the point: whatever AI is doing inside individual workflows, it has not yet bent the aggregate series. That is the standard pattern for general-purpose technologies — gains arrive with a lag, unevenly, and partly unmeasured — but “not yet visible” is a fact worth stating plainly while everyone trades the anticipation.
And the size of the eventual gain is a distribution, not a forecast. At the optimistic end, Goldman Sachs has argued that generative AI could raise global GDP by about 7% and lift annual productivity growth by roughly 1.5 percentage points over a decade.9 At the conservative end, task-based approaches such as Acemoglu’s imply much smaller gains — closer to a sub-1% total-factor-productivity increase over ten years.10 Penn Wharton sits in the cautious middle: a 1.5% productivity and GDP level gain by 2035, with the annual growth contribution peaking around 0.2 percentage points in 2032 and fading thereafter.11 That spread is the point. The macro question is not whether AI can improve productivity in a lab, a call center, or a coding workflow. It is whether enough tasks, firms, and sectors adopt it fast enough for the aggregate series to move before the capex, power, and financing costs arrive.
Now the second incompleteness — the missing variable. R-star is not the current policy rate. It is the real short-term interest rate expected to prevail when the economy is at full strength and inflation is stable; in plain English, the rate at which desired saving and desired investment clear when the economy is operating at potential.12
Productivity moves the investment side of that market directly. If AI raises trend productivity growth, firms should expect higher returns on capital. Higher expected returns increase investment demand. Stronger investment demand raises the real rate needed to balance saving and investment. That is why, in standard theory — and in Fed researchers’ own framing of the question — stronger trend productivity growth pushes r-star higher.13 If the economy can earn more on new capital, it should be willing to pay more for capital.
The nominal version needs one careful sentence. A useful long-run shorthand is that neutral nominal short rates should move with nominal growth, though not mechanically one-for-one. Nominal growth is real trend growth plus inflation; the neutral nominal policy rate is roughly r-star plus expected inflation. So if AI raises sustainable real growth and r-star rises with it, the nominal policy anchor should move higher even if inflation falls somewhat. That is the part of the productivity-disinflation argument that gets lost: lower inflation does not automatically mean lower nominal rates if the real neutral rate rises by more.
Which produces the sentence this piece exists to deliver:
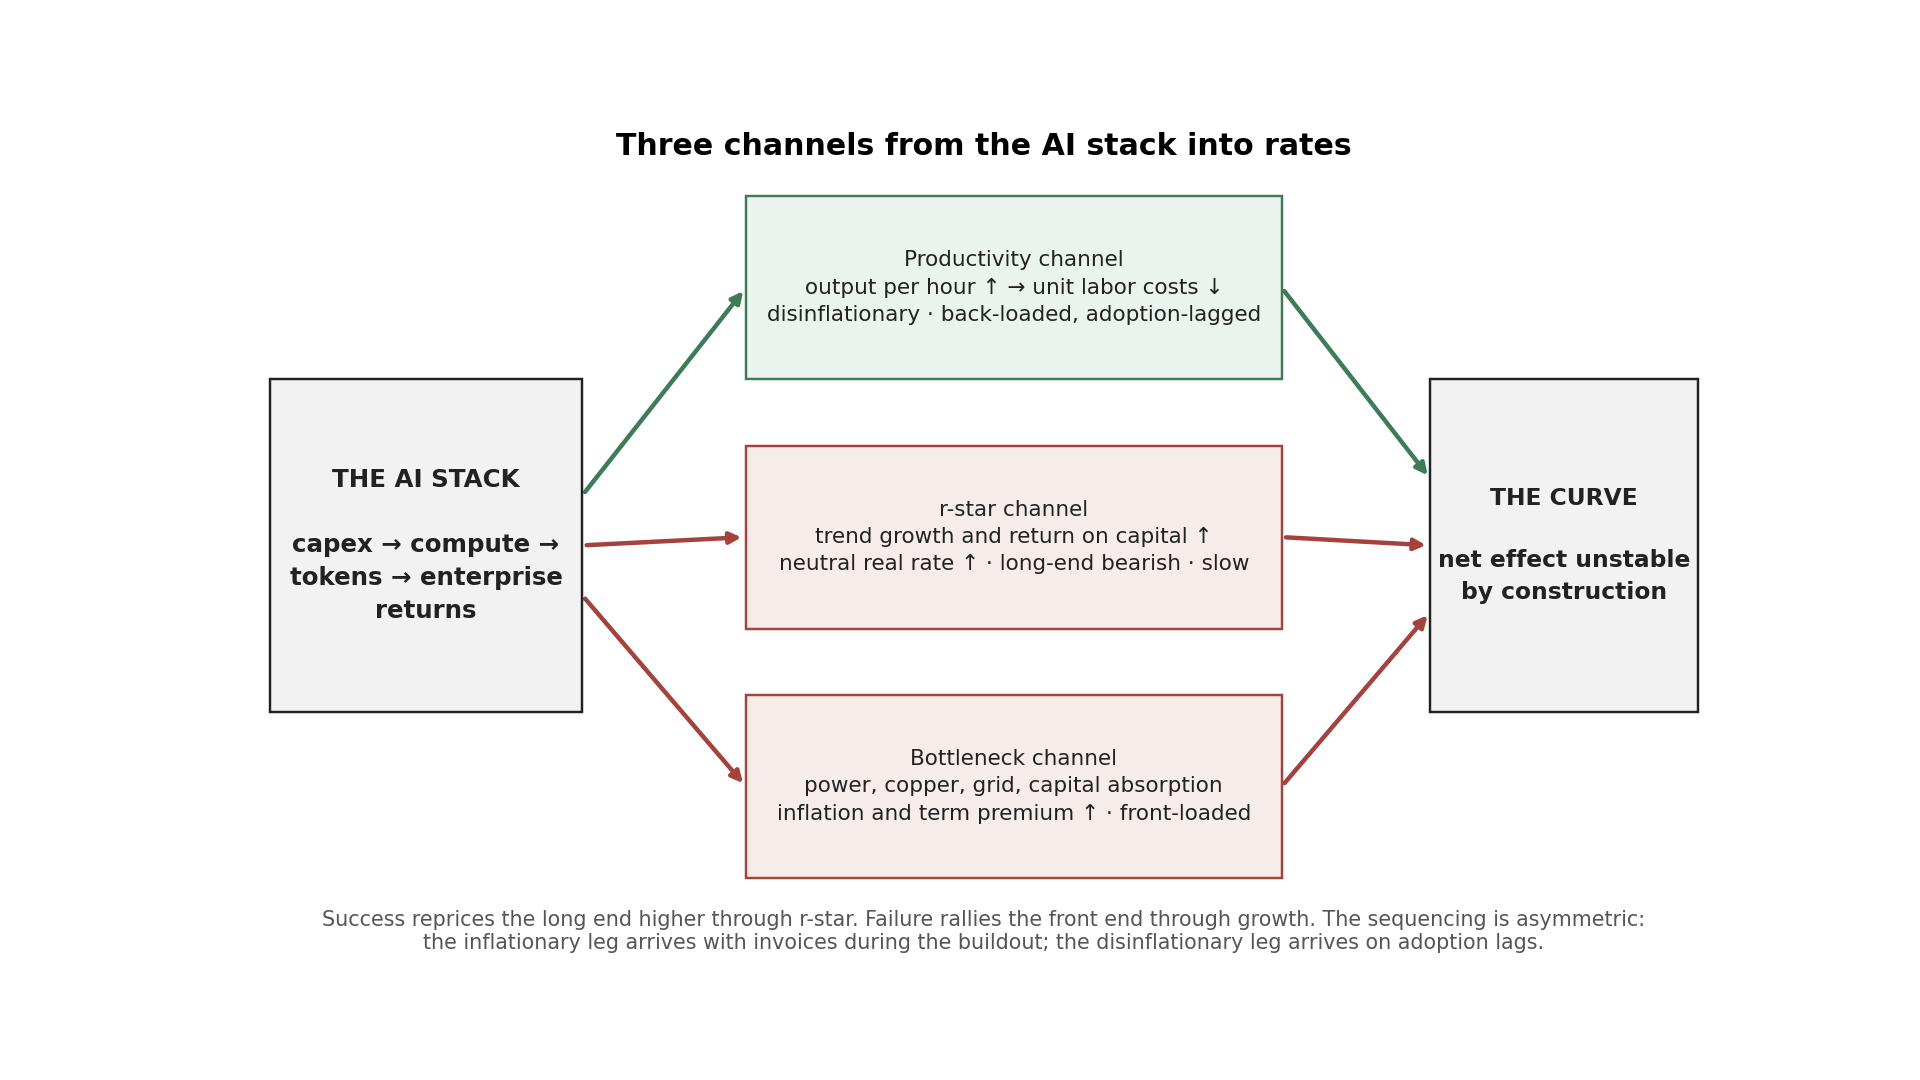
AI can lower inflation through labor productivity and raise rates through r-star at the same time.
Micro-disinflationary and macro rates-bearish are not contradictory claims. They are the same phenomenon read at different levels of aggregation — exactly what you would expect from a chain of returns rather than a single trade.
And if the chain breaks instead? Then the sequence runs in reverse: capex slows, supplier earnings fall, cloud margins compress, neocloud financing tightens, equity risk reprices, growth expectations fall, the front end rallies, and bond volatility rises.
So the honest bond conclusion is not “AI means yields up” or “AI means yields down.” It is that AI makes the curve and the term premium structurally less stable. Success reprices the long end higher through r-star. Failure reprices the front end lower through growth. The one configuration the bond market should not be carrying is the current one: treating AI as somebody else’s asset class.
Kevin Warsh’s AI argument is not stupid. That is what makes it dangerous.
Warsh — sworn in as Fed Chair in May 202614 — has called AI “the most productivity enhancing wave of our lifetimes” and argued that it will be a significant disinflationary force, giving the Fed room to cut.15 The White House has made the same case in its own voice: Kevin Hassett has described AI capital spending and productivity as a supply shock that puts downward pressure on inflation and should allow lower rates.16 At its strongest this is standard supply-side economics: if the economy can produce more output per hour, wage growth is less inflationary, margins can expand, and policy has more room to tolerate growth.
The problem is not the sign of the productivity channel. The problem is the timing.
AI productivity gains, if they come, arrive through diffusion: process redesign, data integration, workflow change, software adoption, labor substitution, and eventually new business models. The costs arrive first. The GPU is purchased before the workflow is redesigned. The data-center power bill is real before the back-office headcount saving is measured. A New York Fed researcher has made the same point in general form: the inflation question is not simply whether AI raises productivity, but whether productivity rises faster than the costs of adoption — reorganization, data infrastructure, integration — which can raise costs even as the frontier expands.17
That means a central bank can face the inflationary part of AI before it sees the disinflationary part. If the Fed cuts because productivity is expected rather than observed, it risks anchoring the short end below the economy’s true neutral rate. Markets may initially like that: lower discount rates, easier financial conditions, stronger equities. But the long end can read the same policy as a credibility problem. If power, copper, tariffs, wages, or fiscal deficits keep inflation sticky while r-star is rising, the curve steepens and term premium rises — the long end becomes the disciplinary mechanism.
The political overlay matters because it changes the reaction function, not because pressure is novel. If the administration wants lower rates and the Fed Chair believes AI is structurally disinflationary, the risk is not crude interference. It is an internally coherent policy mistake: the Fed can convince itself that easing is justified by future productivity before future productivity is visible. None of this requires speculation about motives; the public record is enough. Ahead of Warsh’s first FOMC meeting on June 16–17, 2026, the White House has publicly pressed for lower rates — Trump said the Fed “should actually lower interest rates” — while the IMF urges caution because inflation risks remain elevated.1819
That is the policy-error risk. Not that AI productivity is fake. That the Fed prices it too early.
Fairness requires stating what would settle this, in both directions.
Warsh is right if three things happen together:
Productivity accelerates in the aggregate data, not just in case studies.
Unit labor costs decelerate without a recession.
Bottleneck inflation from power, commodities, construction, and financing fades before it contaminates inflation expectations.
That is the clean productivity-disinflation scenario. It is possible. It is just not yet visible enough to justify treating it as the policy baseline.
The r-star view is right if:
Real productivity growth accelerates.
Business fixed investment stays elevated.
Real yields rise, especially at the long end.
The curve steepens because the long end sells off more than the front end.
Corporate margins improve outside the AI supplier base.
Power and grid bottlenecks keep relative-price pressure high.
In that world, AI is not just disinflationary software. It is a higher-growth, higher-investment, higher-neutral-rate regime.
AI is sold as software. Its macro footprint is increasingly physical: power, land, copper, transformers, cooling water, gas turbines, grid interconnection queues, and the capital markets that finance all of the above.
The IEA’s base case projects that global data-centre electricity consumption will more than double to about 945 TWh by 2030 — just under 3% of global electricity use — with demand growing around 15% per year from 2024 to 2030, more than four times the growth rate of electricity consumption from all other sectors.20 That number is the bridge between the two halves of this piece: it is where “AI as software” becomes “AI as infrastructure.”
A chatbot asking someone to summarize a meeting is cute. A continent rewiring its power grid for inference is macro.
The honest framing is not that AI is inflationary. It is that AI’s channels have opposite signs:
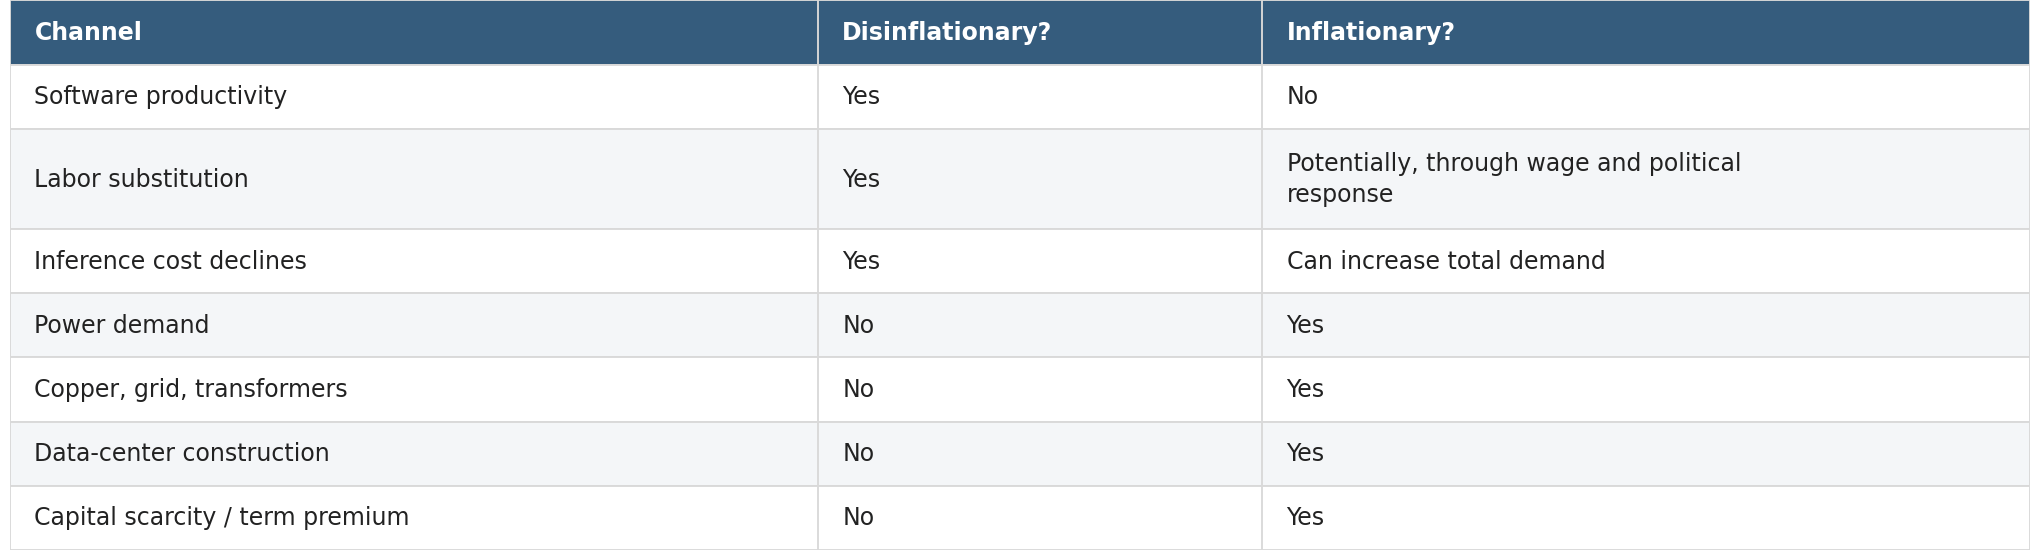
Read down the columns and a pattern emerges: the disinflationary channels operate through labor, and the inflationary channels operate through physical capital and the absorption of savings.
And the bottleneck problem is a clock problem. The IEA notes that the energy system moves on longer lead times than the data centers it must feed — a data center can be operational in two to three years; grid upgrades, transformers, and generation take longer.21 The model can improve faster than the transformer can be delivered. Inference costs can fall faster than power capacity can be added. That timing mismatch is exactly where relative-price inflation lives: the inflationary leg of AI is front-loaded and arrives with invoices attached, while the disinflationary leg is back-loaded and arrives through adoption lags. An economy can experience the inflation of building AI before it experiences the disinflation of using it.
The commodity market is the physical audit of the AI story.
If AI remains a software story, commodities should not care much. If AI becomes a durable capital cycle, commodities have to price the conversion of tokens into electricity, copper, transformers, gas turbines, grid upgrades, water, land, and cooling. This is where “AI is software” stops being a useful sentence. Software does not require a substation. Inference does.
Copper is the cleanest focal point. It is used directly in data centers and indirectly in the grid that supplies them. The AI demand story is not just copper in servers; it is copper in power distribution, cooling systems, substations, transmission, and redundancy. If data centers rise materially as a share of electricity demand, copper becomes one of the physical ledgers beneath the token ledger — and the commodity most exposed to the front-loaded, invoice-bearing leg of the cycle.
Natural gas is more ambiguous, and more interesting for it. Gas is a plausible near-term reliability fuel for AI power demand, especially where grids are constrained and 24/7 loads need firm supply. But the gas curve is not yet pricing a dramatic scarcity regime. The EIA’s June 2026 outlook has Henry Hub averaging roughly $3.34/MMBtu in the second half of 2026, $3.46 for full-year 2027, and $3.55 in the second half of 2027, with rising demand met by higher production and storage;22 the forward strip sits near $3.50 for calendar 2027, with the winter 2027–28 months between roughly $4.25 and $4.75, as of June 11, 2026.23 That is not a curve screaming “AI power crisis.”
The Iran war and Hormuz disruption complicate this further. At first glance, a Middle East supply shock looks bullish for all energy. In LNG-linked markets, it can be: Hormuz raises shipping, LNG, and risk-premium questions, especially given Qatari and Gulf export exposure. The shipping evidence shows how binding the disruption already is — only a trickle of tankers slips through with transponders off, about a dozen LNG cargoes in the three and a half months since the war began in late February.24 That is exactly the messy evidence that separates risk premium from realized scarcity, and a dozen cargoes a quarter sits near the scarcity end. But for US Henry Hub, the channel can cut the other way. Higher oil prices incentivize more oil-directed drilling, and in basins such as the Permian, incremental oil production brings associated gas with it. In those cases gas is partly a byproduct of the oil decision: not literally free, but a low-marginal-cost stream whose supply behaves as if it is priced off the oil well, not the gas curve. The EIA’s own outlook makes the mechanism explicit — higher first-half 2026 crude prices should encourage additional oil production and, with it, more associated gas, one reason it lowered its 2027 Henry Hub forecast.25
That creates a three-way tug of war. AI data-center load is bullish gas demand. Hormuz and LNG disruption are bullish global gas risk premium. Higher oil-driven drilling is bearish US gas through associated supply. So Henry Hub is not a pure AI-power instrument; it is a clearing price where AI load competes with associated gas, LNG exports, storage, weather, pipeline constraints, and oil geopolitics. Henry Hub and global LNG-linked gas are, for the same reason, not the same signal: Hormuz speaks mostly to the latter, associated gas mostly to the former.
This is why gas is a cleaner test than oil, but still not a pure one. If AI load truly matters at the commodity clearing price, Henry Hub and regional power-linked gas hubs should eventually stop ignoring it. If they do not, either supply is absorbing the shock, or the AI-power thesis is not yet large enough to clear the marginal molecule.
Oil and broad energy equities are noisier still. XLE can work as a broad energy-inflation proxy, but oil is a global transport, geopolitics, OPEC, and refining market before it is an AI market. Useful in an energy-inflation regime; not a data-center instrument.
Uranium is different again: a duration asset. Nuclear is a long-cycle answer to a power problem that is becoming urgent now. The IEA expects renewables and natural gas to carry most of the near-term data-center load, with nuclear playing an increasingly important role toward the end of the decade and beyond.26 Goldman’s nuclear work makes the lead-time point bluntly: even if 85–90GW of new nuclear capacity were needed to meet all data-center power demand growth from 2023 to 2030, well under 10% of it would be available by then.27 Uranium is therefore an expression of AI durability, not of immediate bottleneck inflation. If the cycle and the productivity prove durable, the long-duration power trade gets paid. If the chain breaks in two years, it does not.
The hierarchy, in declining cleanliness:
Copper — the cleanest physical AI bottleneck.
Grid equipment, transformers, power infrastructure — the highest direct bottleneck relevance.
Natural gas — the near-term marginal reliability fuel, but oil-linked associated gas, LNG disruption, storage, and regional basis can overwhelm the AI-demand signal.
Uranium — the long-duration durability expression.
Oil / XLE — a broad energy proxy, useful but noisy.
And because the house style of this piece is that every claim should carry its own falsifier, here is what would prove each leg wrong:
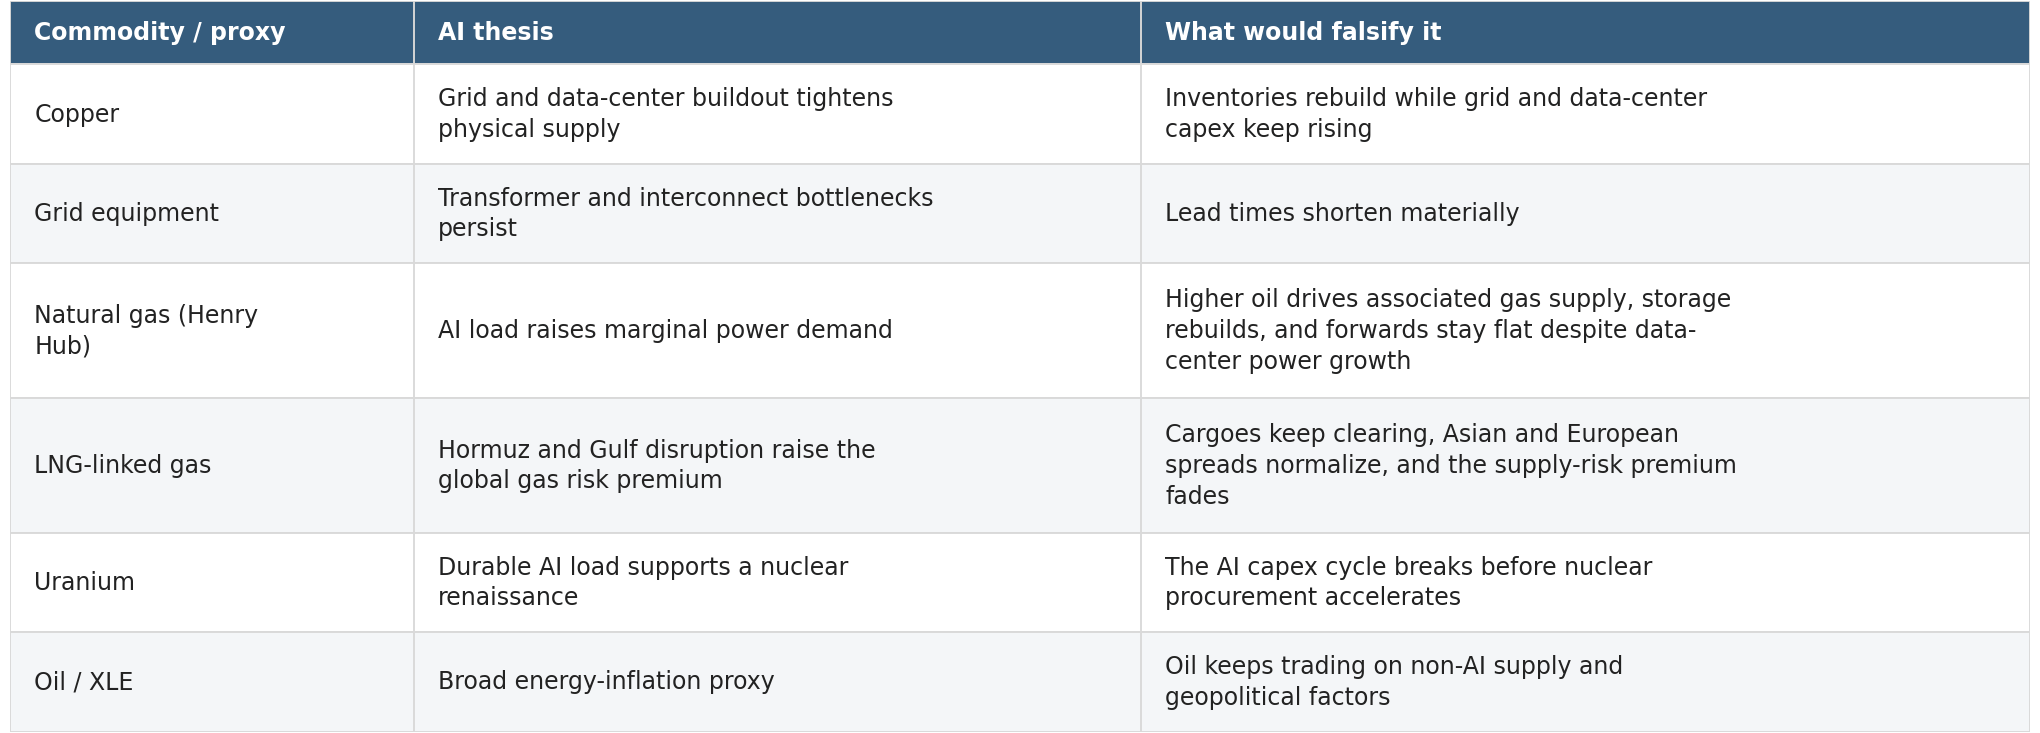
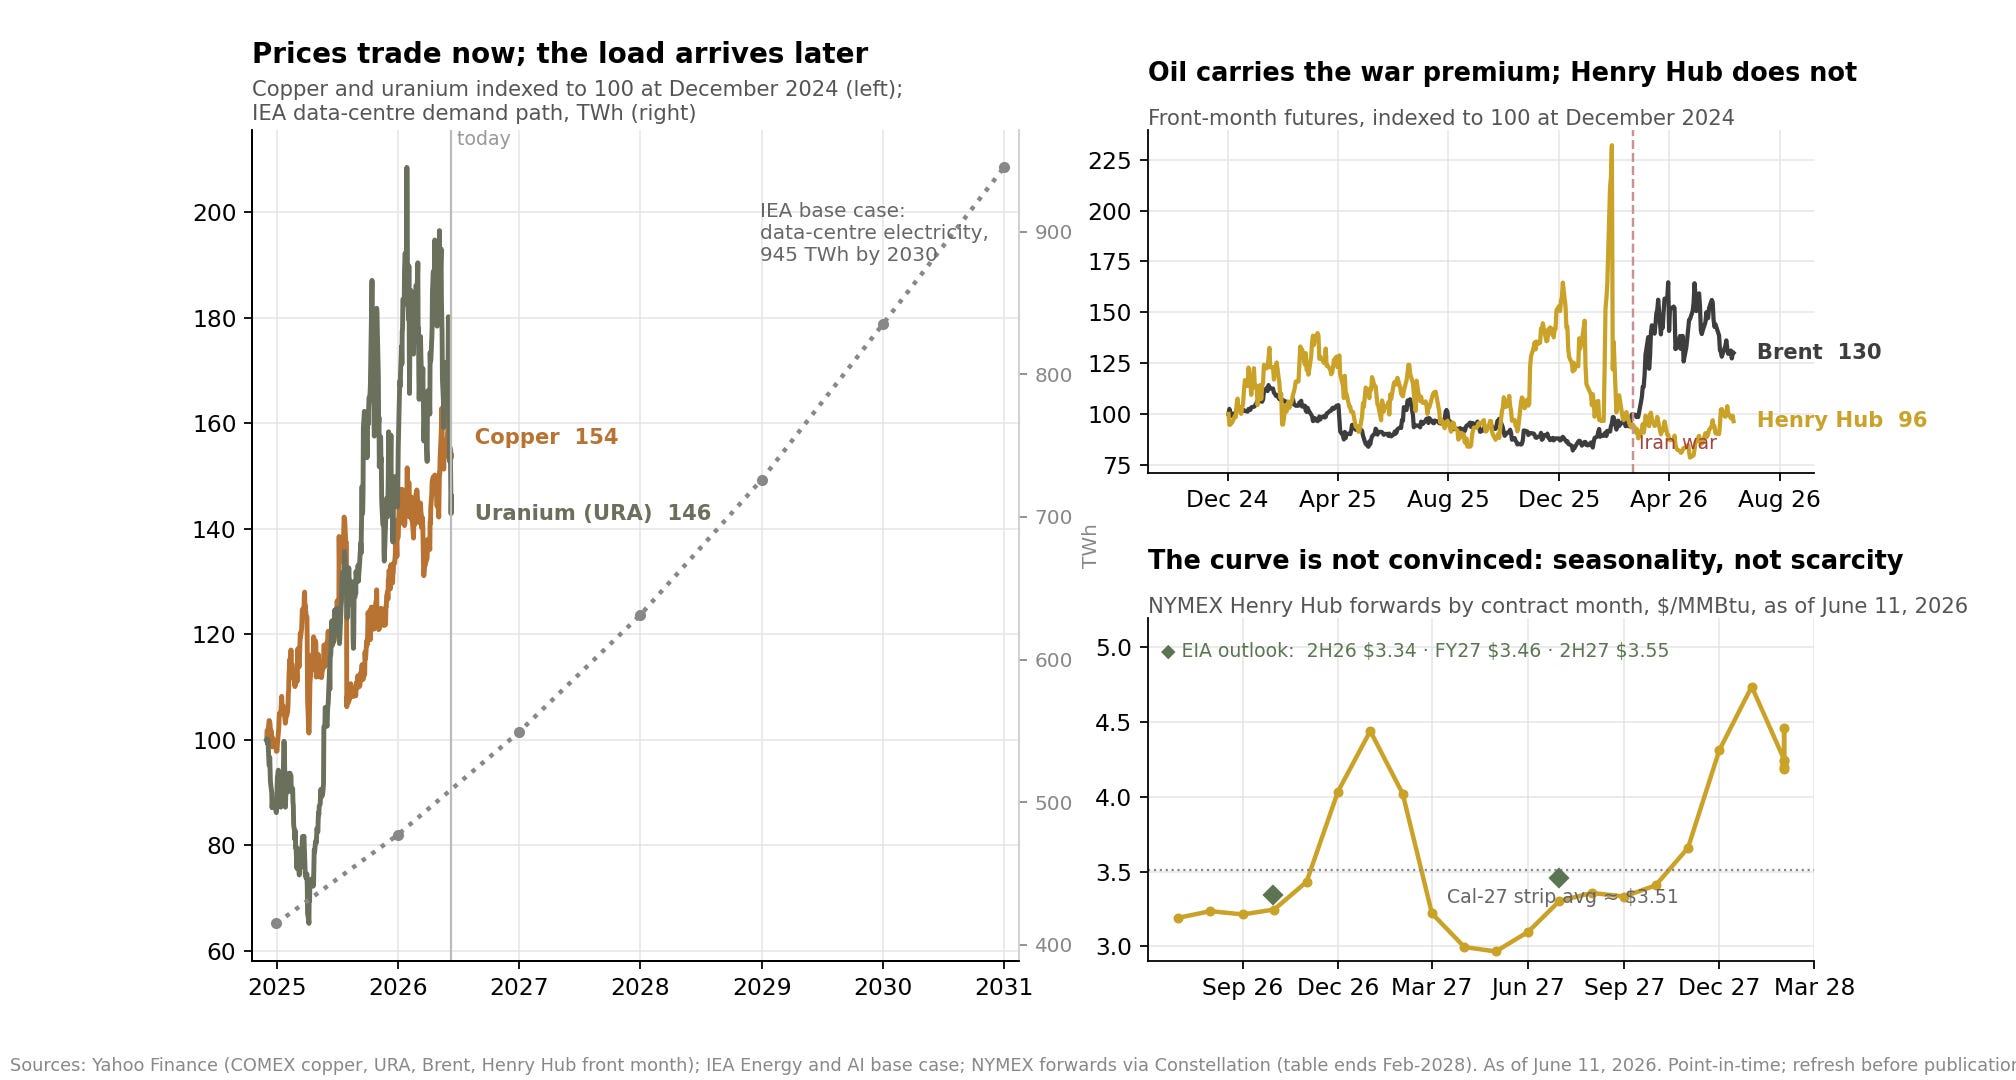
The commodity ledger and the equity ledger are answering different questions on different clocks. Equities are pricing who earns the buildout. Commodities are deciding whether the buildout is real enough, physical enough, and durable enough to reprice the inputs. Which leaves the final bookkeeping question: what has the market already written down?
The market has already made some ledger entries. The honest way to read them is ledger by ledger:
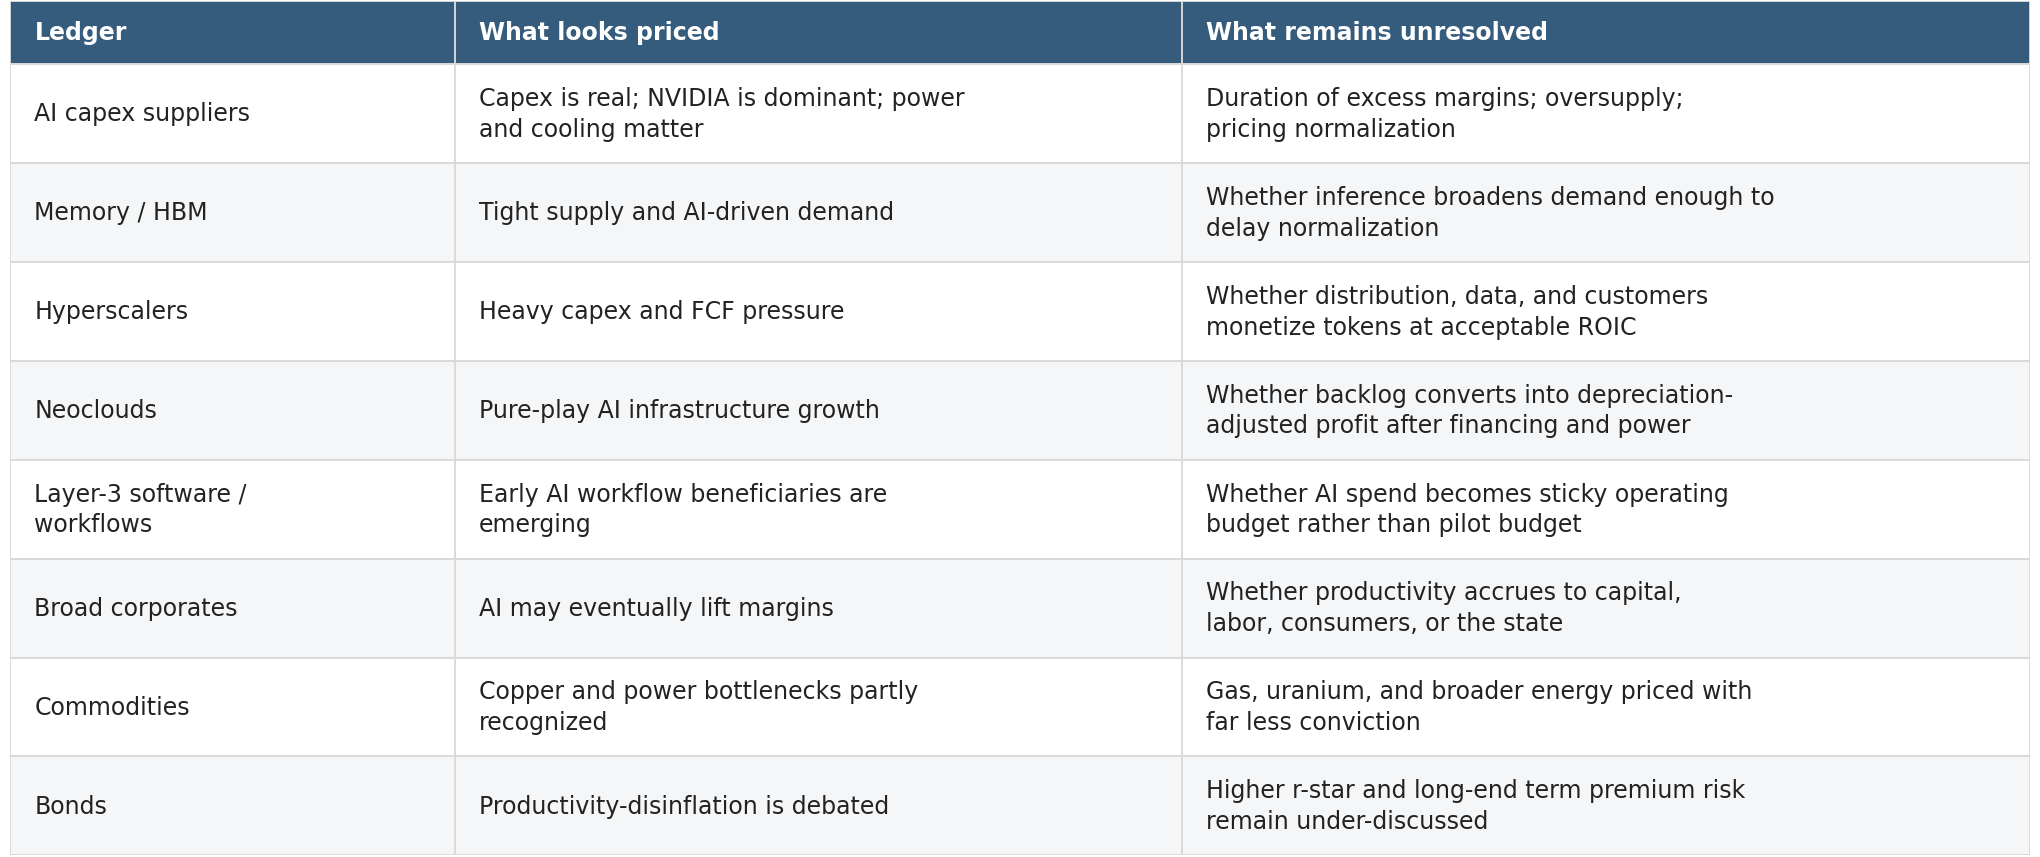
The least-modeled row is the first one. AI succeeding technologically while layer-one returns normalize is the standard end-state of every infrastructure buildout — and the one scenario nobody owning the bottom layer wants to model.
The mispriced risk is still the one-layer story. “Chips go up because capex goes up” works until investors demand evidence that tokens generate enough gross profit to sustain the capex. At that point the stack stops trading as one trade and starts trading as separate ledgers with separate verdicts. The transition between those two pricing regimes — from capex-as-proof to returns-as-proof — is where the volatility lives.
The AI cycle will not be resolved by asking whether GPUs are expensive or whether chatbots are useful. It will be resolved by a chain of returns.
Can infrastructure suppliers earn margins without oversupply?
Can hyperscalers and neoclouds sell enough tokens to cover depreciation, power, financing, and obsolescence?
Can enterprises earn more from those tokens than they spend?
Can the economy convert those firm-level returns into productivity growth?
And if it can — does the bond market understand that higher productivity may mean a higher neutral rate, not just lower inflation?
That is the real AI macro debate. Each layer has a hurdle, and each hurdle has a date with evidence. The next time an AI headline crosses your screen, skip the bubble question and ask the ledger question: which layer is this, and what return does it need?
The framework carries its own falsifier, as it should: monetizable AI revenue clearing the hurdle band for years while aggregate productivity and corporate operating leverage outside the supplier base stay flat. That would mean buyers funding sellers indefinitely without a return — the one thing this piece says cannot last.
The first phase was about capex. The next phase is about returns.