The problems with AI agents and apps often don't show up in normal monitoring tools:
That's because normal monitoring was built for software that does the same thing every time.
This gap is what AI observability fills. This guide walks through what AI observability is, the features and data it's built from, and which tools are worth using depending on your stack and stage.
AI observability (often used interchangeably with LLM observability and LLM analytics) is the practice of monitoring the AI features of your application: prompts, responses, costs, latency, errors, and quality of outputs.
It's a category that barely existed two years ago, because the problems it solves didn't exist either. Traditional APM tools like Datadog and New Relic were built to monitor software that behaves the same way every time.
AI features don't.
The short version:
| Traditional APM watches | AI observability watches |
|---|---|
| Whether API calls succeed | What the model said |
| Response times | Token usage and cost per call |
| Error rates | Quality of outputs (was it a hallucination?) |
| Service-level metrics | Agent-level metrics (which tools were called, in what order) |
| Did the code run? | Did the model give a useful answer? |
The data model is different too. APM is built around requests, services, and traces across your application stack. AI observability is built around generations (individual LLM calls), traces (the chain of generations and tool calls that make up an agent loop), and spans (the steps inside a trace).
AI observability tools also do things APM tools structurally can't, like semantic clustering of model outputs, which groups traces by what the model actually said rather than which endpoint was hit. That's a kind of analysis only possible when your monitoring layer understands the content of the calls, not just their shape.
Anyone shipping AI features to real users. That includes:
If you have at least one LLM call in production, you need at least basic AI observability.
We've written a more practical guide on what to set up on day one if you're at the MVP stage, but the general rule is: tracing, cost tracking, and error capture, before anything else.
AI observability tools all work roughly the same way: they capture the data flowing through your LLM calls, store it in a queryable format, and give you tools to slice it, score it, and act on it.
The differences are in what they capture, how they capture it, and what they let you do with it afterwards.
A good AI observability setup has six layers. Most tools cover the first three out of the box; the rest are either add-ons or features you build over time.
The foundation. Every LLM call (and every step inside an agent loop) gets captured as a trace: inputs, outputs, model, parameters, latency, token counts, tool calls, and any metadata you attach (user ID, feature, session).
For simple apps with one LLM call, a trace is just one entry. For agents with multi-step workflows, a trace can include dozens of sub-spans showing the full chain of model calls, tool invocations, and decision points.
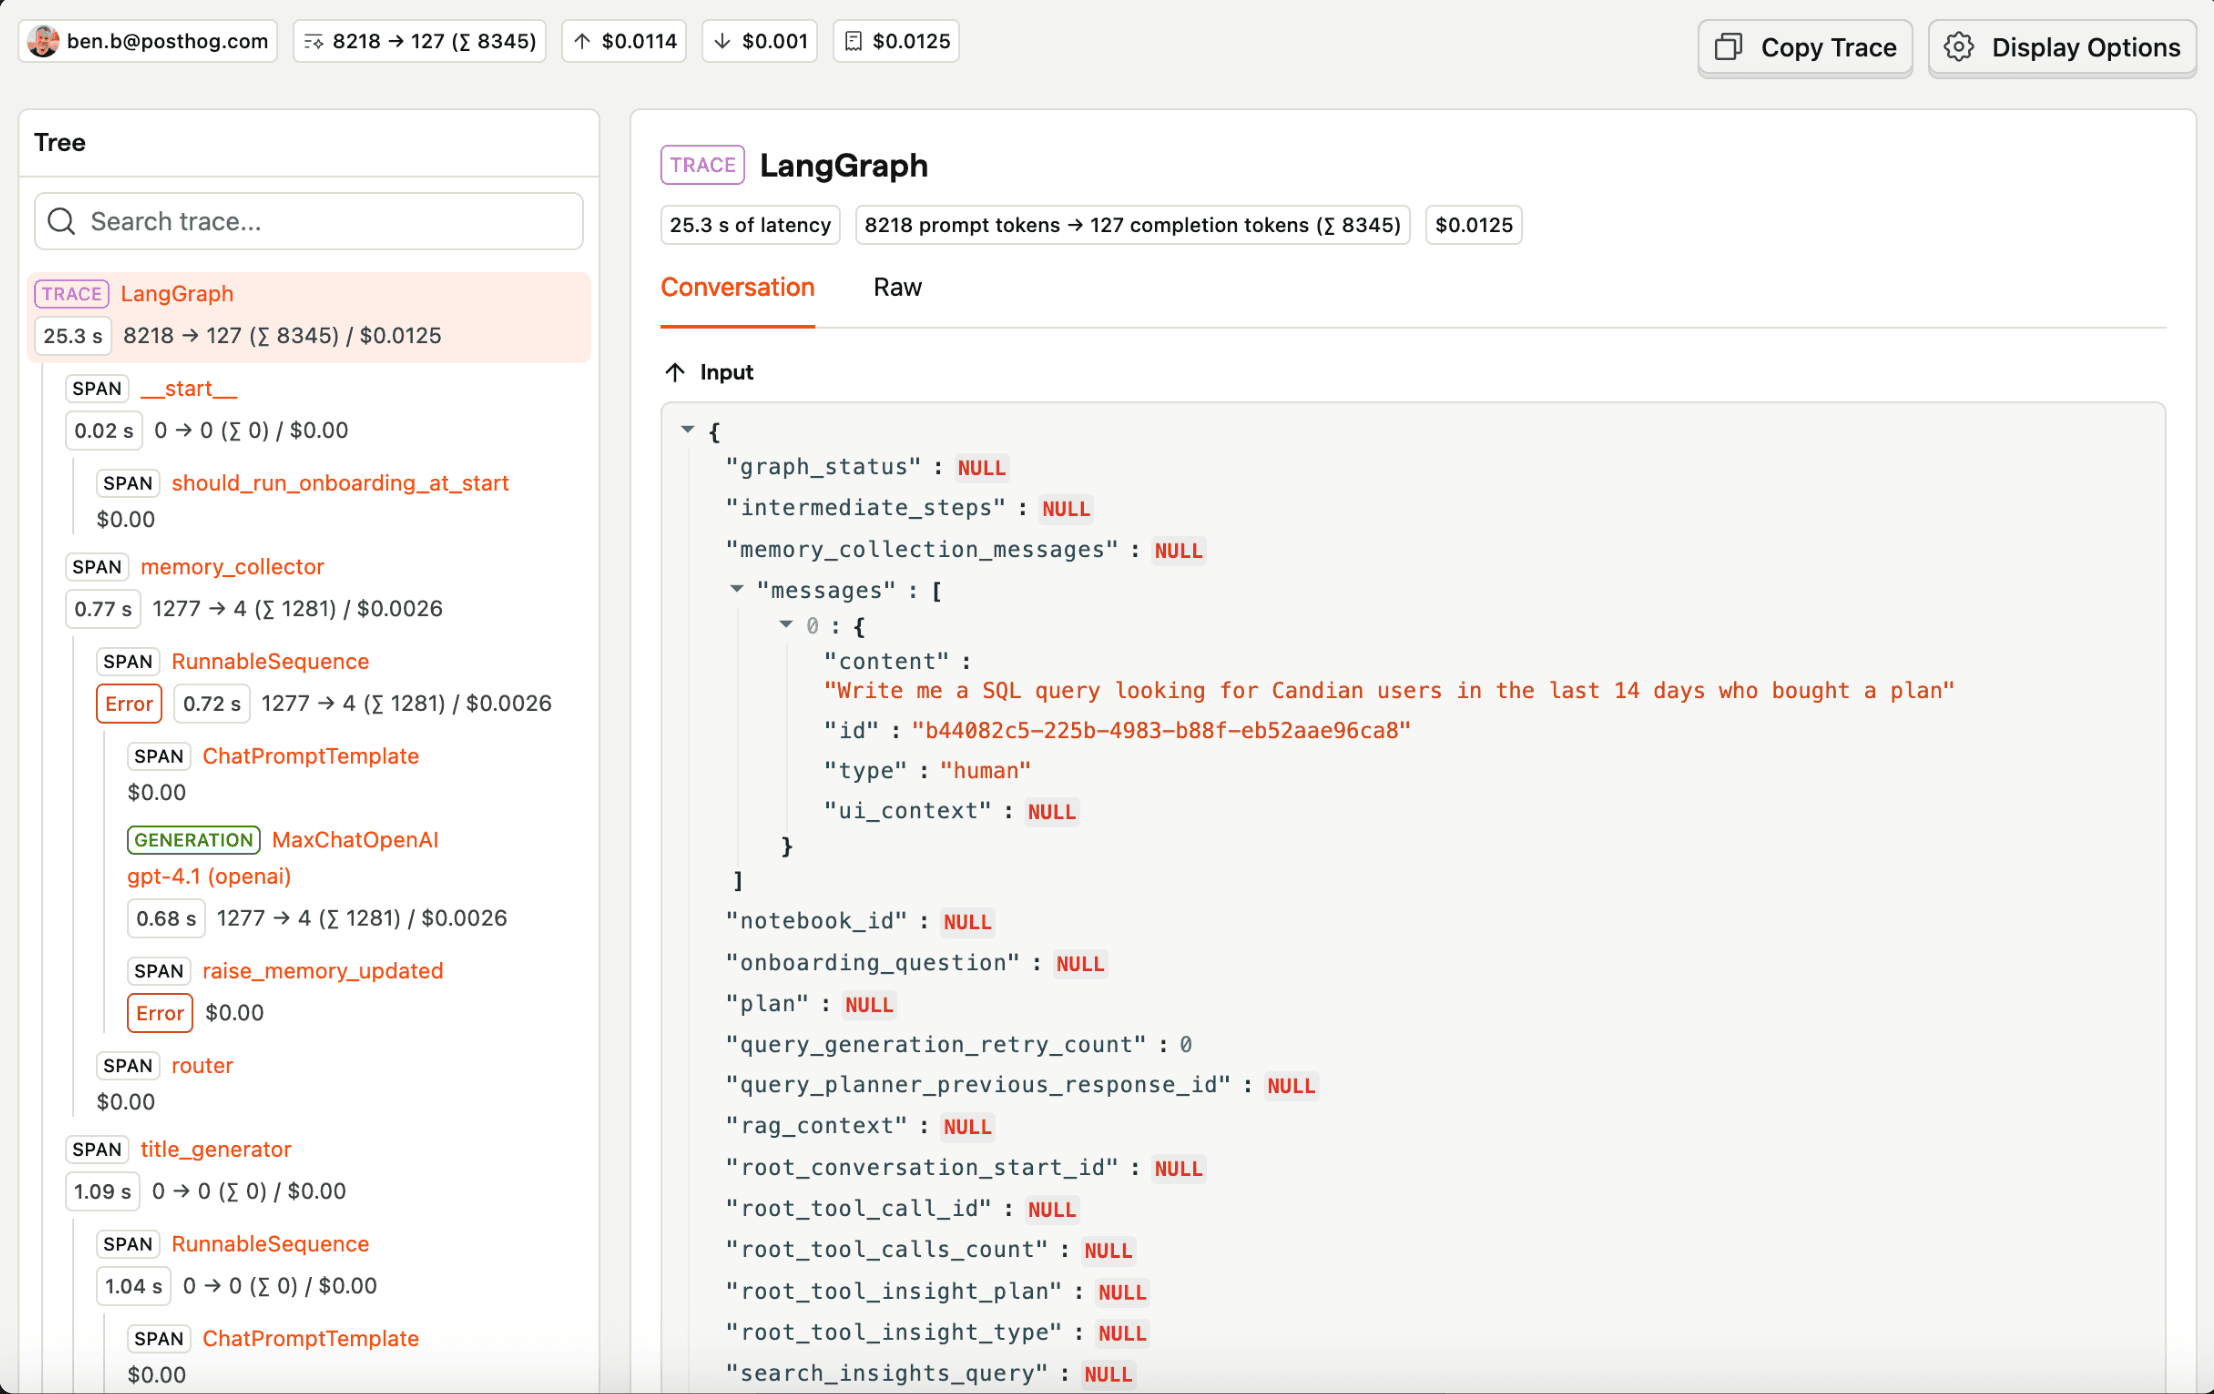
If you set up nothing else, set up tracing. Everything else builds on it.
Once you have traces, cost tracking comes nearly for free – tools calculate cost per call from the token counts and model. The useful part is breaking it down: cost per user, per feature, per model, per session. That's how you spot when a power user is eating your margins or when a feature is calling the wrong model.
LLM calls fail in more interesting ways than regular API calls. Beyond rate limits and timeouts, you'll see:
Good AI observability tools capture these alongside the traces, so when something fails you can immediately see what the agent was doing when it broke.
If you don't have error tracking set up yet for the rest of your app, our roundup of the best error tracking tools is a starting point.
The combination of LLM errors + general application errors is how you debug agent failures end-to-end.
LLM evals score the quality of outputs, not just whether they succeeded. They come in two flavors:
You usually want both. Start with deterministic where you can and reach for LLM-as-a-judge when the criterion is subjective.
Even a simple thumbs up/down on AI outputs is gold for debugging – you can use surveys for that. Pair that signal with the trace and you can find patterns in what users actually hate.
Beyond explicit feedback, implicit signals matter too: retries, edits, abandonment, copy-paste, and session length. All of these tell you whether the output was useful, even when the user doesn't bother to rate it.
Versioning, A/B testing, and runtime control of your prompts without re-deploying code. Prompt management is useful once multiple people are editing prompts or you want non-engineers to iterate. Often overrated at the MVP stage – a prompts.py file in your repo is fine if one person owns prompts and you ship changes through normal deploys.
There are three common patterns for getting data out of your app and into an observability tool:
SDK wrappers. You replace your OpenAI or Anthropic client with a wrapped version from the observability tool. Every call routes through the wrapper, which logs the inputs, outputs, and metadata before passing the call through. This is the most common pattern – PostHog, Langfuse, LangSmith, and Arize all work this way.
Use the wrapped client like the normal SDK, and every call gets traced automatically.
Proxy-based. Your app points its OpenAI base URL at a proxy URL (the observability tool's endpoint). The proxy logs the request, forwards it to OpenAI, logs the response, and returns it to your app. Pros: zero code changes beyond the base URL. Cons: less detail for multi-step agents, since the proxy only sees individual API calls.
Framework integrations. If you're using LangChain, LlamaIndex, or similar frameworks, most observability tools have a one-line integration that hooks into the framework's callbacks. Useful for agents with complex chains, since you get span-level visibility without manually instrumenting each step.
A mature AI observability setup follows a loop:
This is the workflow described in detail in our beginner's guide to testing AI agents.
The point isn't to cover every possible input (you can't) but to make sure every bad interaction teaches your system something permanent.
There are roughly half a dozen serious tools in this category as of 2026, plus several adjacent options (existing APM tools that added LLM features, ML monitoring tools that pivoted to AI observability). Here's the rundown.
PostHog's AI observability is bundled with product analytics, web analytics, session replay, feature flags, experiments, surveys, error tracking, logs, and more – which means the same user model connects through all of them.
You can correlate AI feature usage with retention, watch session replays of users interacting with your AI features, and trace errors to specific LLM calls without stitching tools together.
The free tier covers 100K LLM events/mo. EU hosting available. SDKs for OpenAI, Anthropic, LangChain, LlamaIndex, Vercel AI SDK, and others.
Key features:
Best for: Teams that want everything in one place. Especially valuable for engineers focused on correlating model behavior with what users actually do and debugging AI features with user context.
Langfuse is the open-source darling of the category. It's MIT-licensed, framework-agnostic, with depth across tracing, evaluations, and prompt management. It was acquired by ClickHouse in early 2026.
Key features:
Best for: Teams who want full control over their data through self-hosting, or who are building anything beyond raw API calls (agents, multi-step workflows, RAG pipelines). Self-host is free; their Hobby cloud plan is free but capped at 50k units and 2 users/mo, while the more complete Core plan starts at $29/mo.
LangSmith is built by the LangChain team and is the default observability tool if you're using LangChain or LangGraph. The agent debugging experience is strong if you live in that ecosystem.
Key features:
Best for: Teams already committed to LangChain. Pricing is seat-based ($39/user/mo on Plus) plus trace-based usage, which gets expensive quickly for larger teams.
Datadog added LLM Observability as a product line in 2024, and it's evolved into one of the strongest enterprise options for teams already using Datadog for the rest of their stack.
Key features:
Best for: Teams already invested in the Datadog ecosystem who want LLM monitoring in the same pane as their backend services.
The catch is pricing: the free tier covers 40K LLM spans/mo, but Datadog automatically activates LLM Observability charges the moment it detects LLM spans, so be careful if you're already on Datadog for other workloads. Hard to justify at the MVP stage.
Portkey is an AI gateway and observability platform that routes requests across 200+ LLM providers through one OpenAI-compatible endpoint. Setup is one base URL change, similar to the proxy pattern Helicone popularized.
Key features:
Best for: Teams who want cost tracking and basic logs with minimal setup, or who are juggling multiple LLM providers and want a unified routing layer.
The trade-off, as with any proxy-based tool, is that you get less detail than SDK-based tracing for complex multi-step agents. Advanced features (some observability, security, governance) are gated to the cloud product. Free tier covers 10K requests/mo; paid plans start at $49/mo.
Arize Phoenix is the open-source observability layer from Arize AI, focused on tracing and evaluation. Arize AX is the commercial, hosted version with deeper governance and team features.
Key features:
Best for: Data science and ML teams who want a tool that fits their existing workflow (notebooks, OpenTelemetry, eval-first). Less ideal for product engineering teams who want a bundled platform.
Braintrust is a commercial platform focused on evals and prompt iteration. Strong if your primary workflow is "iterate on prompts, evaluate the variants, ship the winner."
Key features:
Best for: Teams whose AI work is heavily prompt-engineering driven and who want a polished eval workflow. Pricing is custom for most plans.
Here's the short version, depending on your situation:
| Situation | Tool | Why |
|---|---|---|
| You want one tool for the whole product | PostHog | Bundled, free tier covers MVP, ties LLM data to product behavior |
| You want full data control and OSS | Langfuse or Phoenix | Both MIT-licensed and self-hostable |
| You're deep in LangChain | LangSmith | Native integration, best DX if you're in that ecosystem |
| You're already on Datadog | Datadog | Integrated with backend observability you already pay for |
| You want zero-setup cost logging across multiple providers | Portkey | Proxy-based, change one URL, you're done; supports 200+ providers |
| Your work is prompt-iteration-heavy | Braintrust | Eval-first, polished prompt workflow |
For a deeper dive into self-hostable options, see our roundup of the best open source LLM observability tools.
If you're picking a tool, here's what actually matters:
A quick pitch, since this is our blog:
PostHog covers all six core layers (tracing, costs, errors, evals, feedback, prompts) in one tool, on one free tier (100K events/mo), with the same user model connected through product analytics, session replay, feature flags, logs, surveys, and more. That means:
If you want to take it for a spin, you can start free – no credit card needed.
In practice, yes. "AI observability" is slightly broader (it can include non-LLM ML models), but most tools and most usage focus on LLM-powered features specifically. "LLM observability" and "LLM analytics" are common synonyms.
APM tells you whether your code is running and how fast. It sees that you made an API call and whether the request was successful, but it can't see what the model said, whether it was good, or how much it cost. AI observability adds the missing layer: the content, the quality, and the economics.
You usually want both. PostHog covers both sides: AI observability for what your models are doing, plus error tracking and logs for the rest of the stack, so debugging an AI feature doesn't mean switching between three tools.
Yes. The PostHog team uses AI observability, error tracking, and logs to debug our own features, including the PostHog Wizard and the agents that power our product analytics.
Yes. The setup is fast, and the free tiers will cover you well past a thousand users. Here's what to set up if you're at the MVP stage.
Observability is about what happened: traces, costs, latency, errors. Descriptive.
Evaluation is about whether what happened was good, scoring outputs against quality criteria. Prescriptive.
You need observability before evaluation makes sense, because you can't score outputs you can't see.
You can have separate tools, but you'll lose the most interesting insights – like whether your AI feature actually drives retention or conversion.
Bundled platforms (PostHog being the obvious example) share a user model across both, so you can connect AI behavior to product behavior without stitching data together.
They also share an MCP server. When you're working in Claude Code or Cursor for example, a single MCP connection lets you query LLM traces, costs, evals, and product analytics from the same place, instead of wiring up two or three MCP connections to different vendors and remembering which has what.
It varies. Some tools (PostHog, Datadog, Arize) offer PII redaction or sensitive data scanners; most let you self-host or use EU residency to keep data in your jurisdiction.
If you're handling regulated data, check for SOC 2 / HIPAA / ISO 27001 certifications and whether the tool supports redaction on the client side (before data leaves your servers).
Several options. Langfuse and Arize Phoenix are MIT-licensed and self-hostable.
PostHog is also open source (MIT) with both cloud and self-hosted deployments.
For a deeper comparison, see our roundup of the best open source LLM observability tools.
Yes, it's actually most useful for agents, since multi-step workflows are the hardest to debug without tracing.
Look for tools with strong span-based tracing (PostHog, Langfuse, LangSmith, Arize) rather than proxy-based logging, which only sees individual API calls.
For a guide to testing agents specifically, see our beginner's guide to testing AI agents.
Probably not for new projects.
Helicone was a popular proxy-based LLM observability tool, but it was acquired by Mintlify in March 2026 and entered maintenance mode.
No new feature development, bug fixes only, and the team has shifted focus to Mintlify.
Existing self-hosted deployments still work, but new deployments should look at Portkey (for the same proxy-based pattern), Langfuse (for OSS with deeper features), or PostHog (for the all-in-one approach).
Subscribe to our newsletter
Read by 100,000+ founders and builders
We'll share your email with Substack
此内容由惯性聚合(RSS阅读器)自动聚合整理,仅供阅读参考。 原文来自 — 版权归原作者所有。