


I have spent a large portion of my career working in Java. In that time, you get used to huge classes. New functionality? Just add a new method and field to the class. The cost of each new field is rarely considered. Performance is often considered from a classic computer science perspective by considering asymptotic analysis of the algorithms and data structures in-use.
Turns out that even within a growth scale for your algorithm, such as a simple for-loop O(N), time can vary dramatically if we have a little deeper understanding of the underlying hardware.
First, let’s understand our current machine. Let’s take a peek at our cache line and page sizes.
$ lscpu | grep -i cache
  L1d cache:    352 KiB (10 instances)
  L1i cache:    640 KiB (10 instances)
  L2 cache:     10 MiB (5 instances)
  L3 cache:     12 MiB (1 instance)

$ getconf LEVEL1_DCACHE_LINESIZE
  64
The instances number is a reflection of how the caches are shared amongst CPUs. If I had 10 CPUs, each one has their own L1d cache, whereas two of them would share an L2 cache.
Our cache line size is 64 bytes.
┌─────────────────────────────────────────────┐
│                 64 bytes                    │
│  byte 0   byte 1   byte 2   ...  byte 63    │
└─────────────────────────────────────────────┘
When you read a single byte from memory, the hardware will fill the surrounding 64 bytes into the cache line. The idea being that data is often temporal and spatially located, meaning data is often accessed near each other and close in time to each other.
We can reference Jeff Dean’s famous “Latency numbers every programmer should know”, however a quick recap with the values from our particular machine is the following:
┌──────────────────────────────────────────────────────────────┐
│                           CPU Core                           │
│  ┌───────────┐                                               │
│  │ Registers │  < 1 ns                                       │
│  └─────┬─────┘                                               │
│        ▼                                                     │
│  ┌───────────┐                                               │
│  │ L1d Cache │  ~35 KiB/core    ~4-5 cycles    ~1-2 ns       │
│  │           │  ~560 cache lines                             │
│  └─────┬─────┘                                               │
│        ▼                                                     │
│  ┌───────────┐                                               │
│  │ L2 Cache  │  ~2 MiB/core-pair  ~12-15 cycles  ~4-5 ns     │
│  │           │  ~32,000 cache lines                          │
│  └─────┬─────┘                                               │
│        ▼                                                     │
│  ┌───────────┐                                               │
│  │ L3 Cache  │  12 MiB shared   ~30-40 cycles   ~10-15 ns    │
│  │           │  ~196,000 cache lines                         │
│  └─────┬─────┘                                               │
│        ▼                                                     │
│  ┌───────────┐                                               │
│  │   DRAM    │  ~100-200 cycles  ~60-100 ns                  │
│  │           │                                               │
│  └───────────┘                                               │
└──────────────────────────────────────────────────────────────┘
The sizes for each cache, is the number returned by lscpu divided by the number of cores or instances; i.e. 352 KiB ÷ 10 instances = ~35 KiB.
We then determine the number of cache lines by dividing this number by 64; i.e. 35 KiB ÷ 64 bytes = 560 cache lines.
How does this all matter ? 🤔
Let’s consider an example where we want to iterate over a single struct Monster and pull out the boolean is_alive to filter them.
We create our struct, and in this particular example we need 64 bytes to represent a single Monster.
struct Monster {
      uint32_t id;          // 4 bytes
      float    x, y, z;     // 12 bytes
      float    vx, vy, vz;  // 12 bytes
      int32_t  hp;          // 4 bytes
      int32_t  attack;      // 4 bytes
      int32_t  defense;     // 4 bytes
      uint8_t  is_alive;    // 1 byte
      uint8_t  team;        // 1 byte
      char     name[22];    // 22 bytes
  };                        // total: 64 bytes
If we had an array of Monsters and we iterate over them, the cache line would fill up like so.
Each cache line would fill with a single monster, and we would fetch only the is_alive byte.
This is often referred to as “Array of Structs”.
       cache line 0                          cache line 1
┌──────────────────────────────┐   ┌──────────────────────────────┐
│ id0 x0 y0 z0 vx0 vy0 vz0 hp0 │   │ id1 x1 y1 z1 vx1 vy1 vz1 hp1 │
│ atk0 def0 alive0 team0 name0 │   │ atk1 def1 alive1 team1 name1 │
│             ▲                │   │            ▲                 │
└─────────────┼────────────────┘   └────────────┼─────────────────┘
              │                                 │
          need this                          need this
If we instead normalize the data such that each field is in it’s own list, we can pack the cache lines much tighter.
                        cache line 0
┌───────────────────────────────────────────────────────────────┐
│alive0 alive1 alive2 alive3 alive4 alive5 ... alive62 alive63  │
│  ▲      ▲      ▲      ▲      ▲      ▲          ▲       ▲      │
└──┼──────┼──────┼──────┼──────┼──────┼──────────┼───────┼──────┘
   │      │      │      │      │      │          │       │
   └──────┴──────┴──────┴──────┴──────┴──────────┴───────┘
                  all 64 in one fetch
// SoA layout
struct Monsters {
    uint32_t *ids;
    float    *xs, *ys, *zs;
    float    *vxs, *vys, *vzs;
    int32_t  *hps;
    int32_t  *attacks;
    int32_t  *defenses;
    uint8_t  *is_alives;    // packed contiguously
    uint8_t  *teams;
    char     (*names)[22];
};
This type of layout is referred to as “Struct of Arrays”.
How much of an impact can this have?
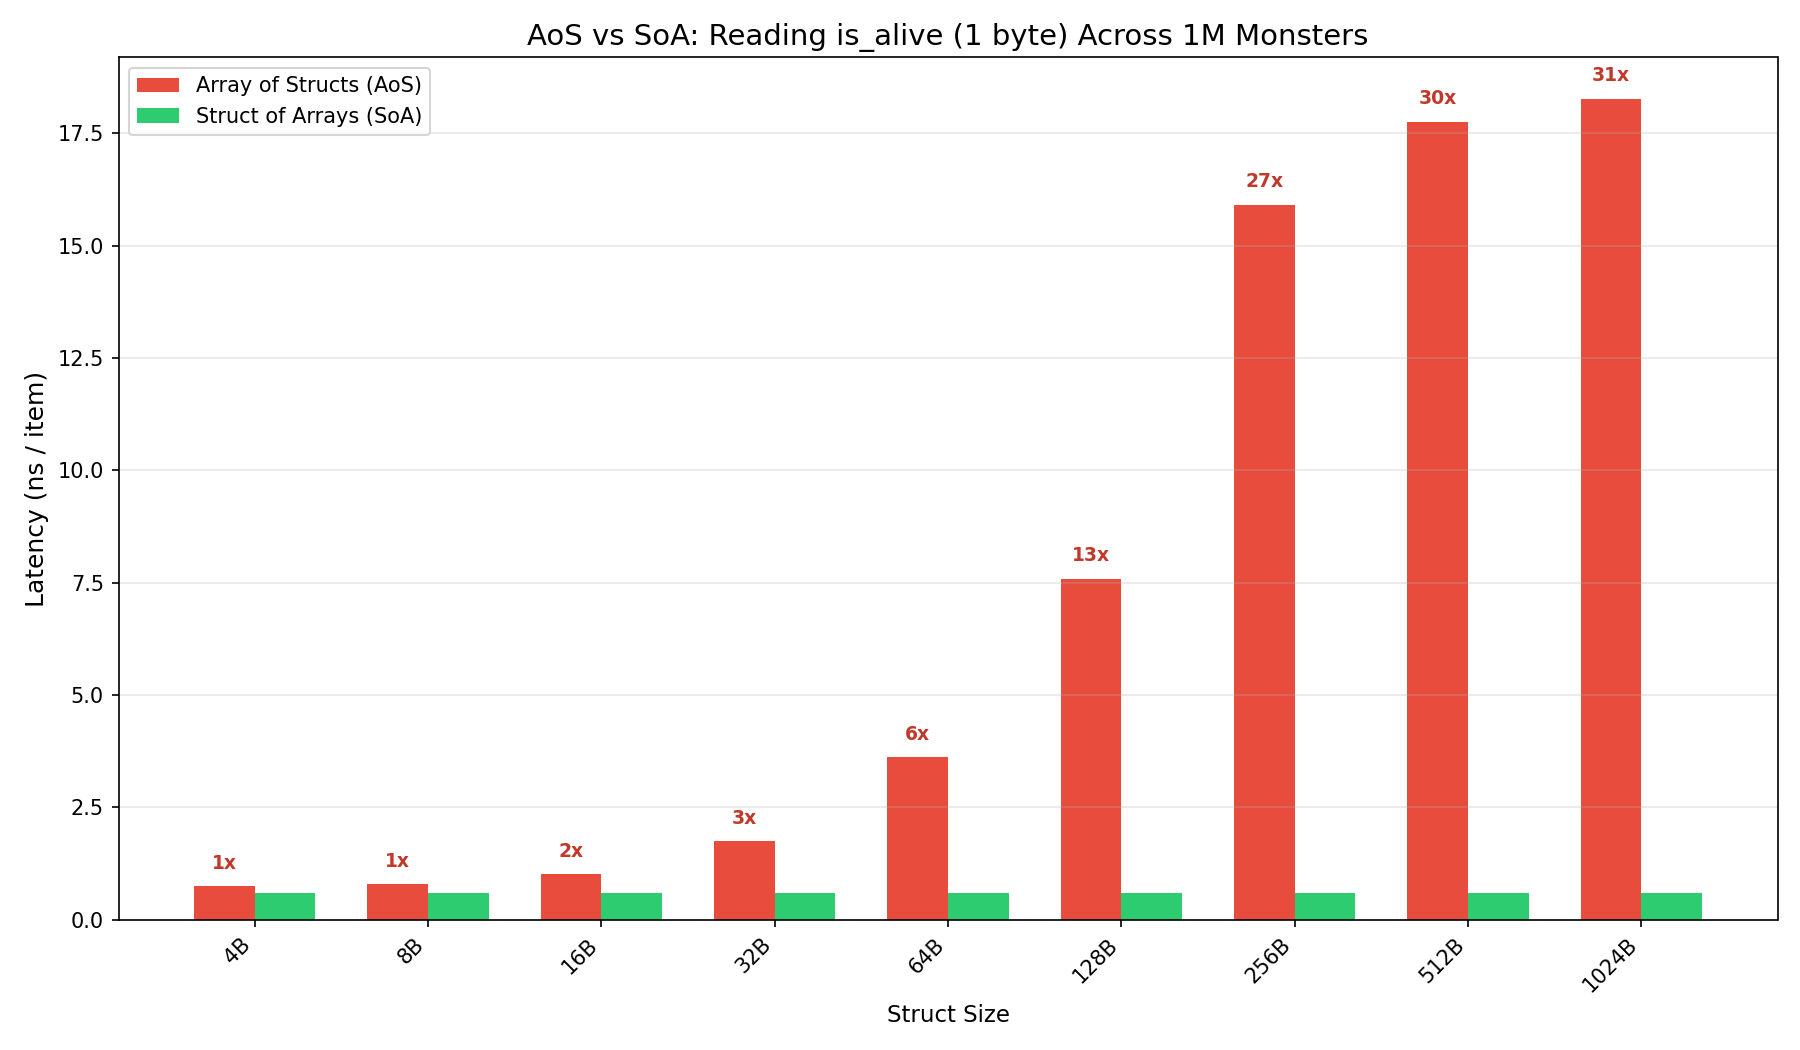
We can observe up to 30x improvements when the Monster struct is 1KiB 🤯
The delta is less observable when the struct is small because multiple Monster structs can still be fetched within a single cache-line.
This data access is incredibly hot though. Your CPU pre-fetcher knows it’s going sequentially and fetches the next cache line before you need it. You never actually have to wait for the memory to be fetched.
What about random access patterns?
Not all access patterns are sequential. Hash maps, trees, graph traversal, and pointer-heavy data structures jump to unpredictable locations. The CPU can’t prefetch what it can’t predict. With random access, the CPU needs the entire array to be present in the cache in order to avoid stalls due to memory lookup.
This means the total size of your collection determines your performance tier.
| Monsters | Working Set (64B) | Latency (64B) | Working Set (128B) | Latency (128B) |
|---|---|---|---|---|
| 512 | 32 KiB | ~3 ns | 64 KiB | ~11 ns |
| 4,096 | 256 KiB | ~11 ns | 512 KiB | ~13 ns |
| 32,768 | 2 MiB | ~29 ns | 4 MiB | ~43 ns |
| 65,536 | 4 MiB | ~49 ns | 8 MiB | ~65 ns |
| 131,072 | 8 MiB | ~163 ns | 16 MiB | ~162 ns |
Doubling the struct from 64B to 128B doubles the working set for the same number of monsters, pushing the data into slower cache levels. At just 512 monsters, a 64B struct fits in L1d at ~3 ns — but a 128B struct has already spilled to L2 at ~11 ns.
We can observe this with a pointer-chasing benchmark. We allocate N monster-sized nodes, wire them into a random order, and chase pointers. Each hop lands at an unpredictable address, defeating the CPU’s prefetcher entirely.
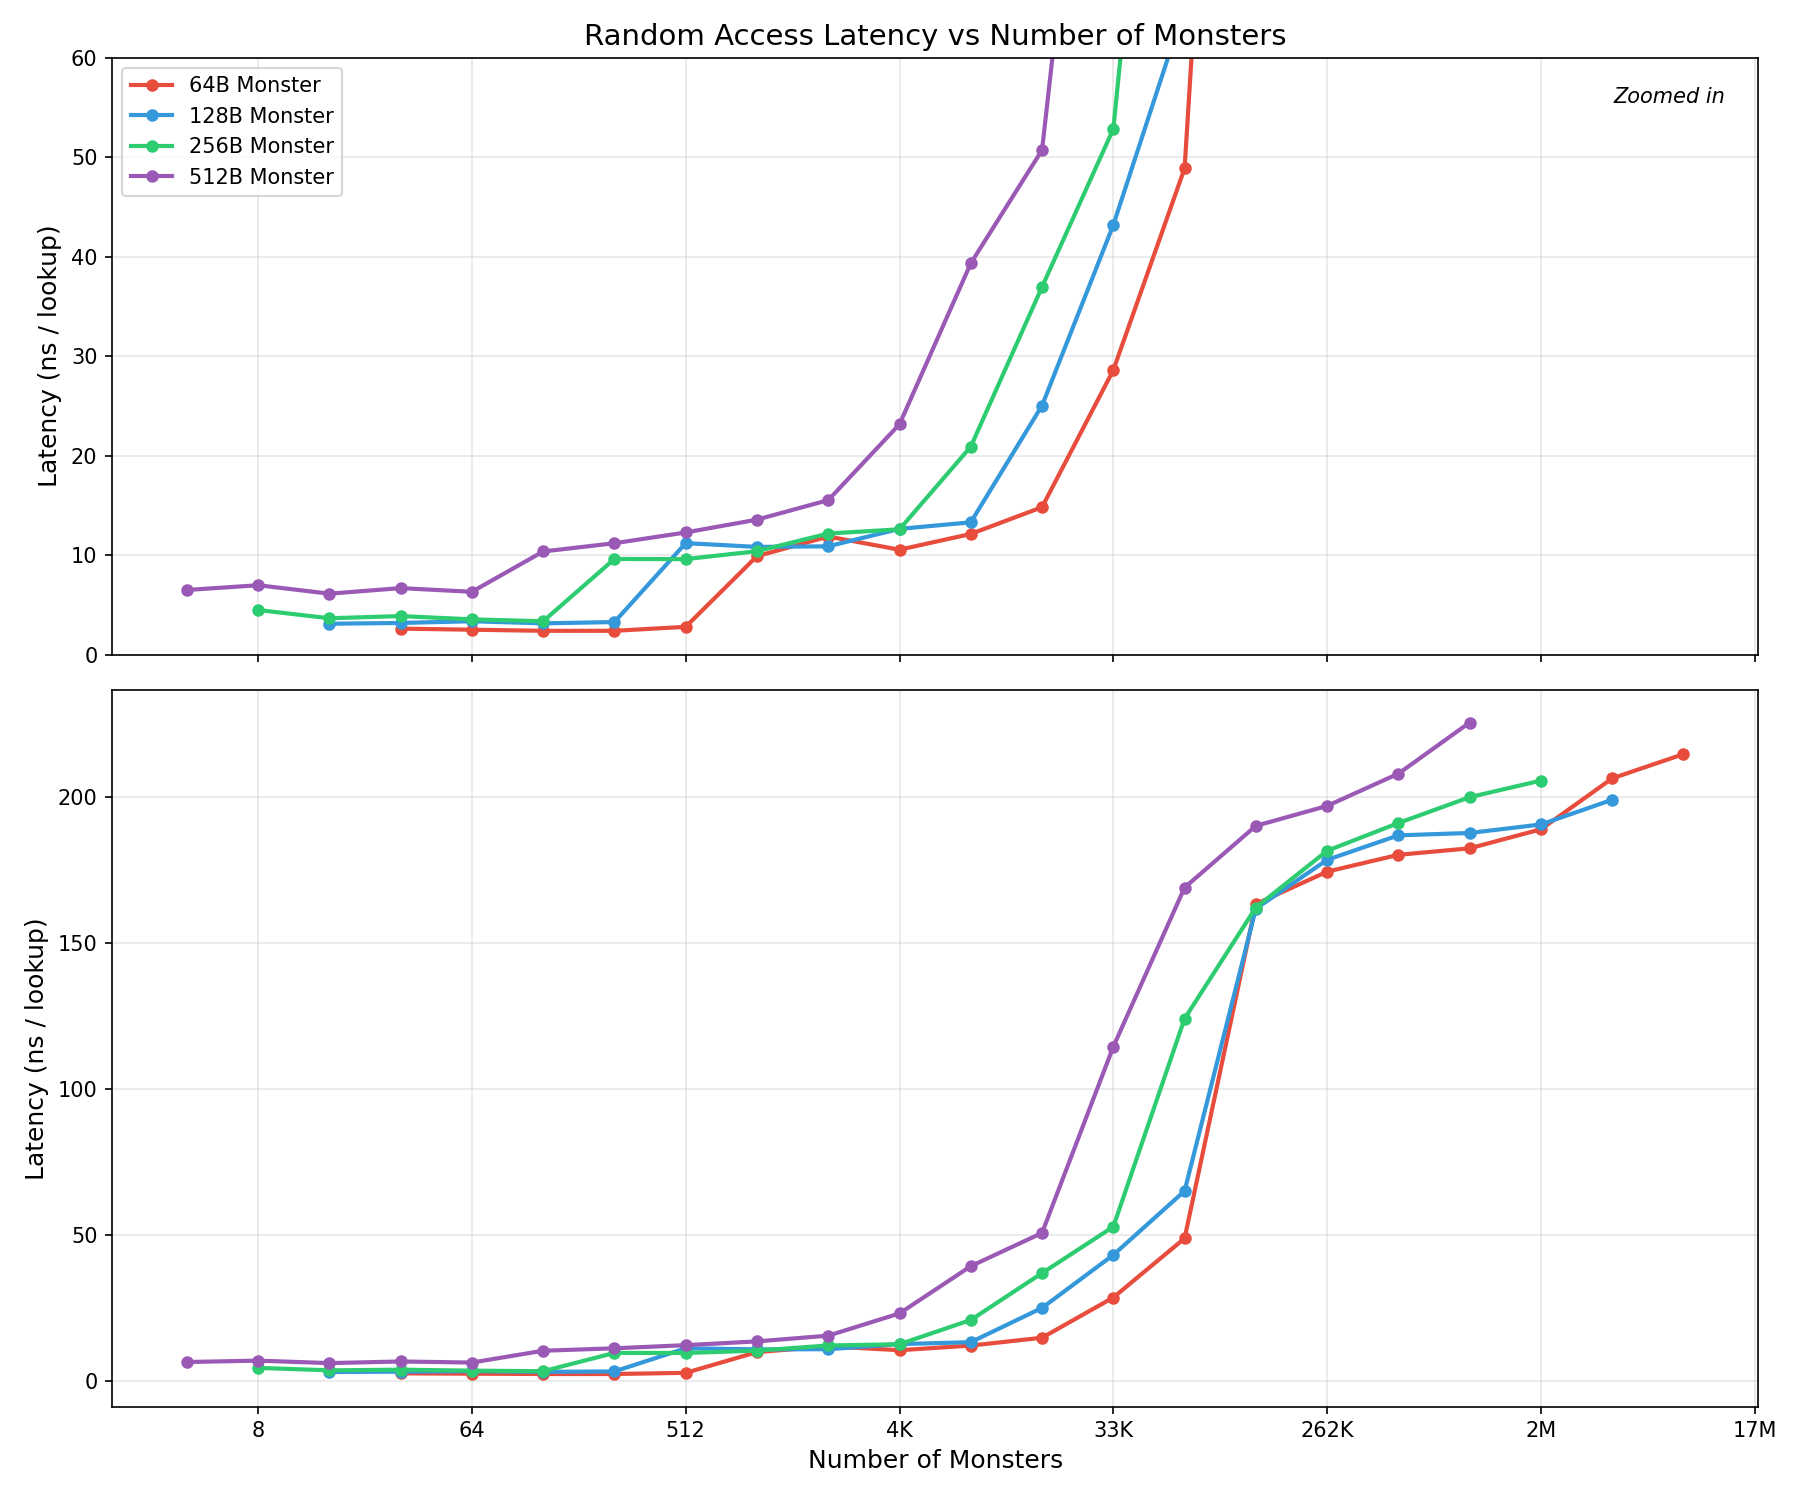
Rather than graph it logarithmically, which I find sometimes is easy to miss, I have included a zoomed in graph. We can see that all struct sizes hit the same staircase like pattern as they go through the various cache levels however the larger struct sizes are shifted left, meaning they hit the increase earlier.
This means for random access patterns, if you can keep tight control on your total working set size, you can drastically affect the time.
Knowing your struct and working set size can make a substantial difference.