


实际生产场景中,我们可能会根据不同场景,把集群拆分为多个,这个时候,Prometheus是没必要跟随集群部署多套的,于是,我们就有了这样一个需求,把多个EKS集群的相关指标,投递到一个集中化的Prometheus中。
借助于Prometheus的remote_write (opens new window)的特性,我们可以简单快捷地实现此需求,而且开源社区也有不少基于此特性封装好的现成工具,可以直接使用。
在这些工具中,我们选择了categraf (opens new window),一方面是它足够强大,支持所有常见监控对象的指标传送能力,另一方面是因为我们的告警引擎选择的是nightingale (opens new window),这两款开源工具,均出自快猫星云技术团队。
以下是其官方对于categraf的介绍:
Categraf 是一个开源的监控采集 Agent,类似 Telegraf (opens new window)、Grafana-Agent (opens new window)、Datadog-Agent (opens new window),希望对所有常见监控对象提供高质量的监控数据采集能力,采用了 All-in-one 的设计理念,可以同时支持指标、日志、链路追踪数据的采集。Categraf 由快猫星云技术团队研发并开源,快猫星云技术团队同时也是 Open-Falcon (opens new window) 和 Nightingale (opens new window) 创始研发团队。
Categraf 和 Telegraf、Exporters、Grafana-Agent、Datadog-Agent 等的关系是什么?
- Telegraf 是 InfluxDB 生态的产品,因为 InfluxDB 是支持存储字符串类型的 value,所以 Telegraf 采集的很多 field 是字符串类型,另外 InfluxDB 的设计,允许 labels 是非稳态结构,比如
result_code标签,有时其value是0,有时其value是1,在 InfluxDB 中都可以接受。但是上面两点,在以 Prometheus 为代表的、符合 OpenMetrics 标准的时序库中,处理起来就很麻烦。- Prometheus 生态有各种 Exporters,但是设计逻辑都是一个监控类型一个 Exporter,甚至一个实例一个 Exporter,生产环境就可能会部署特别多的 Exporters,管理起不方便。
- Grafana-Agent import 了大量 Exporters 的代码,没有裁剪,没有优化,没有最佳实践在产品上的落地,有些中间件,仍然采取的是一个 Grafana-Agent 一个目标实例,导致会有很多的 Grafana-Agent 进程在运行,管理起来也很不方便。
- Datadog-Agent 确实是集大成者,但是大量代码是 Python 的,整个发布包也比较大,有不少历史包袱,而且生态上是自成一派,和云原生生态、开源社区相对割裂。
所以,Categraf 确实又是一个轮子,期望解决和规避上面分析提到的一些弊端,Categraf的设计目标:
- 开源、开放、遵循 OpenTelemetry 标准;
- 拥抱 Prometheus 开源生态,支持
remote_write写入协议,支持将数据写到类似于 Promethues、M3DB、VictoriaMetrics、InfluxDB、Open-Falcon、TDengine等时序数据库;- 指标数据只采集数值,不采集字符串,标签维持稳态结构;
- 采用 All-in-One 的设计理念,所有的采集工作用一个 Agent 搞定;
- 采用 Go 语言编写,静态编译依赖少,容易分发,易于安装;
- 尽可能落地最佳实践,不需要采集的数据无需采集,针对可能会对时序库造成高基数的问题在采集侧做出规避处理;
- 针对常用的采集对象,在提供采集能力的同时,配套整理出监控大盘和告警规则模版,用户可以直接导入使用;
可能看了这些介绍之后,你仍然不知道categraf该怎么使用,不用慌,接下来就会用实际例子,来带你领略此软件的魅力与风采。
开始配置之前,需要考虑EKS集群有哪些指标需要采集,k8s集群各个维度有海量的指标,这里只介绍node节点层面的组件:kube-proxy与kubelet,以及容器指标cadvisor,和集群资源指标kube-state-metrics。
关于cadvisor的指标详细文档见:Monitoring cAdvisor with Prometheus (opens new window)
关于kube-state-metrics的详细说明文档见:https://github.com/kubernetes/kube-state-metrics
其中kube-proxy,kubelet以及cadvisor三个组件通过daemonset的方式进行部署,kube-state-metrics则以deployment的方式部署。
📢注意: 本文所有组件将会部署在monitor的ns中,因此操作之前,请确保已创建了这个命名空间。
另外:本文执行的K8S集群版本为1.30,请注意版本区别可能带来的差异。
部署daemonset需要如下几个配置内容,文件明细如下:
$ tree daemonset

daemonset
├── categraf-daemonset-config.yaml
├── categraf-daemonset.yaml
└── categraf-serviceaccount.yaml
1
2
3
4
5
6
EKS集群拉起之后,默认启动的kubelet等组件已经暴漏了metrics监控接口,只不过这个接口请求需要认证,因此我们需要先创建一个serviceaccount。
categraf-serviceaccount.yaml
---
apiVersion: rbac.authorization.k8s.io/v1
kind: ClusterRole
metadata:
  name: categraf-serviceaccount
  namespace: monitor
rules:
  - apiGroups: [""]
    resources:
      - nodes
      - nodes/metrics
      - nodes/stats
      - nodes/proxy
      - services
      - endpoints
      - pods
    verbs: ["get", "list", "watch"]
  - apiGroups:
      - extensions
      - networking.k8s.io
    resources:
      - ingresses
    verbs: ["get", "list", "watch"]
  - nonResourceURLs: ["/metrics", "/metrics/cadvisor"]
    verbs: ["get"]
---
apiVersion: v1
kind: ServiceAccount
metadata:
  name: categraf-serviceaccount
  namespace: monitor
---
apiVersion: rbac.authorization.k8s.io/v1
kind: ClusterRoleBinding
metadata:
  name: categraf-serviceaccount
roleRef:
  apiGroup: rbac.authorization.k8s.io
  kind: ClusterRole
  name: categraf-serviceaccount
subjects:
  - kind: ServiceAccount
    name: categraf-serviceaccount
    namespace: monitor
---
apiVersion: v1
kind: Secret
metadata:
  name: categraf-secret
  namespace: monitor
  annotations:
    kubernetes.io/service-account.name: categraf-serviceaccount
type: kubernetes.io/service-account-token
1
2
3
4
5
6
7
8
9
10
11
12
13
14
15
16
17
18
19
20
21
22
23
24
25
26
27
28
29
30
31
32
33
34
35
36
37
38
39
40
41
42
43
44
45
46
47
48
49
50
51
52
53
然后执行apply,把serviceaccount创建出来,我们yaml中还定义了secret,因此可以直接获取到请求的token,可以进行验证:
$ token=`kubectl get secret categraf-secret -n monitor -o jsonpath={.data.token} | base64 -d`
1
拿到token之后,请注意,接下来这一步的请求,请务必处在能够访问通节点端口的位置发起,建议直接登录到某台节点上进行请求:
$ curl -s -k -H "Authorization: Bearer $token" https://127.0.0.1:10250/metrics | head -n 5
# HELP aggregator_discovery_aggregation_count_total [ALPHA] Counter of number of times discovery was aggregated
# TYPE aggregator_discovery_aggregation_count_total counter
aggregator_discovery_aggregation_count_total 0
# HELP apiserver_audit_event_total [ALPHA] Counter of audit events generated and sent to the audit backend.
# TYPE apiserver_audit_event_total counter
1
2
3
4
5
6
sa创建完毕之后,下一步是定义categraf的采集配置,categraf的各种采集场景,以插件的形式进行提供,你可以通过如下几个位置,快速了解一个插件的用途及用法:
我们这里想要采集的指标,则通过prometheus (opens new window)这个组件来进行,即categraf通过配置文件的定义,将会化身为prometheus的一个客户端,拿到配置中指定的指标,然后写入到指定的Prometheus地址中。
categraf-daemonset-config.yaml:
---
kind: ConfigMap
metadata:
  name: categraf-daemonset-input-prometheus
  namespace: monitor
apiVersion: v1
data:
  prometheus.toml: |
    [[instances]]
    urls = ["http://127.0.0.1:10249/metrics"]
    labels = { job="kube-proxy",cluster="aws3-sgp-eks-cluster",metrics_from="categraf" }
    [[instances]]
    urls = ["https://127.0.0.1:10250/metrics"]
    bearer_token_file = "/var/run/secrets/kubernetes.io/serviceaccount/token"
    use_tls = true
    insecure_skip_verify = true
    labels = { job="kubelet",cluster="aws3-sgp-eks-cluster",metrics_from="categraf"}
    [[instances]]
    urls = ["https://127.0.0.1:10250/metrics/cadvisor"]
    bearer_token_file = "/var/run/secrets/kubernetes.io/serviceaccount/token"
    use_tls = true
    insecure_skip_verify = true
    labels = { job="cadvisor",cluster="aws3-sgp-eks-cluster",metrics_from="categraf" }
---
kind: ConfigMap
metadata:
  name: categraf-daemonset-config
  namespace: monitor
apiVersion: v1
data:
  config.toml: |
    [global]
    hostname = "$HOSTNAME"
    interval = 15
    providers = ["local"]
    [writer_opt]
    batch = 2000
    chan_size = 10000
    [[writers]]
    url = "https://prometheus.eryajf.net/api/v1/write"
    timeout = 5000
    dial_timeout = 2500
    max_idle_conns_per_host = 100
1
2
3
4
5
6
7
8
9
10
11
12
13
14
15
16
17
18
19
20
21
22
23
24
25
26
27
28
29
30
31
32
33
34
35
36
37
38
39
40
41
42
43
此处分别定义了两块儿内容,上半部分 categraf-daemonset-input-prometheus表示配置指定要采集的指标信息,categraf将会从这些地址拿到指标信息(这里建议给每个集群增加一个集群标识,并给每个基于categraf采集的指标,增加一个metrics_from的标识)。下半部分 categraf-daemonset-config 则定义了categraf拿到指标之后,要写入到哪里。
接下来就是要部署ds的服务了。
categraf-daemonset.yaml
apiVersion: apps/v1
kind: DaemonSet
metadata:
  labels:
    app: categraf-daemonset
  name: categraf-daemonset
  namespace: monitor
spec:
  selector:
    matchLabels:
      app: categraf-daemonset
  template:
    metadata:
      labels:
        app: categraf-daemonset
    spec:
      containers:
        - env:
            - name: TZ
              value: Asia/Shanghai
            - name: HOSTNAME
              valueFrom:
                fieldRef:
                  apiVersion: v1
                  fieldPath: spec.nodeName
            - name: HOSTIP
              valueFrom:
                fieldRef:
                  apiVersion: v1
                  fieldPath: status.hostIP
          image: flashcatcloud/categraf:v0.3.82
          imagePullPolicy: IfNotPresent
          name: categraf
          volumeMounts:
            - mountPath: /etc/categraf/conf
              name: categraf-daemonset-config
            - mountPath: /etc/categraf/conf/input.prometheus
              name: categraf-daemonset-input-prometheus
      hostNetwork: true
      serviceAccountName: categraf-serviceaccount
      restartPolicy: Always
      tolerations:
        - effect: NoSchedule
          operator: Exists
      volumes:
        - configMap:
            name: categraf-daemonset-config
          name: categraf-daemonset-config
        - configMap:
            name: categraf-daemonset-input-prometheus
          name: categraf-daemonset-input-prometheus
1
2
3
4
5
6
7
8
9
10
11
12
13
14
15
16
17
18
19
20
21
22
23
24
25
26
27
28
29
30
31
32
33
34
35
36
37
38
39
40
41
42
43
44
45
46
47
48
49
50
51
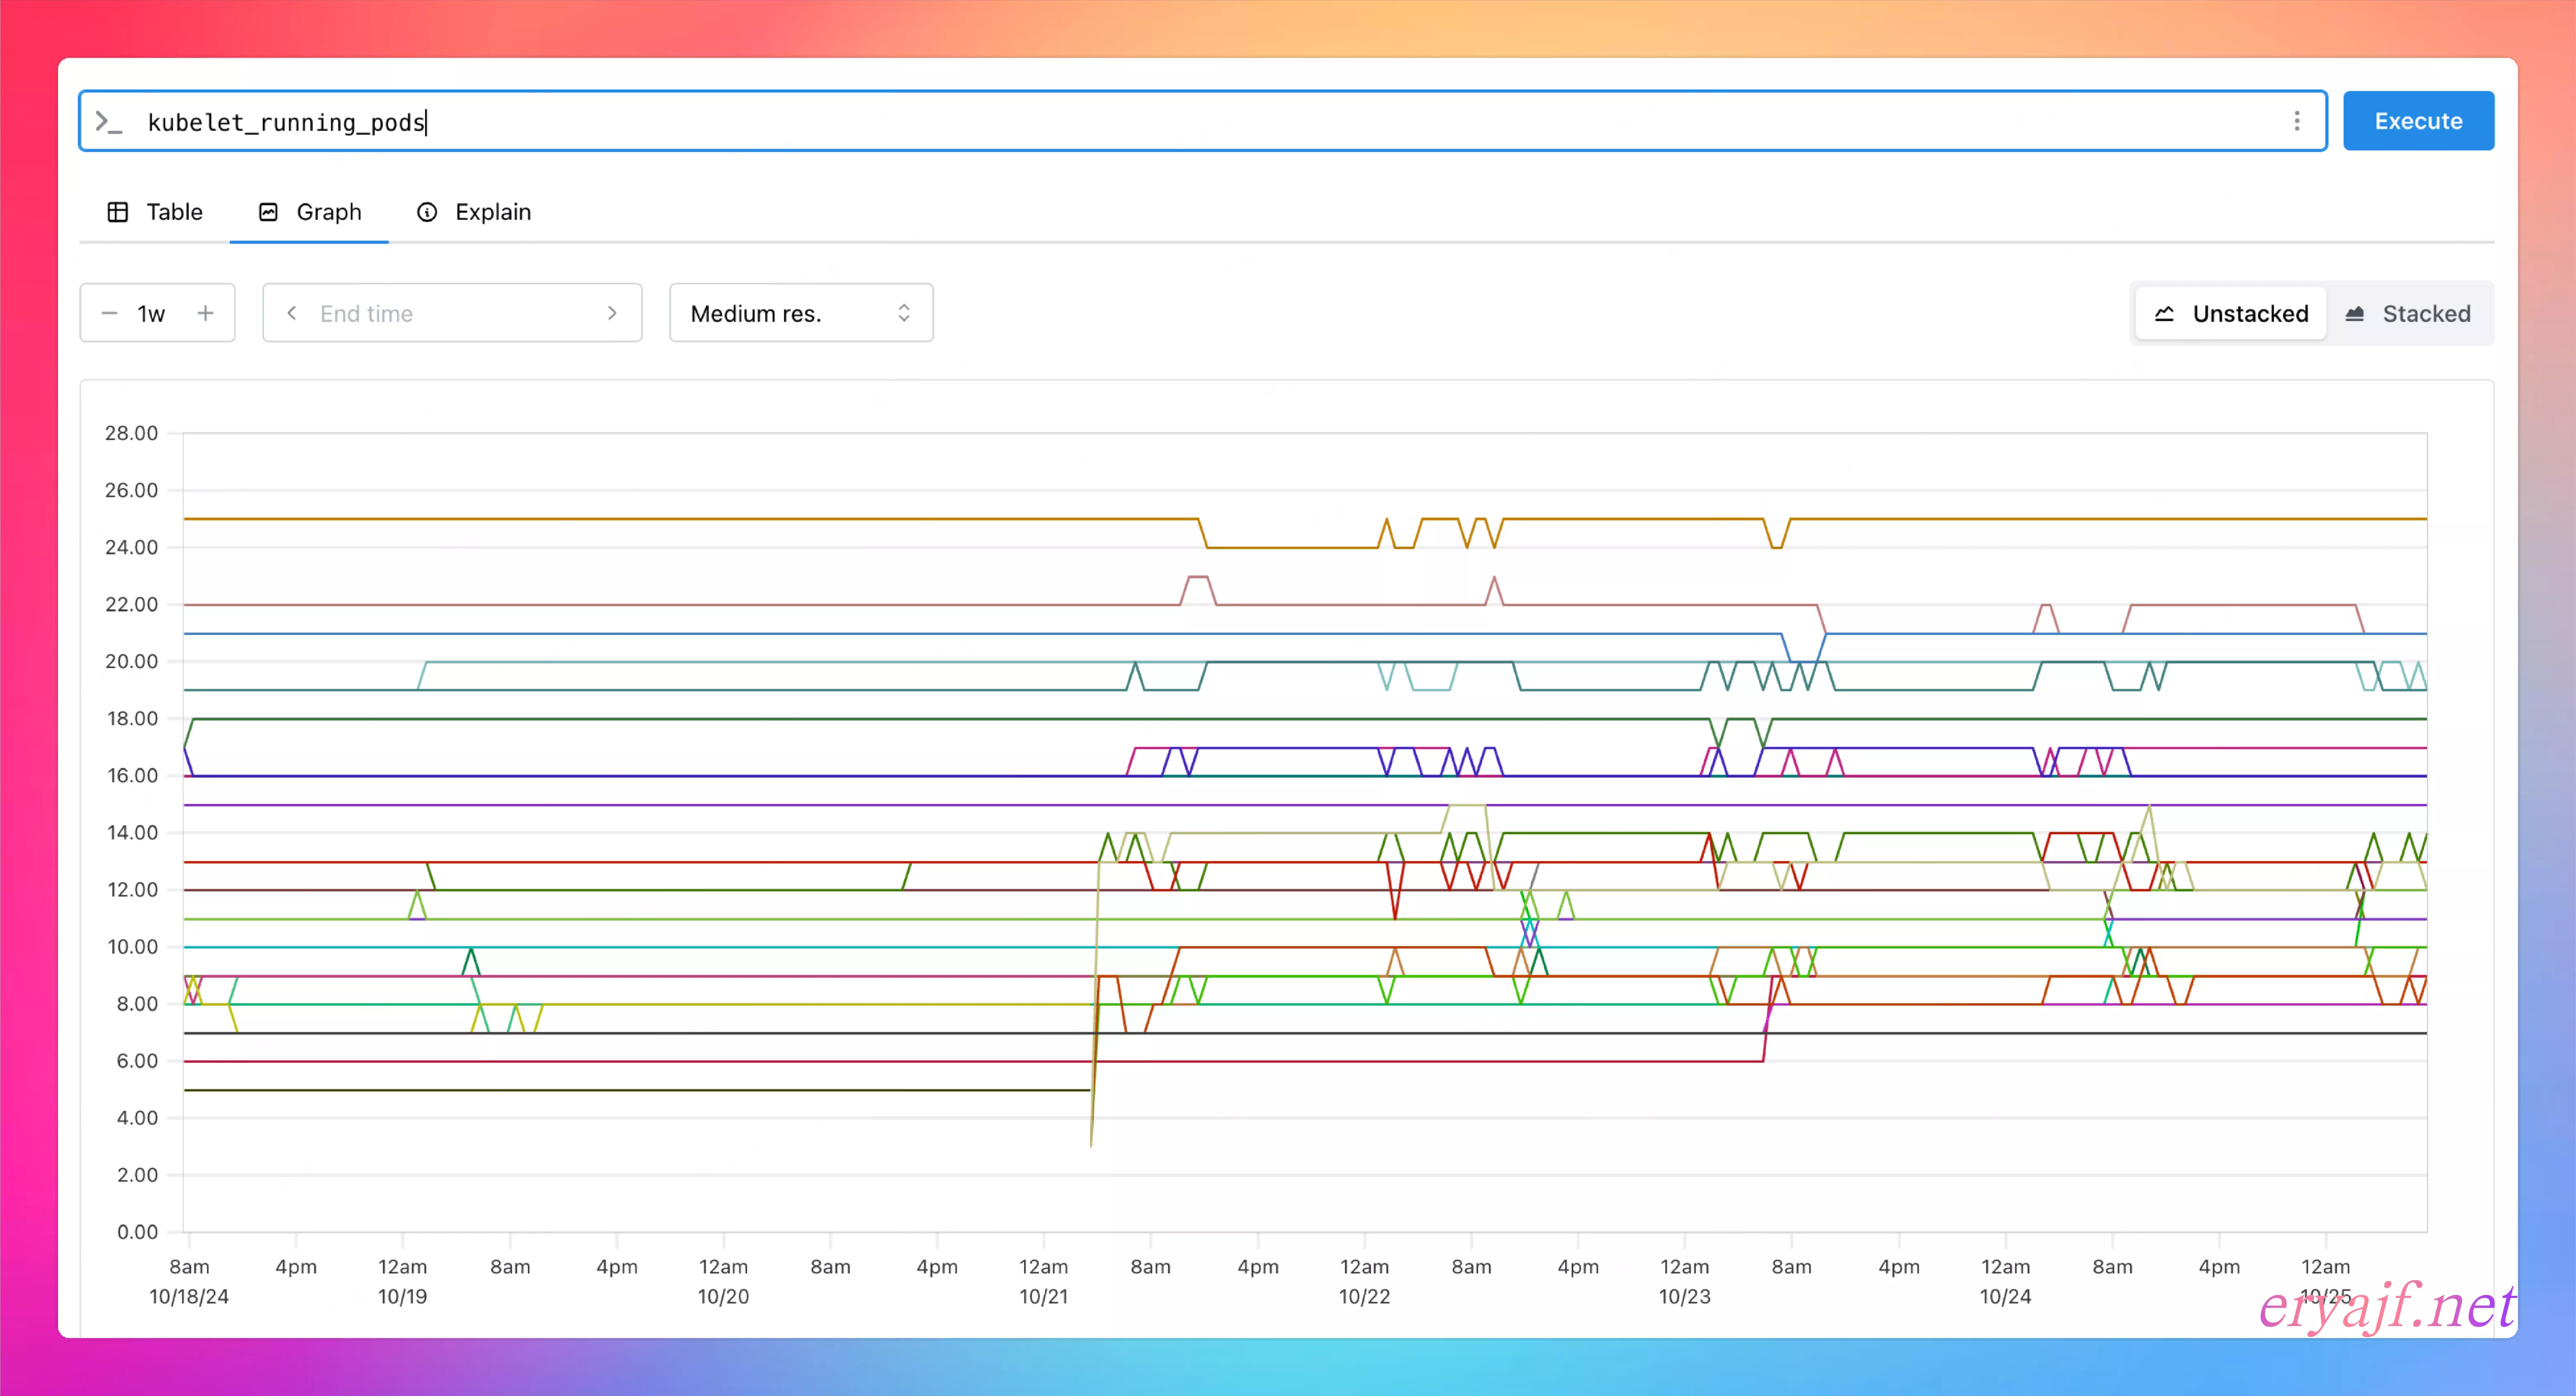
三个文件全部apply之后,就能够在远程的Prometheus中检索对应的指标了。
申明
原创文章eryajf,未经授权,严禁转载,侵权必究!此乃文中随机水印,敬请读者谅解。
上边daemonset部署成功之后,接下来部署的deployment就简单很多了。
对应的配置文件如下:
$ tree deployment

deployment
├── categraf-deployment-config.yaml
├── kube-state-metrics-deployment.yaml
└── nightingale-categraf-deployment.yaml
1
2
3
4
5
6
首先我们把kube-state-metrics部署出来。
kube-state-metrics-deployment.yaml
apiVersion: v1
automountServiceAccountToken: false
kind: ServiceAccount
metadata:
  labels:
    app.kubernetes.io/component: exporter
    app.kubernetes.io/name: kube-state-metrics
    app.kubernetes.io/version: 2.13.0
  name: kube-state-metrics
  namespace: kube-system
---
apiVersion: rbac.authorization.k8s.io/v1
kind: ClusterRole
metadata:
  labels:
    app.kubernetes.io/component: exporter
    app.kubernetes.io/name: kube-state-metrics
    app.kubernetes.io/version: 2.13.0
  name: kube-state-metrics
rules:
  - apiGroups:
      - ""
    resources:
      - configmaps
      - secrets
      - nodes
      - pods
      - services
      - serviceaccounts
      - resourcequotas
      - replicationcontrollers
      - limitranges
      - persistentvolumeclaims
      - persistentvolumes
      - namespaces
      - endpoints
    verbs:
      - list
      - watch
  - apiGroups:
      - apps
    resources:
      - statefulsets
      - daemonsets
      - deployments
      - replicasets
    verbs:
      - list
      - watch
  - apiGroups:
      - batch
    resources:
      - cronjobs
      - jobs
    verbs:
      - list
      - watch
  - apiGroups:
      - autoscaling
    resources:
      - horizontalpodautoscalers
    verbs:
      - list
      - watch
  - apiGroups:
      - authentication.k8s.io
    resources:
      - tokenreviews
    verbs:
      - create
  - apiGroups:
      - authorization.k8s.io
    resources:
      - subjectaccessreviews
    verbs:
      - create
  - apiGroups:
      - policy
    resources:
      - poddisruptionbudgets
    verbs:
      - list
      - watch
  - apiGroups:
      - certificates.k8s.io
    resources:
      - certificatesigningrequests
    verbs:
      - list
      - watch
  - apiGroups:
      - discovery.k8s.io
    resources:
      - endpointslices
    verbs:
      - list
      - watch
  - apiGroups:
      - storage.k8s.io
    resources:
      - storageclasses
      - volumeattachments
    verbs:
      - list
      - watch
  - apiGroups:
      - admissionregistration.k8s.io
    resources:
      - mutatingwebhookconfigurations
      - validatingwebhookconfigurations
    verbs:
      - list
      - watch
  - apiGroups:
      - networking.k8s.io
    resources:
      - networkpolicies
      - ingressclasses
      - ingresses
    verbs:
      - list
      - watch
  - apiGroups:
      - coordination.k8s.io
    resources:
      - leases
    verbs:
      - list
      - watch
  - apiGroups:
      - rbac.authorization.k8s.io
    resources:
      - clusterrolebindings
      - clusterroles
      - rolebindings
      - roles
    verbs:
      - list
      - watch
---
apiVersion: rbac.authorization.k8s.io/v1
kind: ClusterRoleBinding
metadata:
  labels:
    app.kubernetes.io/component: exporter
    app.kubernetes.io/name: kube-state-metrics
    app.kubernetes.io/version: 2.13.0
  name: kube-state-metrics
roleRef:
  apiGroup: rbac.authorization.k8s.io
  kind: ClusterRole
  name: kube-state-metrics
subjects:
  - kind: ServiceAccount
    name: kube-state-metrics
    namespace: kube-system
---
apiVersion: v1
kind: Service
metadata:
  labels:
    app.kubernetes.io/component: exporter
    app.kubernetes.io/name: kube-state-metrics
    app.kubernetes.io/version: 2.13.0
  name: kube-state-metrics
  namespace: kube-system
spec:
  type: NodePort
  ports:
    - name: http-metrics
      port: 8080
      targetPort: http-metrics
      nodePort: 31666
    - name: telemetry
      port: 8081
      targetPort: telemetry
  selector:
    app.kubernetes.io/name: kube-state-metrics
---
apiVersion: apps/v1
kind: Deployment
metadata:
  labels:
    app.kubernetes.io/component: exporter
    app.kubernetes.io/name: kube-state-metrics
    app.kubernetes.io/version: 2.13.0
  name: kube-state-metrics
  namespace: kube-system
spec:
  replicas: 1
  selector:
    matchLabels:
      app.kubernetes.io/name: kube-state-metrics
  template:
    metadata:
      labels:
        app.kubernetes.io/component: exporter
        app.kubernetes.io/name: kube-state-metrics
        app.kubernetes.io/version: 2.13.0
    spec:
      automountServiceAccountToken: true
      containers:
        - image: registry.k8s.io/kube-state-metrics/kube-state-metrics:v2.13.0
          livenessProbe:
            httpGet:
              path: /livez
              port: http-metrics
            initialDelaySeconds: 5
            timeoutSeconds: 5
          name: kube-state-metrics
          ports:
            - containerPort: 8080
              name: http-metrics
            - containerPort: 8081
              name: telemetry
          readinessProbe:
            httpGet:
              path: /readyz
              port: telemetry
            initialDelaySeconds: 5
            timeoutSeconds: 5
          securityContext:
            allowPrivilegeEscalation: false
            capabilities:
              drop:
                - ALL
            readOnlyRootFilesystem: true
            runAsNonRoot: true
            runAsUser: 65534
            seccompProfile:
              type: RuntimeDefault
      nodeSelector:
        kubernetes.io/os: linux
      serviceAccountName: kube-state-metrics
---
apiVersion: v1
kind: Service
metadata:
  annotations:
    prometheus.io/scrape: "true"
    prometheus.io/port: "8080"
  name: kube-state-metrics
  namespace: kube-system
  labels:
    app: kube-state-metrics
spec:
  ports:
    - name: kube-state-metrics
      port: 8080
      protocol: TCP
  selector:
    app.kubernetes.io/name: kube-state-metrics
1
2
3
4
5
6
7
8
9
10
11
12
13
14
15
16
17
18
19
20
21
22
23
24
25
26
27
28
29
30
31
32
33
34
35
36
37
38
39
40
41
42
43
44
45
46
47
48
49
50
51
52
53
54
55
56
57
58
59
60
61
62
63
64
65
66
67
68
69
70
71
72
73
74
75
76
77
78
79
80
81
82
83
84
85
86
87
88
89
90
91
92
93
94
95
96
97
98
99
100
101
102
103
104
105
106
107
108
109
110
111
112
113
114
115
116
117
118
119
120
121
122
123
124
125
126
127
128
129
130
131
132
133
134
135
136
137
138
139
140
141
142
143
144
145
146
147
148
149
150
151
152
153
154
155
156
157
158
159
160
161
162
163
164
165
166
167
168
169
170
171
172
173
174
175
176
177
178
179
180
181
182
183
184
185
186
187
188
189
190
191
192
193
194
195
196
197
198
199
200
201
202
203
204
205
206
207
208
209
210
211
212
213
214
215
216
217
218
219
220
221
222
223
224
225
226
227
228
229
230
231
232
233
234
235
236
237
238
239
240
241
242
243
244
245
246
247
248
249
250
251
252
然后把配置文件定义好。
categraf-deployment-config.yaml
---
kind: ConfigMap
metadata:
  name: categraf-deployment-scrape-config
  namespace: monitor
apiVersion: v1
data:
  in_cluster_scrape.yaml: |
    global:
      scrape_interval: 15s
    scrape_configs:
      - job_name: "kube-state-metrics"
        metrics_path: "/metrics"
        static_configs:
          - targets: ["kube-state-metrics.kube-system.svc.cluster.local:8080"]
        relabel_configs:
          - action: replace
            target_label: metrics_from
            replacement: 'categraf'
          - action: replace
            target_label: cluster
            replacement: 'aws3-sgp-eks-cluster'
      # 如果你这里还有其他服务需要监控,同时可以在此定义
      - job_name: "examples"
        metrics_path: "/metrics"
        static_configs:
          - targets: ["examples.app.svc.cluster.local:1234"]
        relabel_configs:
          - action: replace
            target_label: metrics_from
            replacement: 'categraf'
          - action: replace
            target_label: cluster
            replacement: 'aws3-sgp-eks-cluster'
    remote_write:
      - url: 'https://prometheus.eryajf.net/api/v1/write'
---
kind: ConfigMap
metadata:
  name: categraf-deployment-config
  namespace: monitor
apiVersion: v1
data:
  config.toml: |
    [global]
    print_configs = true
    hostname = "$HOSTNAME"
    omit_hostname = false
    precision = "ms"
    interval = 15
    [global.labels]
    region = "shanghai"
    env = "aws3-sgp-eks-cluster"
    [writer_opt]
    batch = 2000
    chan_size = 10000
    [[writers]]
    url = "https://prometheus.eryajf.net/api/v1/write"
    timeout = 5000
    dial_timeout = 2500
    max_idle_conns_per_host = 100
  prometheus.toml: |
    [prometheus]
    enable = true
    scrape_config_file="/opt/categraf/scrape/in_cluster_scrape.yaml"
    ## log level, debug warn info error
    log_level="info"
    ## wal reserve time duration, default value is 2 hour
    # wal_min_duration=2
    ## wal storage path, default value is ./data-agent
    wal_storage_path="/opt/categraf/prometheus-wal"
1
2
3
4
5
6
7
8
9
10
11
12
13
14
15
16
17
18
19
20
21
22
23
24
25
26
27
28
29
30
31
32
33
34
35
36
37
38
39
40
41
42
43
44
45
46
47
48
49
50
51
52
53
54
55
56
57
58
59
60
61
62
63
64
65
66
67
68
69
70
71
上边已经做过介绍,这里就不重复介绍了。
接下来就是部署categraf。
categraf-deployment-config.yaml
---
apiVersion: apps/v1
kind: Deployment
metadata:
  labels:
    app: n9e
    component: categraf
  name: nightingale-categraf-deployment
  namespace: monitor
spec:
  replicas: 1
  selector:
    matchLabels:
      app: n9e
      component: categraf
  template:
    metadata:
      labels:
        app: n9e
        component: categraf
    spec:
      containers:
        - env:
            - name: TZ
              value: Asia/Shanghai
            - name: HOSTNAME
              valueFrom:
                fieldRef:
                  apiVersion: v1
                  fieldPath: spec.nodeName
            - name: HOSTIP
              valueFrom:
                fieldRef:
                  apiVersion: v1
                  fieldPath: status.hostIP
          image: flashcatcloud/categraf:v0.3.82
          imagePullPolicy: IfNotPresent
          name: categraf
          command: ["/usr/bin/categraf"]
          args: ["-configs", "/opt/categraf/conf"]
          terminationMessagePolicy: File
          volumeMounts:
            - mountPath: /opt/categraf/conf
              name: categraf-deployment-config
            - mountPath: /opt/categraf/scrape
              name: categraf-deployment-scrape-config
            - mountPath: /opt/categraf/prometheus-wal
              name: prometheus-wal
      dnsPolicy: ClusterFirst
      hostNetwork: false
      restartPolicy: Always
      schedulerName: default-scheduler
      securityContext: {}
      serviceAccountName: categraf-serviceaccount
      terminationGracePeriodSeconds: 30
      tolerations:
        - effect: NoSchedule
          operator: Exists
      volumes:
        - configMap:
            defaultMode: 420
            name: categraf-deployment-config
          name: categraf-deployment-config
        - configMap:
            defaultMode: 420
            name: categraf-deployment-scrape-config
          name: categraf-deployment-scrape-config
        - emptyDir: {}
          name: prometheus-wal
1
2
3
4
5
6
7
8
9
10
11
12
13
14
15
16
17
18
19
20
21
22
23
24
25
26
27
28
29
30
31
32
33
34
35
36
37
38
39
40
41
42
43
44
45
46
47
48
49
50
51
52
53
54
55
56
57
58
59
60
61
62
63
64
65
66
67
68
69
然后执行apply,就能够把kube-state-metrics的指标正常采集到统一的远程Prometheus中了。
上边内容介绍了如何把EKS集群的一些指标采集到集群外的Prometheus中,从而在面对多集群的时候,一个Prometheus就搞定,而不用跟随集群存在多套Prometheus集群。
在deployment的示例中,还有一个example的扩展示例,事实上在实际业务中,的确会存在此类监控的需求,可以往下复制配置文件,进行采集。
不过这个方案还有一个问题无法解决,那就是与Prometheus-Operater集成的ServiceMonitor这种场景,目前categraf的issue中也有人反馈过这个问题,开发者也讲了未来会通过某种方案解决此问题。我个人目前则是写了一个脚本,来把需要基于ServiceMonitor采集的指标中转出去。
此内容由惯性聚合(RSS阅读器)自动聚合整理,仅供阅读参考。 原文来自 — 版权归原作者所有。