惯性聚合 高效追踪和阅读你感兴趣的博客、新闻、科技资讯
阅读原文 在惯性聚合中打开

推荐订阅源

Martin Fowler
Martin Fowler
有赞技术团队
有赞技术团队
博客园_首页
H
Help Net Security
GbyAI
GbyAI
aimingoo的专栏
aimingoo的专栏
V
Visual Studio Blog
The Cloudflare Blog
腾讯CDC
Jina AI
Jina AI
Last Week in AI
Last Week in AI
月光博客
月光博客
博客园 - 叶小钗
Google DeepMind News
B
Blog RSS Feed
Blog — PlanetScale
Blog — PlanetScale
人人都是产品经理
人人都是产品经理
Engineering at Meta
Engineering at Meta
Y
Y Combinator Blog
Hugging Face - Blog
Hugging Face - Blog
博客园 - 聂微东
爱范儿
爱范儿
N
Netflix TechBlog - Medium
F
Fortinet All Blogs

陈少文的网站

巨变与机遇的未来十年 Kubernetes 平台管理软件压力测试方案 使用镜像部署 Hexo 静态页面 终于等到你 - GitHub 镜像仓库服务(ghcr.io) 一起来学 Go --(6)Interface 一起来学 Go --(5)Goroutine 和 Channel 什么是函数式编程 如何在 Kubernetes 集群集成 Kata 柯里化与偏函数 使用 PyGithub 自动创建 Label 软件产品是团队能力的输出 Helm 2 、Helm 3 比较 IoT 变现 Kubernetes 中的 DNS 服务 国内的 Helm 镜像源 Harbor 使用自签证书支持 Https 访问 DevOps 工具链之 Prow 如何使用 kfctl 安装 Kubeflow VS Code 无法下载 Go 插件的工具包 工程师更应具有服务精神 你不知道的 Docker 使用技巧 使用 Docker 运行 Tensorflow 论中国 什么是左移 如何清空 Git 仓库全部历史记录 一禅小和尚 有风吹过厨房 时间的玫瑰 如何在 CentOS 安装 GPU 驱动 开发 Tips(19)
为什么 top node、free、Grafana 的数据对不上
微信公众号 · 2024-07-26 · via 陈少文的网站

Please enable Javascript to view the contents

1. top 查看节点资源使用率超过 100%

1
2
3
4
5
6
kubectl top node

NAME            CPU(cores)   CPU%   MEMORY(bytes)   MEMORY%
master-1        995m         16%    13760Mi         118%
master-2        827m         13%    10672Mi         92%
master-3        889m         14%    10244Mi         88%

这是由于在计算使用率时,默认使用的是可分配的资源,排除了 Kubelet 保留的部分。在 kubectl 源码中可以看到:

1
2
3
4
5
6
7
for _, n := range nodes {
  if !o.ShowCapacity {
    availableResources[n.Name] = n.Status.Allocatable
  } else {
    availableResources[n.Name] = n.Status.Capacity
  }
}

如果需要查看节点总的资源使用情况,可添加 --show-capacity 参数:

1
2
3
4
5
6
kubectl top node --show-capacity

NAME            CPU(cores)   CPU%   MEMORY(bytes)   MEMORY%
master-1        1161m        14%    13822Mi         87%
master-2        998m         12%    10640Mi         67%
master-3        877m         10%    10298Mi         65%

实际上 Allocatable 和 Capacity 在节点对象上可以直接看到:

 1
 2
 3
 4
 5
 6
 7
 8
 9
10
11
12
13
14
15
16
17
18
kubectl get node master-1  -oyaml

...
status:
  allocatable:
    cpu: "6"
    ephemeral-storage: "284333649859"
    hugepages-1Gi: "0"
    hugepages-2Mi: "0"
    memory: 11877928Ki
    pods: "110"
  capacity:
    cpu: "8"
    ephemeral-storage: 308521756Ki
    hugepages-1Gi: "0"
    hugepages-2Mi: "0"
    memory: 16174632Ki
    pods: "110"

在 Kubelet 的配置文件 /var/lib/kubelet/config.yaml 或者启动命令参数 --system-reserved=cpu=1,memory=2Gi --kube-reserved=cpu=1,memory=2Gi 可以查看具体的资源预留额度。详情可以参考 https://kubernetes.io/zh-cn/docs/tasks/administer-cluster/reserve-compute-resources/

Allocatable = Capacity - Reserved - Evicted Threshold(驱逐容忍度),其中 Evicted Threshold 根据不同资源,通常为一个很小的数值或比例。

2. top node 与 Grafana 数据不一致

2.1 free 与 node_memory_Mem 同源

使用 free 查看节点资源使用情况如下:

1
2
3
4
free -h
              total        used        free      shared  buff/cache   available
Mem:          503Gi        62Gi       243Gi        12Gi       198Gi       426Gi
Swap:            0B          0B          0B

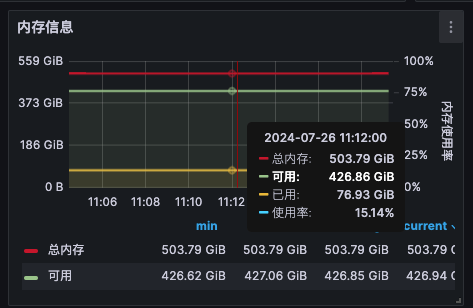
Grafana 节点资源使用情况如下:

使用的 PromQL 为:

  • 总内存, node_memory_MemTotal_bytes{instance=~\"$node\"}
  • 已用, node_memory_MemTotal_bytes{instance=~\"$node\"} - node_memory_MemAvailable_bytes{instance=~\"$node\"}

从数值上看,free 与 Grafana 数据基本一致。

因为 Grafana 使用的 Node Exporter 采集的 node_memory_Mem 这些指标来自主机的 /proc/meminfofree -h 的数据同源。

2.2 top 使用的是 metrics-server 采集的指标

top 查看节点资源使用情况

1
2
3
kubectl top node my-node-name
NAME           CPU(cores)   CPU%   MEMORY(bytes)   MEMORY%
my-node-name   4809m        8%     132883Mi        25%

模拟 top 命令向 metrics-server 请求数据:

 1
 2
 3
 4
 5
 6
 7
 8
 9
10
kubectl get --raw /apis/metrics.k8s.io/v1beta1/nodes/my-node-name

{
    "kind": "NodeMetrics",
    "window": "10.292s",
    "usage": {
        "cpu": "5094380203n",
        "memory": "136278224Ki"
    }
}

这里的内存使用量约 130 Gi,130 / 503 = 25.8% 与 kubectl top node 基本一致。

2.3 metrics-server 的数据来自 Kubelet

从 metrics-server 的源码可以看到,其在请求 Kubelet 的数据。

 1
 2
 3
 4
 5
 6
 7
 8
 9
10
11
12
13
14
15
16
17
18
19
20
21
func (kc *kubeletClient) GetMetrics(ctx context.Context, node *corev1.Node) (*storage.MetricsBatch, error) {
	port := kc.defaultPort
	path := "/metrics/resource"
	nodeStatusPort := int(node.Status.DaemonEndpoints.KubeletEndpoint.Port)
	if kc.useNodeStatusPort && nodeStatusPort != 0 {
		port = nodeStatusPort
	}
	if metricsPath := node.Annotations[AnnotationResourceMetricsPath]; metricsPath != "" {
		path = metricsPath
	}
	addr, err := kc.addrResolver.NodeAddress(node)
	if err != nil {
		return nil, err
	}
	url := url.URL{
		Scheme: kc.scheme,
		Host:   net.JoinHostPort(addr, strconv.Itoa(port)),
		Path:   path,
	}
	return kc.getMetrics(ctx, url.String(), node.Name)
}

模拟 metrics-server 向 Kubelet 请求数据

1
2
3
4
5
6
7
8
kubectl get --raw /api/v1/nodes/my-node-name/proxy/metrics/resource |grep node_

# HELP node_cpu_usage_seconds_total [ALPHA] Cumulative cpu time consumed by the node in core-seconds
# TYPE node_cpu_usage_seconds_total counter
node_cpu_usage_seconds_total 1.2683530100816046e+08 1721957059813
# HELP node_memory_working_set_bytes [ALPHA] Current working set of the node in bytes
# TYPE node_memory_working_set_bytes gauge
node_memory_working_set_bytes 1.39524251648e+11 1721957059813

符合预期,请求 metrics-server 与 Kubelet API 提供的监控数据相同。

2.4 node_memory_working_set_bytes 指标有什么不同

  • top 使用的是 node_memory_working_set_bytes,是 Kubelet 提供的指标

包括当前正在使用的内存,活跃的缓存,不包括可以被立即回收的缓存、缓冲区,主要是非活跃的文件缓存,其数据来源于 /sys/fs/cgroup

  • Grafana 使用的是 node_memory_MemTotal_bytes - node_memory_MemAvailable_bytes,是 Node Exporter 提供的指标

包括当前正在使用的内存,但不包括缓存,其数据来源于 /proc/meminfo

前面可以看到 top 看到的内存使用量大约为 130 Gi,而 Grafana 看到的内存使用量大约是 77 Gi,相差 53 Gi 内存存储的就是一些不能立即被回收的缓存。但由于这两种方式的数据源不同,无法对 53 Gi 进行更详细的分析。

2.5 Kubelet limit 使用的是 container_memory_working_set_bytes

对于 Pod 来说,通过 top 和 Grafana 看到的内存使用量可能是相同的,因为,大部分 Grafana 面板绘制 Pod 内存使用量用的是 container_memory_working_set_bytes,这与 top 的计算方式是一致的。

这里需要重点关注的是 Kubelet 会以哪个指标驱逐 Pod? 答案是,container_memory_working_set_bytes

container_memory_working_set_bytes 更能代表容器的真实内存使用量。

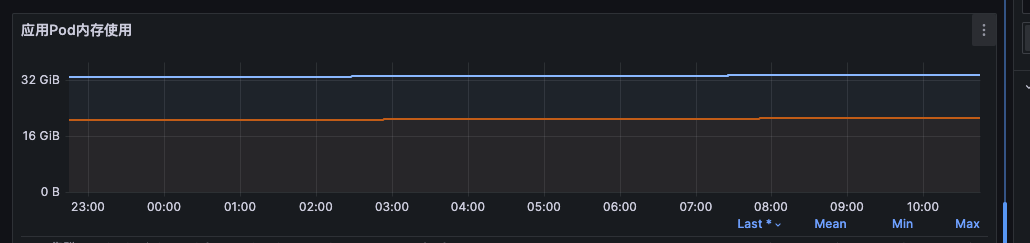
下面这张图体现的是 container_memory_working_set_bytes (大约 18GiB) 与 container_memory_usage_bytes (大约 33GiB) 的区别。
3. 总结

本文采集数据的主机内核版本为 5.4.0-48-generic,主要内容如下:

  • 因为 Kubelet 预留资源,top node 资源使用率可能超过 100%,使用 --show-capacity 可以看到总的资源使用情况
  • 常用的节点资源使用率 (node_memory_MemTotal_bytes - node_memory_MemAvailable_bytes)/ node_memory_MemTotal_bytes ,因为忽略了活跃的缓存资源,所以使用率会比 top node 看到的低一些。在上面例子中,Grafana 展示的是 15% 使用率,top node 展示的是 28%。
  • Kubelet 对 Pod 驱逐使用的是 container_memory_working_set_bytes,与 top pod 看到的内存使用量相同

微信公众号