惯性聚合 高效追踪和阅读你感兴趣的博客、新闻、科技资讯
阅读原文 在惯性聚合中打开

推荐订阅源

F
Fortinet All Blogs
云风的 BLOG
云风的 BLOG
M
MIT News - Artificial intelligence
WordPress大学
WordPress大学
T
Tailwind CSS Blog
钛媒体:引领未来商业与生活新知
钛媒体:引领未来商业与生活新知
S
Secure Thoughts
博客园 - 【当耐特】
Know Your Adversary
Know Your Adversary
NISL@THU
NISL@THU
博客园 - 司徒正美
Last Week in AI
Last Week in AI
C
Cybersecurity and Infrastructure Security Agency CISA
P
Privacy & Cybersecurity Law Blog
C
CXSECURITY Database RSS Feed - CXSecurity.com
B
Blog
The GitHub Blog
The GitHub Blog
小众软件
小众软件
freeCodeCamp Programming Tutorials: Python, JavaScript, Git & More
Spread Privacy
Spread Privacy
Martin Fowler
Martin Fowler
博客园 - 叶小钗
Security Archives - TechRepublic
T
Tenable Blog
S
Securelist
博客园 - 三生石上(FineUI控件)
Threat Intelligence Blog | Flashpoint
Microsoft Security Blog
Apple Machine Learning Research
罗磊的独立博客
T
Threat Research - Cisco Blogs
Application and Cybersecurity Blog
F
Full Disclosure
Cloudbric
Cloudbric
The Cloudflare Blog
Y
Y Combinator Blog
Hugging Face - Blog
Hugging Face - Blog
Microsoft Azure Blog
H
Hacker News: Front Page
腾讯CDC
L
Lohrmann on Cybersecurity
C
CERT Recently Published Vulnerability Notes
V2EX - 技术
V2EX - 技术
GbyAI
GbyAI
TaoSecurity Blog
TaoSecurity Blog
I
Intezer
The Last Watchdog
The Last Watchdog
G
GRAHAM CLULEY
Google Online Security Blog
T
The Blog of Author Tim Ferriss

陈少文的网站

巨变与机遇的未来十年 Kubernetes 平台管理软件压力测试方案 使用镜像部署 Hexo 静态页面 终于等到你 - GitHub 镜像仓库服务(ghcr.io) 一起来学 Go --(6)Interface 一起来学 Go --(5)Goroutine 和 Channel 什么是函数式编程 如何在 Kubernetes 集群集成 Kata 柯里化与偏函数 使用 PyGithub 自动创建 Label 软件产品是团队能力的输出 Helm 2 、Helm 3 比较 IoT 变现 Kubernetes 中的 DNS 服务 国内的 Helm 镜像源 Harbor 使用自签证书支持 Https 访问 DevOps 工具链之 Prow 如何使用 kfctl 安装 Kubeflow VS Code 无法下载 Go 插件的工具包 工程师更应具有服务精神 你不知道的 Docker 使用技巧 使用 Docker 运行 Tensorflow 论中国 什么是左移 如何清空 Git 仓库全部历史记录 一禅小和尚 有风吹过厨房 时间的玫瑰 如何在 CentOS 安装 GPU 驱动 开发 Tips(19) 使用 Velero 备份 Kubernetes 集群 Kubernetes Cheat Sheet 开发 Tips(18) 如何构建一个 Java 工程 开发 Tips(17) KubeSpray 安装 Kubernetes 报错 ip in ansible_all_ipv4_addresses 基于 Kubernetes 和 Jenkins 搭建自动化测试系统 在 Kubernetes 上动态创建 Jenkins Slave 使用 Jenkins 进行服务拨测 开发 Tips(16) Kubernetes 签发 Ingress 证书及日常故障运维 Kubernetes 中 Deployment 的基本操作 Kubernetes 中的证书 如何使用 KubeBuilder 开发一个 Operator Kubernetes 1.6.0 安装问题汇总 镜像管理工具 -- Harbor 开发 Tips(15) Docker 如何拉取镜像 开发 Tips(14) 使用 Helm 安装 harbor 开发 Tips(13) 使用 S2I 构建云原生应用 在 Kubernetes 中使用 emptyDir、hostPath、localVolume 开发 Tips(12) 开发 Tips(11) 代码质量分析工具 SonarQube 使用 Kubeadm 安装 Kubernetes 集群 一起来学 Go --(4)常用函数 Kubernetes 中的 Ceph Kubernetes 之 Volumes Kubernetes 之 Labels、Selectors 开发 Tips(10) 开源正在重构商业模式 Kubernetes 之网络 Kubernetes 之 API 使用 Helm 和 Operator 快速部署 Prometheus Kubernetes 复杂有状态应用管理框架 -- Operator Kubernetes 的包管理器 -- Helm 一起来学 Go --(3)Go Modules 如何一步一步地优化博客方案 kubectl 实用指南 Kubernetes 中的基本概念 搭建远程 Kubernetes 开发环境 大公司和小公司的 ToB 思路 开发 Tips(9) Go 入门指南 一起来学 Go --(2)数据与逻辑结构 如何预防 Web 富文本中的 XSS 攻击 django-xss-cleaner 云工作时代 一起来学 Go --(1)背景与特点 SaaS 开发团队的不同阶段 你不知道的 Git 使用技巧 输出既服务 微服务设计 继续奔跑 开发 Tips(8) 从账户安全到二次验证 Django 性能之数据库查询优化 Django 性能之分库分表 敏捷开发之研发流程 打造一致性的团队 开发 Tips(7) Pytest 进阶学习之 Mock PaaS 部署之 buildpack Go 开发配置 领域输出才是 PaaS 的核心竞争力 Pytest 入门学习 开发 Tips(6) 如何使用 Jenkins、Docker、GitLab 搭建 Django 自动化部署流程
使用 Thanos 集中管理多 Prometheus 实例数据
微信公众号 · 2022-03-22 · via 陈少文的网站

1. 监控的分层

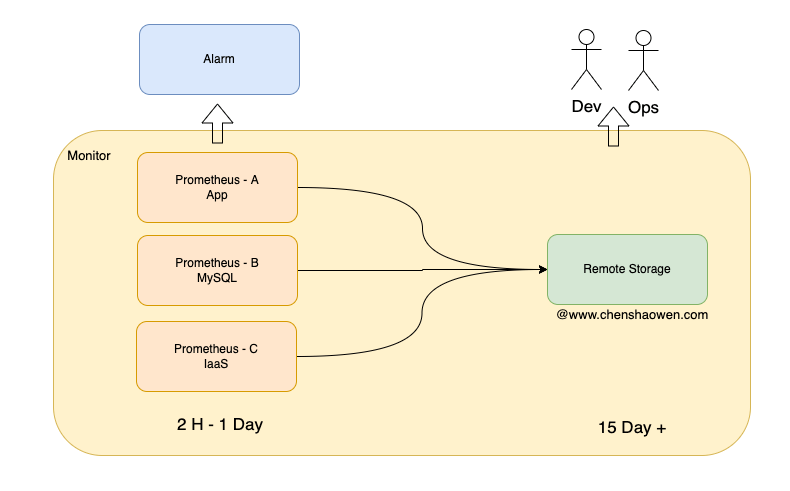
如上图,在建设监控系统时,会采用两种策略:

  1. 分层监控。IaaS、MySQL 中间件、App 层监控分开的好处是,系统之间具有高可用性、容错性。当 App 层监控无法工作时,IaaS 层监控立马就会体现出来。
  2. 长短期指标分离。短期指标用来提供给告警系统高频查询近期数据,长期指标用来提供给人查询时间跨度更大的数据集。

这里将其统称为监控的分层策略,只不过一个是以基础设施维度的分层,一个是以时间维度的分层。

2. 现状与选型

目前的状况是: 没有进行监控的长短期分层,共用一套 Prometheus。查询长周期指标时,Prometheus 所在服务器内存、CPU 使用率飙升,甚至导致监控、告警服务不可用。

原因在于两点:

  • 查询长周期数据时,Prometheus 会将大量数据载入内存
  • Prometheus 载入的不是降采样数据

查询的范围越大,需要的内存就越多。在另外一个生产的方案中,我们采用 VictoriaMetrics 单机版作为远端存储,部署的内存高达 128 GB 。同时,这种方式下还存在丢数据的情况,排查很久之后,才通过参数 honor_timestamps: false 解决。

而 Prometheus Federation 的方式,只是解决了将多个 Prometheus 聚合起来,并没有提供抽样的能力,不能加快长期指标的查询,不适用于当前远端存储的场景。

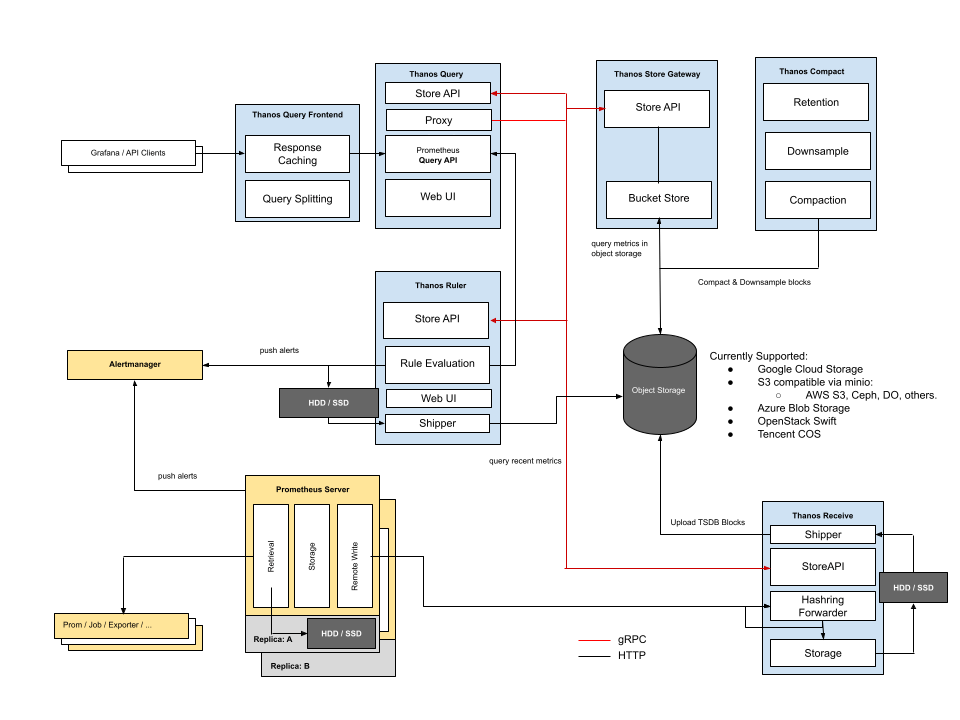
最后看到 Thanos Compact 组件能够对指标数据进行压缩和降采样,决定尝试使用 Thanos 作为目前多个 Prometheus 远端存储使用。

3. Thanos 的几种部署方式

3.1 基础组件

  • Query, 实现了 Prometheus API,对外提供与 Prometheus 一致的查询接口
  • Sidecar, 用于连接 Prometheus,提供 Query 查询接口、也可以上报数据
  • Store Gateway, 访问放在对象存储的指标数据
  • Compact, 压缩采样、清理对象存储中的数据
  • Receive, 接收 Prometheus Remote Write 的数据
  • Ruler, 配置和管理告警规则

3.2 Receive 模式

Receive 模式下,需要在每一个 Prometheus 实例中配置 remote write 将数据上传给 Thanos。此时,由于实时数据全部都存储到了 Thanos Receiver,因此不需要 Sidecar 组件即可完成查询。

优势:

  • 数据集中
  • Prometheus 无状态
  • 只需要暴露 Receiver 给 Prometheus 访问

缺点:

  • Receiver 承受大量 Prometheus 的 remote write 写入

3.3 Sidecar 模式
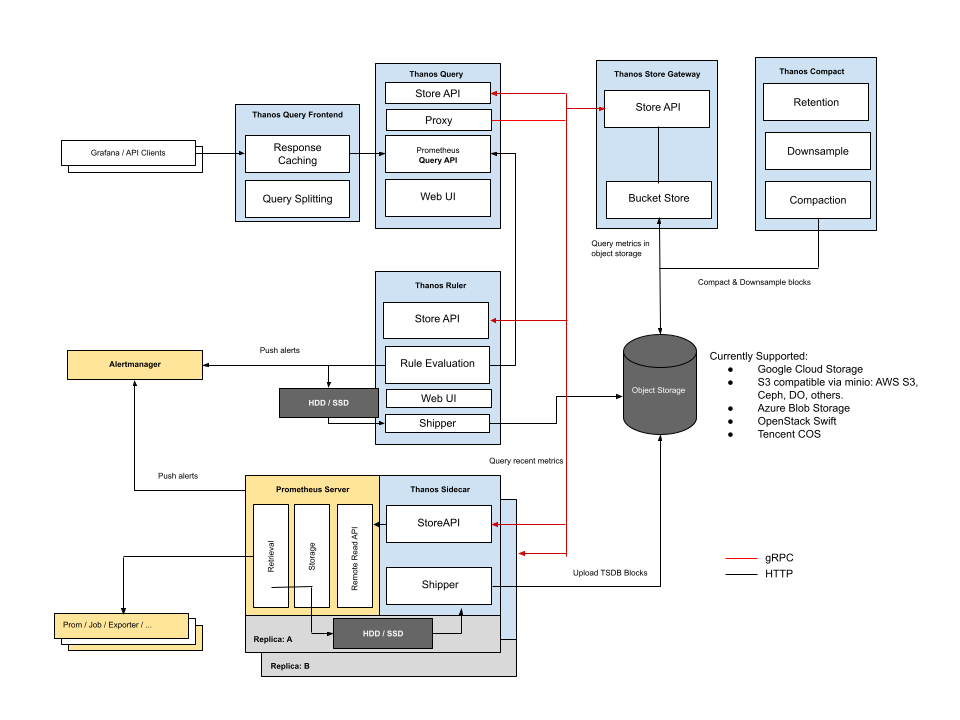
Sidecar 模式下,在每一个 Prometheus 实例旁添加一个 Thanos Sidecar 组件,以此来实现对 Prometheus 的管理。主要有两个功能:

  • 接受 Query 组件的查询请求。在 Thanos 查询短期数据时,请求会转到 Sidecar。
  • 上传 Prometheus 的短期指标数据。默认每两个小时,创建一个块,上传到对象存储。

优势:

  • 集成容易,不需要修改原有配置

缺点:

  • 近期数据需要 Query 与 Sidecar 之间网络请求完成,会增加额外耗时
  • 需要 Store Gateway 能访问每个 Prometheus 实例

4. 部署 Thanos

4.1 部署一个 Minio

请参考文档: Jenkins 中的构建产物与缓存

安装完成之后,请根据文档中的配置进行测试,确保 Minio 服务正常工作。

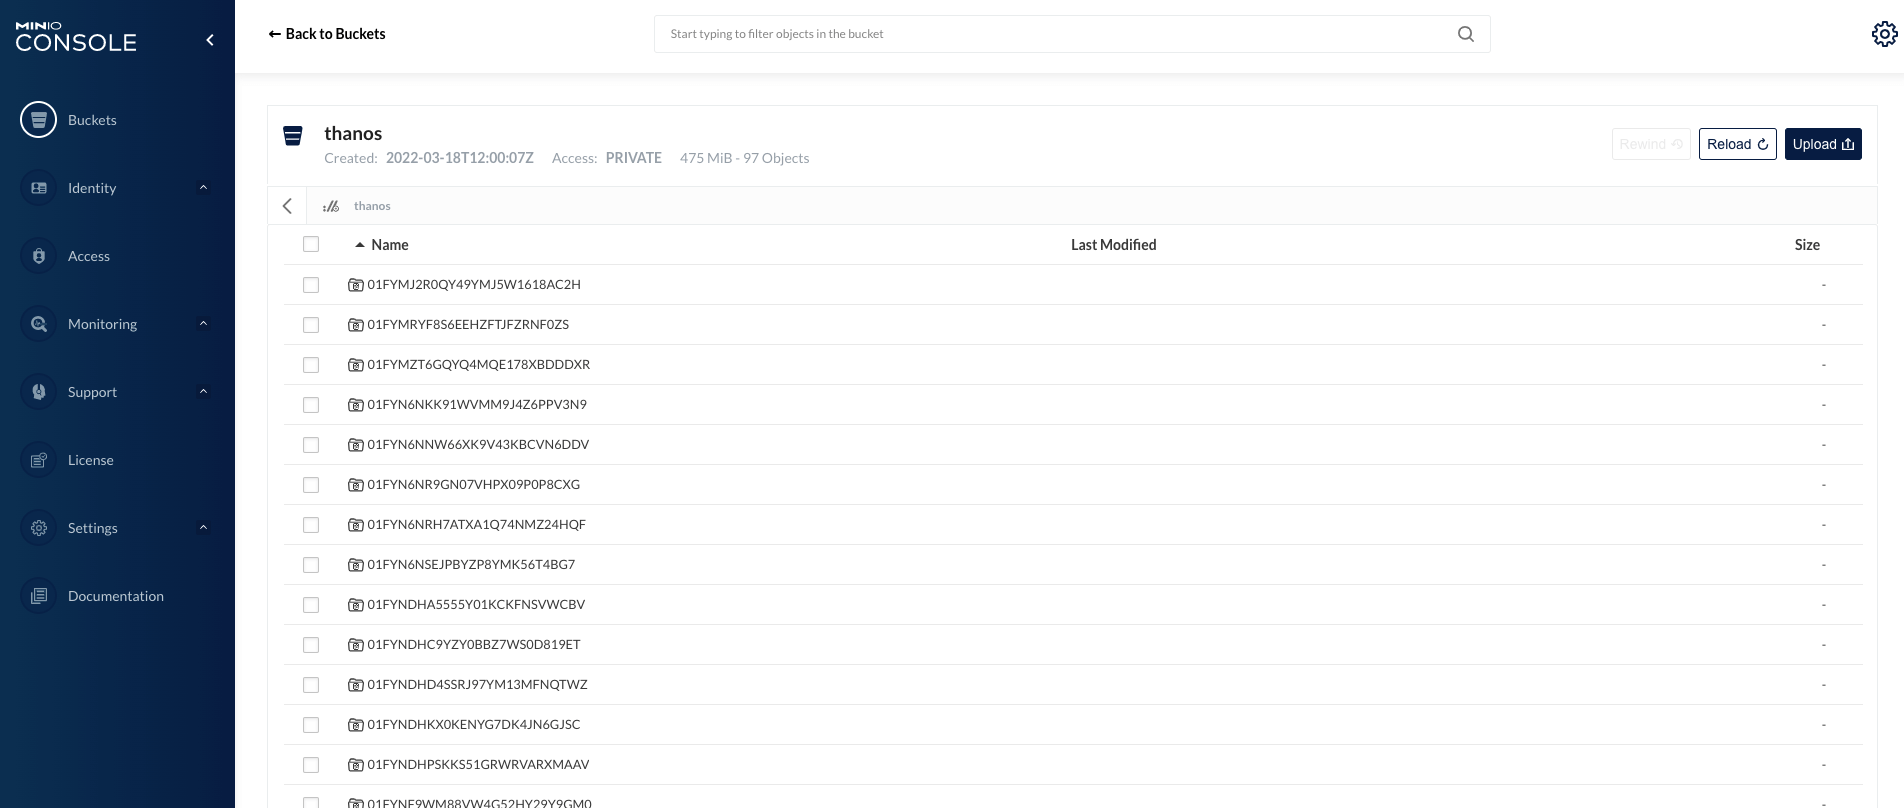
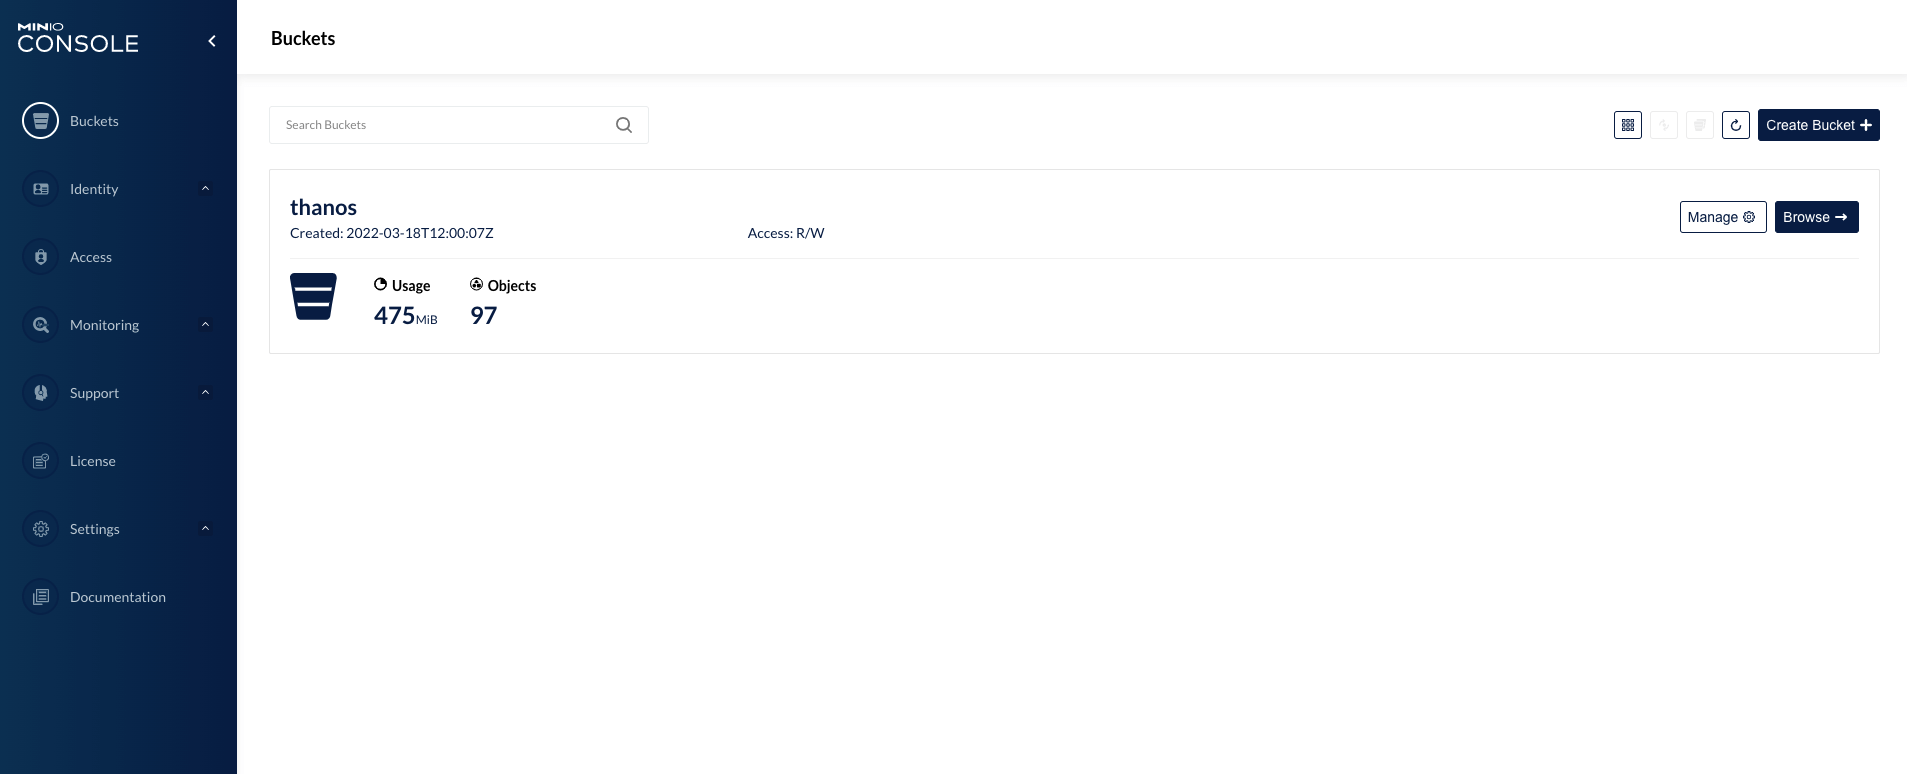
4.2 在 Minio 上创建一个名为 thanos 的 Bucket

如下图:
4.3 检查 Prometheus 版本符合 Thanos 要求

目前 Thanos 要求 Prometheus 版本最好不低于 v2.13。

4.4 部署 Thanos

  • 确保 Kubernetes 集群上有默认的存储可用
1
2
3
4
5
kubectl get sc

NAME                         PROVISIONER        RECLAIMPOLICY   VOLUMEBINDINGMODE      ALLOWVOLUMEEXPANSION   AGE
openebs-device               openebs.io/local   Delete          WaitForFirstConsumer   false                  4d5h
openebs-hostpath (default)   openebs.io/local   Delete          WaitForFirstConsumer   false                  4d5h
  • 新建一个命名空间 thanos
1
kubectl create ns thanos
  • 部署 Thanos
1
git clone https://github.com/shaowenchen/demo

修改 demo/objectstorage.yaml 文件中的 Minio 访问地址。然后创建 Thanos 相关负载:

1
kubectl apply -f ./demo/thanos-0.25/
  • 查看相关负载
1
2
3
4
5
6
7
8
kubectl -n thanos top pod

NAME                           CPU(cores)   MEMORY(bytes)
thanos-compact-0               1m           30Mi
thanos-query-7c745f5d7-svlgn   2m           76Mi
thanos-receive-0               1m           15Mi
thanos-rule-0                  1m           18Mi
thanos-store-0                 1m           55Mi

部署 Thanos 消耗的资源很少。

4.5 访问 Thanos Query

  • 查看 Thanos 相关服务的端口
1
2
3
4
5
6
7
8
kubectl -n thanos get svc

NAME             TYPE        CLUSTER-IP      EXTERNAL-IP   PORT(S)                           AGE
thanos-compact   ClusterIP   10.233.47.253   <none>        10902/TCP                         11h
thanos-query     NodePort    10.233.45.138   <none>        10901:32180/TCP,9090:32612/TCP    11h
thanos-receive   ClusterIP   None            <none>        10902/TCP,19291/TCP,10901/TCP     11h
thanos-rule      ClusterIP   None            <none>        10901/TCP,10902/TCP               11h
thanos-store     NodePort    10.233.41.159   <none>        10901:30901/TCP,10902:31426/TCP   10h
  • 访问 Thanos Query 页面

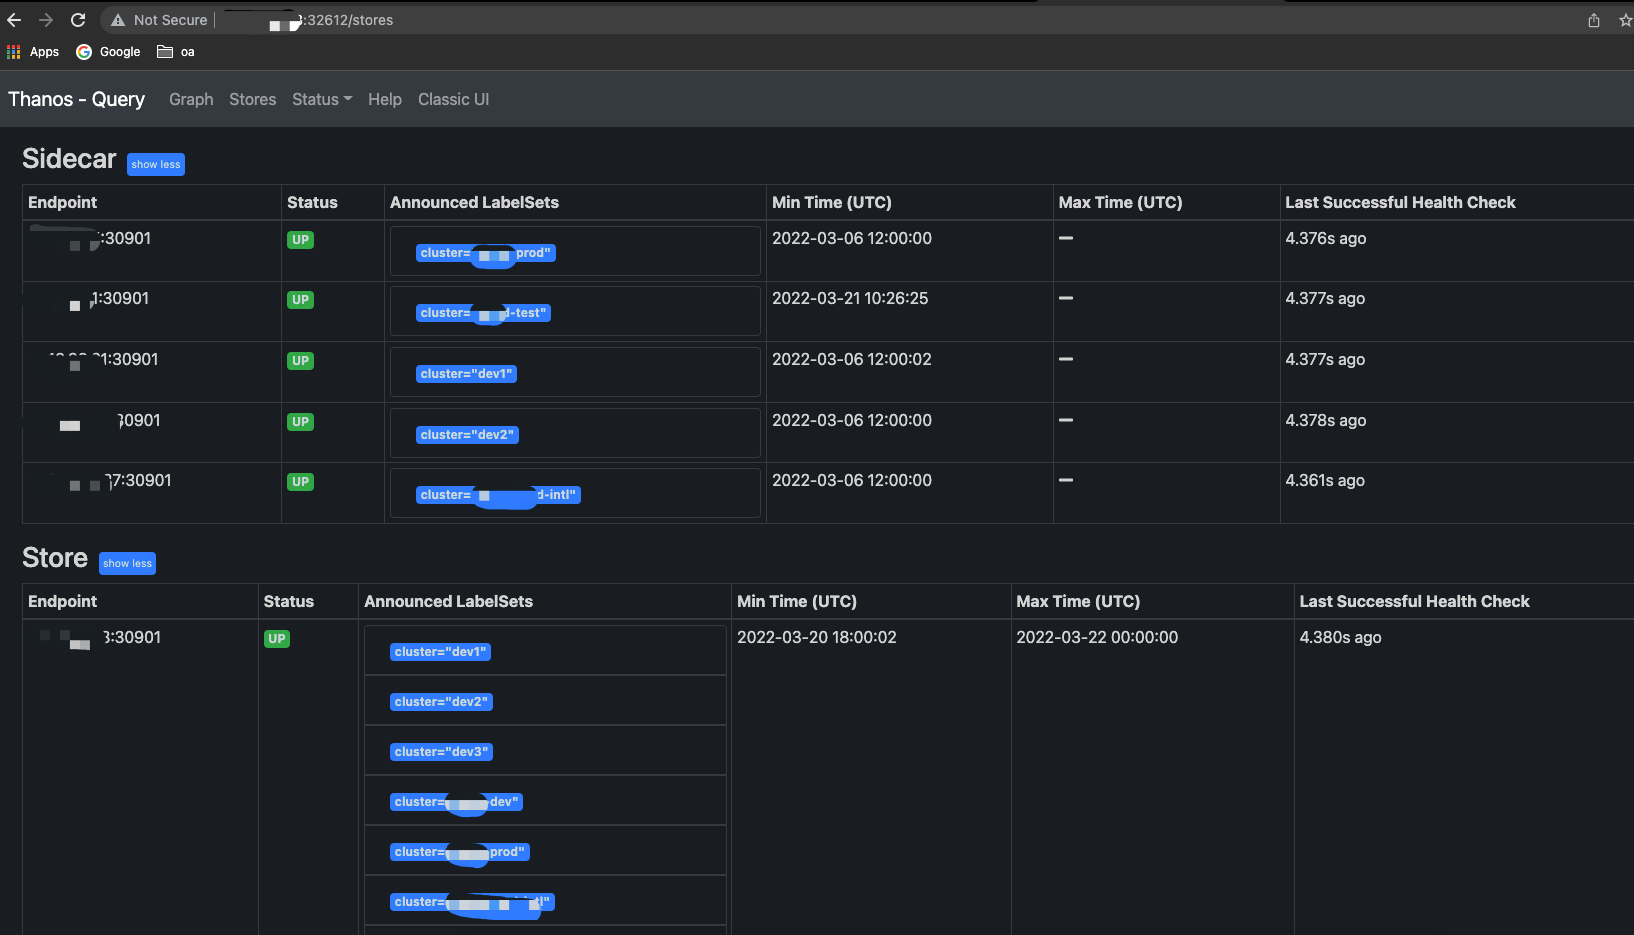
thanos-query 在 9090 端口提供 http 访问入口,因此这里通过主机 IP:32612 端口访问 Query 组件提供的页面。
5. 给 Prometheus 添加 Thanos Sidecar

Sidecar 模式对 Thanos 配置要求更低,而 Receiver 模式需要不停地接受来自众多 Prometheus 的 Remote Write,这里出于成本考虑选择 Sidecar 模式。

5.1 在 Prometheus 所在命名空间新增 S3 访问凭证

 1
 2
 3
 4
 5
 6
 7
 8
 9
10
11
12
13
14
15
16
17
cat <<EOF | kubectl apply -f -
apiVersion: v1
kind: Secret
metadata:
  name: thanos-objectstorage
  namespace: monitor
type: Opaque
stringData:
  objectstorage.yaml: |
    type: S3
    config:
        bucket: "thanos"
        endpoint: "0.0.0.0:9000"
        insecure: true
        access_key: "minioadmin"
        secret_key: "minioadmin"
EOF

这里直接使用的是管理员账户,如果是生产上,应该单独创建一个账户用于 Thanos 对 Minio 的使用。

5.2 给 Prometheus 添加额外的 Label 标记实例

通过在 Prometheus 中添加 external_labels 可以给每个 Prometheus 实例全局添加一个额外的标签,用于唯一标记一个实例。

  • 编辑配置文件
1
kubectl -n monitor edit cm prometheus-server
  • 添加如下内容
1
2
3
4
prometheus.yml: |
  global:
    external_labels:
      cluster: dev  

这里添加了一个名为 cluster=dev 的标签。所有该 Prometheus 实例上报的指标都会带上此标签,方便查询过滤。

5.3 修改 Prometheus 启动参数关闭压缩

  • 编辑 Prometheus 部署文件

有的是用 Deployment,有的是用 StatefulSet 部署,都需要修改 Prometheus 的启动参数

1
kubectl -n monitor edit deploy prometheus-server
  • 修改 tsdb 存储块最大、最小值相等
1
2
3
4
5
        - --web.enable-admin-api
        - --web.enable-lifecycle
        - --storage.tsdb.max-block-duration=2h
        - --storage.tsdb.min-block-duration=2h
        image: quay.io/prometheus/prometheus:v2.31.1

storage.tsdb.min-block-durationstorage.tsdb.max-block-duration 相等,才能保障 Prometheus 关闭了本地压缩,避免压缩时,Thanos 上传失败。

5.4 给 Prometheus 添加 Thanos Sidecar

  • 编辑 Prometheus 部署文件
1
kubectl -n monitor edit deploy prometheus-server
  • 新增如下容器
 1
 2
 3
 4
 5
 6
 7
 8
 9
10
11
12
13
14
15
16
17
18
19
20
21
22
23
24
25
26
27
28
29
30
31
32
- args:
    - sidecar
    - --log.level=debug
    - --tsdb.path=/data
    - --prometheus.url=http://127.0.0.1:9090
    - --objstore.config-file=/etc/objectstorage.yaml
  name: thanos-sidecar
  image: thanosio/thanos:v0.25.0
  env:
    - name: POD_NAME
      valueFrom:
        fieldRef:
          fieldPath: metadata.name
  ports:
    - name: http-sidecar
      containerPort: 10902
    - name: grpc
      containerPort: 10901
  livenessProbe:
    httpGet:
      port: 10902
      path: /-/healthy
  readinessProbe:
    httpGet:
      port: 10902
      path: /-/ready
  volumeMounts:
    - mountPath: /data
      name: storage-volume
    - name: thanos-objectstorage
      subPath: objectstorage.yaml
      mountPath: /etc/objectstorage.yaml
  • 新增挂载秘钥
1
2
3
- name: thanos-objectstorage
  secret:
    secretName: thanos-objectstorage
  • 重启 Prometheus

滚动升级会遇到如下错误,因为上一个 Prometheus Pod 没有释放文件目录导致。

1
ts=2022-03-21T04:06:39.267Z caller=main.go:932 level=error err="opening storage failed: lock DB directory: resource temporarily unavailable"

因此需要先将副本数设置为 0,在将其设置为 1,重启 Prometheus。

1
2
kubectl -n monitor scale deploy prometheus-server --replicas=0
kubectl -n monitor scale deploy prometheus-server --replicas=1

5.5 在 Prometheus Sidecar 添加 Grpc 远程访问端口

  • 编辑 Prometheus Service 配置
1
kubectl -n monitor edit svc prometheus-server
  • 新增一个 Service 端口暴露 Grpc 服务给 Thanos Store Gateway
1
2
3
4
5
6
7
ports:
  - name: sidecar-grpc
    nodePort: 30901
    port: 10901
    protocol: TCP
    targetPort: 10901
type: NodePort

5.6 在 Thanos Query 添加 Store Grpc 地址

最后还需要在 Thanos Store Gateway 中添加上面 Prometheus Sidecar 的 Grpc 地址。

  • 编辑 Thanos Query
1
kubectl -n thanos edit deploy thanos-query
  • 在启动参数中添加 --store=0.0.0.0:30901
 1
 2
 3
 4
 5
 6
 7
 8
 9
10
11
- args:
    - query
    - --log.level=debug
    - --query.auto-downsampling
    - --grpc-address=0.0.0.0:10901
    - --http-address=0.0.0.0:9090
    - --query.partial-response
    - --query.replica-label=prometheus_replica
    - --query.replica-label=rule_replica
    - --store=0.0.0.0:30901
  image: thanosio/thanos:v0.25.0

这里的 0.0.0.0:30901 需要替换为上面 Prometheus Sidecar 暴露的 Grpc 访问入口。这样,Thanos Query 提供查询能力时,短期数据就会调用 Grpc 查询,而不是查询对象存储中的数据。

此时,在上面提到 Thanos Query 页面以及可以看到新增的 0.0.0.0:30901 这个 Endpoint 记录,状态应该是 Up

5.7 在 Minio 中查看同步的数据

一共添加了 6 个集群,每个集群大约 40 个 Pod,半天时间大约用了 2.1 GB 存储、303 个对象。

6. Grafana 配置

6.1 添加数据源

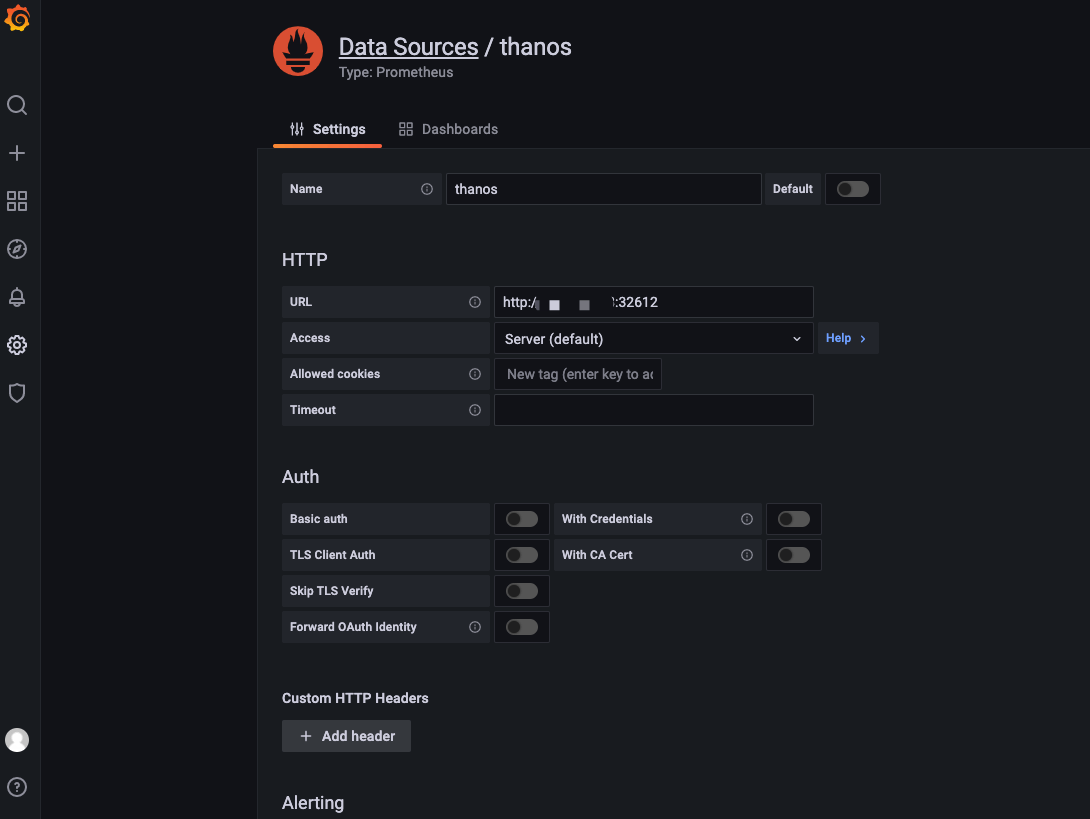
在 Grafana 添加 Thanos Query 数据源的方式和添加 Prometheus 一样。如下图:
6.2 修改 Grafana 面板适配 cluster 标签过滤

这里在基于 Kubernetes 集群查看的面板,稍微进行修改。

  • 添加 cluster 过滤的变量

在上面,我在每一个 Prometheus 中都添加了一个全局的 external_labels,通过 cluster 字段来区分不同的集群。
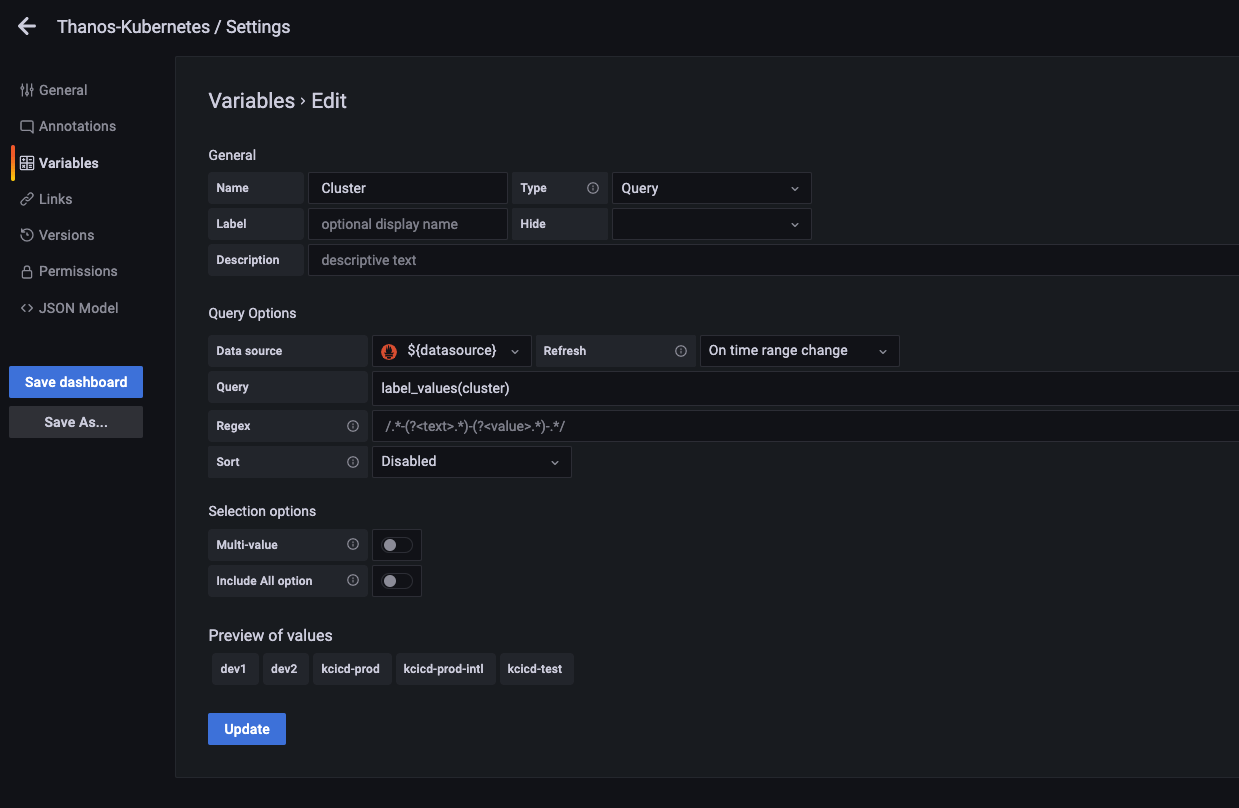
如上图,在面板中添加一个 Cluster 变量,使用指标中的 cluster 标签进行过滤。

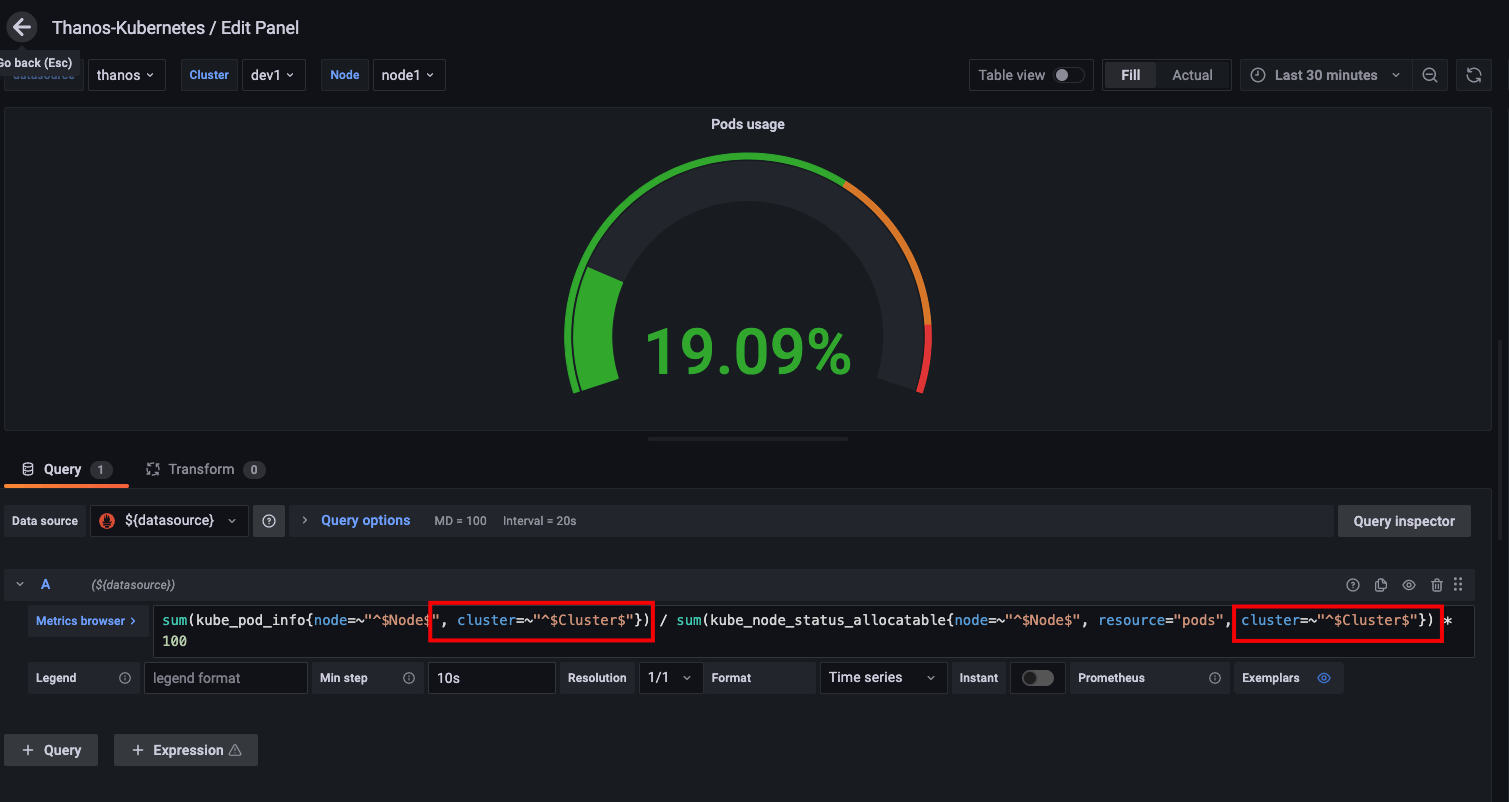
  • 编辑每个视图的过滤查询条件

如上图,需要在每个视图的表达式中增加一个额外的过滤条件,cluster=~"^$Cluster$"}。当然,也可以将面板导出,在编辑器中批量修改之后再导入 Grafana。

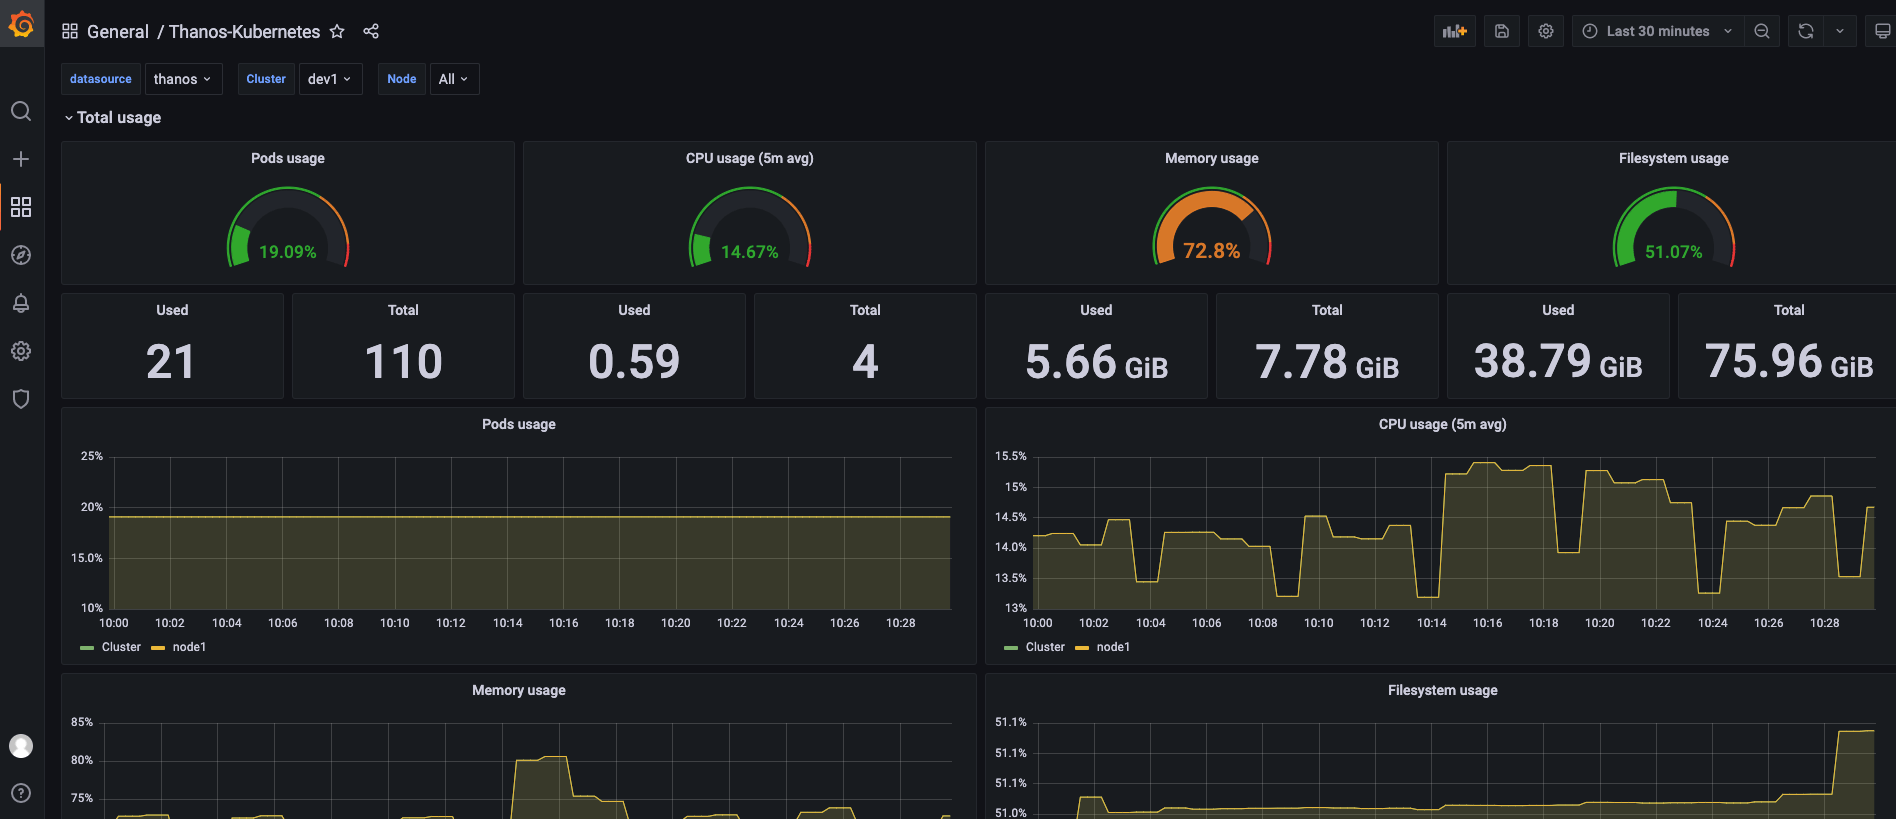
6.3 查看 Thanos 和 Prometheus 数据源

  • 使用 Thanos 数据源

  • 使用 Prometheus 数据源

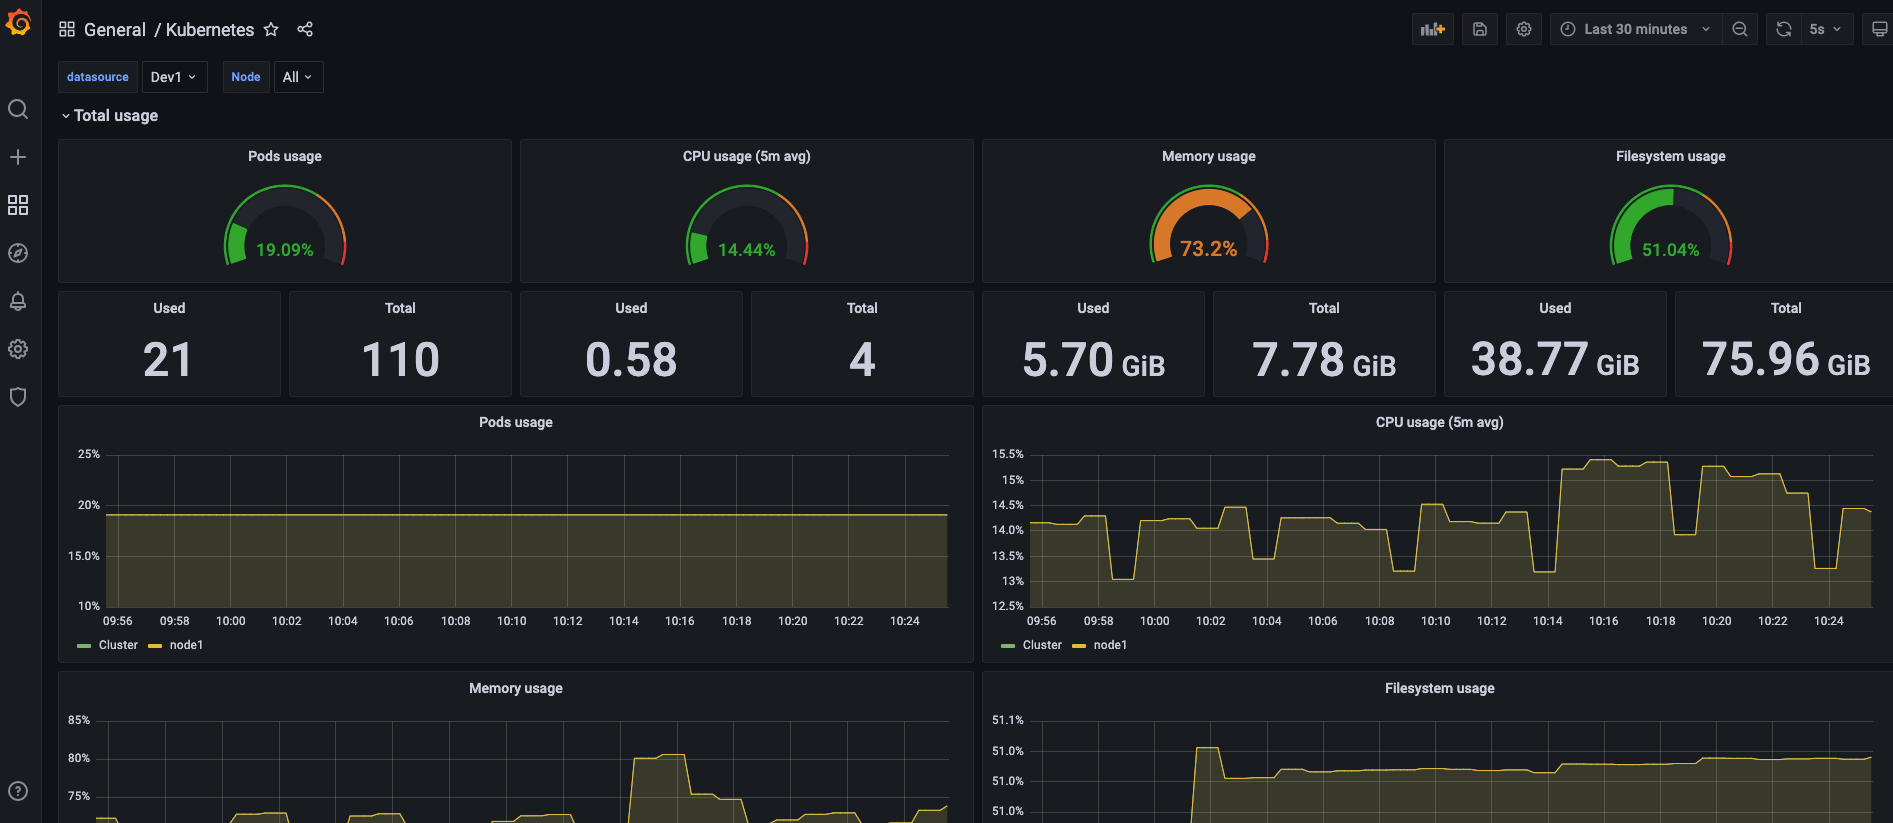
对比两个面板的数据,可以发现他们展示的指标一致。因此,我们可以使用一个 Thanos 数据源替代多个 Prometheus 数据源分散管理的场景。

这里数据的时间尺度没有达到 Thanos Compact 组件的参数设置,因此没有体现出降采样的效果。

7. 总结

本篇主要是阐述了监控数据层管理的一些想法。

首先是数据要分层,短期数据直接存储在就近的 Prometheus,长期数据存储在 Thanos 的对象存储中。短期数据提供给告警系统的高频查询,长期数据提供给人用于分析。

选择 Thanos 的主要原因是其降采样。Thanos compact 组件提供了 5 分钟、1 小时的降采样,以 Prometheus 每 15s 采样频率计算,压缩将达到 20 倍、240 倍,能够大大缓解长周期查询压力。采用 Sidecar 模式时,短期的数据会通过 Grpc 调用 Prometheus 的 API 查询。

最后当然是将本地用的 6 个集群都接入了 Thanos。只有亲自尝试过之后,才会真切地体会到其中的一些细节和处理逻辑。虽然架构图、文档、博客看了不少,但是都不如自己亲自尝试一次。

8. 参考