1. smokeping-prober 是什么
smokeping-prober 是一个用于探测网络质量的工具,它通过向目标节点发送 ICMP 请求来探测网络质量。
2. 部署 smokeping-prober
2.1 生成 smokeping-prober.yaml 配置文件
 1
 2
 3
 4
 5
 6
 7
 8
 9
10
11
| cat > smokeping_prober.yaml <<EOF
---
targets:
- hosts:
- 1.2.3.4
interval: 1s # Duration, Default 1s.
network: ip # One of ip, ip4, ip6. Default: ip (automatic IPv4/IPv6)
protocol: icmp # One of icmp, udp. Default: icmp (Requires privileged operation)
size: 56 # Packet data size in bytes. Default 56 (Range: 24 - 65535)
tos: 0x00 # Packet ToS field in decimal, hexadecimal or binary format. Default: 0 (Range: 0-255)
EOF
|
2.2 启动 smokeping-prober
1
2
3
4
5
6
7
8
| nerdctl run -d \
--name smokeping_prober \
--restart always \
-v `pwd`/smokeping_prober.yaml:/etc/smokeping_prober.yml \
-p 9374:9374 \
--privileged \
quay.io/superq/smokeping-prober:v0.9.0 \
--config.file=/etc/smokeping_prober.yml
|
1
| nerdctl rm -f smokeping_prober
|
1
| nerdctl logs smokeping_prober -f
|
1
| nerdctl restart smokeping_prober
|
2.3 部署 smokeping-prober 的 Endpoints
 1
 2
 3
 4
 5
 6
 7
 8
 9
10
11
12
13
14
15
16
17
18
19
20
21
22
23
24
25
26
27
| kubectl apply -f - <<EOF
apiVersion: v1
kind: Service
metadata:
name: smokeping-service
namespace: default
labels:
app: smokeping
spec:
ports:
- name: metrics
port: 9374
protocol: TCP
---
apiVersion: v1
kind: Endpoints
metadata:
name: smokeping-service
namespace: default
subsets:
- addresses:
- ip: 1.2.3.4
ports:
- name: metrics
port: 9374
protocol: TCP
EOF
|
2.4 部署 smokeping-prober 的 ServiceMonitor
 1
 2
 3
 4
 5
 6
 7
 8
 9
10
11
12
13
14
15
16
17
18
19
20
21
22
23
24
25
26
27
28
29
30
31
| kubectl apply -f - <<EOF
apiVersion: monitoring.coreos.com/v1
kind: ServiceMonitor
metadata:
name: smokeping-monitor
namespace: monitoring
labels:
tier: ai
spec:
endpoints:
- interval: 1s
port: metrics
path: /metrics
scheme: http
honorLabels: true
relabelings:
- action: replace
sourceLabels: [__address__]
targetLabel: node
regex: (.*):.*
replacement: $1
- action: replace
replacement: smokeping
targetLabel: role
selector:
matchLabels:
app: smokeping
namespaceSelector:
matchNames:
- default
EOF
|
3. 查看 smokeping-prober 的指标
导入面板 https://grafana.com/grafana/dashboards/11335-smoke-ping/
可以查看网络质量的指标,如丢包率、延迟等。
可以看到类似这样的面板
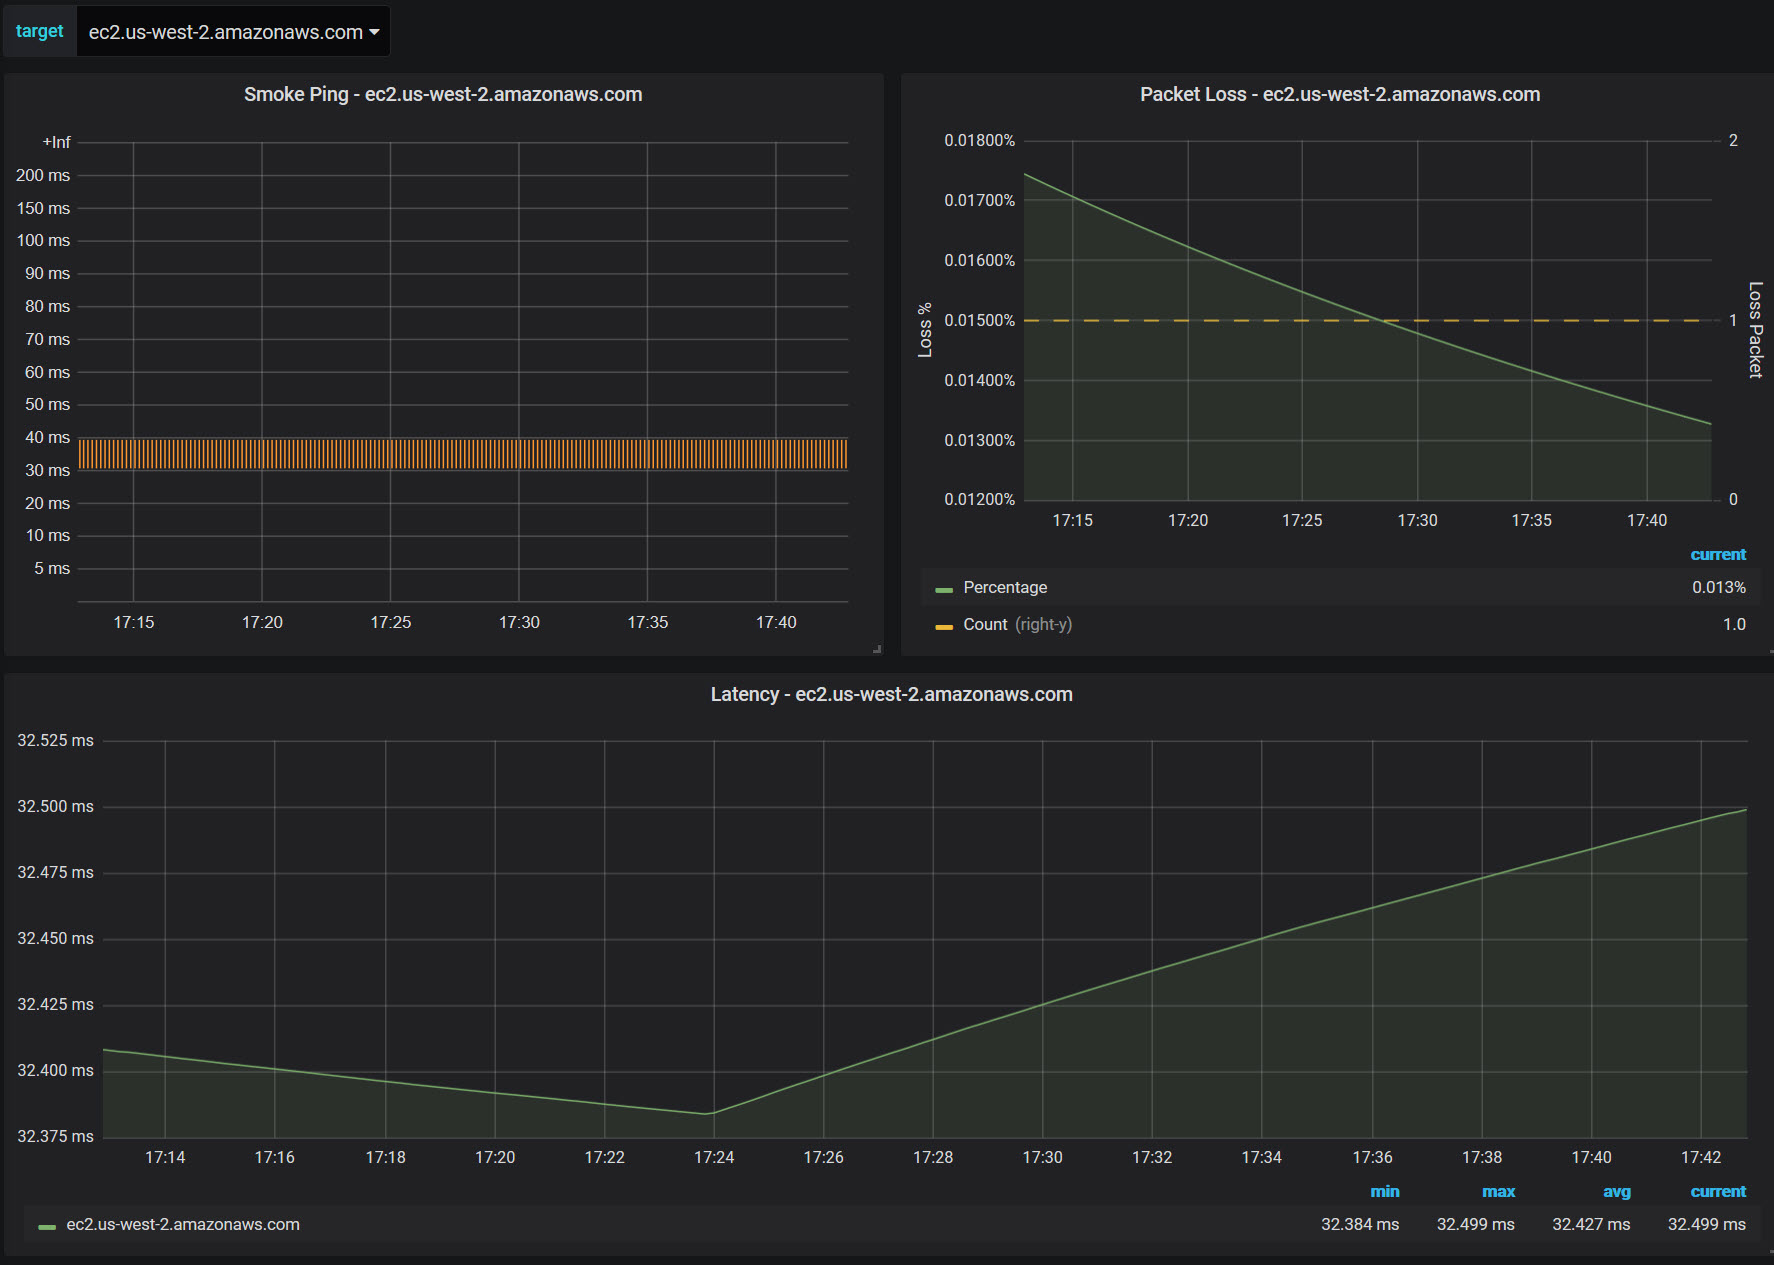
面板中显示的指标时丢包数量,如果要查看丢包率,可以添加一个计算指标,计算公式为:
1
2
3
| (rate(smokeping_requests_total{host="$target"}[30s]) - rate(smokeping_response_duration_seconds_count{host="$target"}[5m]))
/
rate(smokeping_requests_total{host="$target"}[30s]) / 100
|








