惯性聚合 高效追踪和阅读你感兴趣的博客、新闻、科技资讯
阅读原文 在惯性聚合中打开

推荐订阅源

L
LINUX DO - 最新话题
A
Arctic Wolf
I
Intezer
V
Vulnerabilities – Threatpost
C
Cisco Blogs
MyScale Blog
MyScale Blog
NISL@THU
NISL@THU
Y
Y Combinator Blog
C
CERT Recently Published Vulnerability Notes
P
Privacy International News Feed
H
Hackread – Cybersecurity News, Data Breaches, AI and More
酷 壳 – CoolShell
酷 壳 – CoolShell
Recorded Future
Recorded Future
云风的 BLOG
云风的 BLOG
S
SegmentFault 最新的问题
Microsoft Security Blog
L
LangChain Blog
博客园 - 聂微东
博客园 - 叶小钗
F
Fortinet All Blogs
钛媒体:引领未来商业与生活新知
钛媒体:引领未来商业与生活新知
Recent Announcements
C
Cyber Attacks, Cyber Crime and Cyber Security
Latest news
Latest news
Simon Willison's Weblog
P
Palo Alto Networks Blog
S
Schneier on Security
C
Cybersecurity and Infrastructure Security Agency CISA
V
V2EX
freeCodeCamp Programming Tutorials: Python, JavaScript, Git & More
The Hacker News
The Hacker News
博客园 - 司徒正美
Threat Intelligence Blog | Flashpoint
L
LINUX DO - 热门话题
罗磊的独立博客
K
Kaspersky official blog
Last Week in AI
Last Week in AI
Know Your Adversary
Know Your Adversary
小众软件
小众软件
Stack Overflow Blog
Stack Overflow Blog
T
Threat Research - Cisco Blogs
D
DataBreaches.Net
Scott Helme
Scott Helme
P
Proofpoint News Feed
P
Privacy & Cybersecurity Law Blog
P
Proofpoint News Feed
博客园 - 三生石上(FineUI控件)
Hugging Face - Blog
Hugging Face - Blog
OSCHINA 社区最新新闻
OSCHINA 社区最新新闻
F
Full Disclosure

极客兔兔

Go sync.Cond | Go 语言高性能编程 Go 死码消除与调试(debug)模式 | Go 语言高性能编程 Go sync.Once | Go 语言高性能编程 Go 逃逸分析 | Go 语言高性能编程 2020 年终总结 | 极客兔兔 Go struct 内存对齐 | Go 语言高性能编程 Go 空结构体 struct{} 的使用 | Go 语言高性能编程 控制协程(goroutine)的并发数量 | Go 语言高性能编程 | 极客兔兔 如何退出协程 goroutine (其他场景) | Go 语言高性能编程 如何退出协程 goroutine (超时场景) | Go 语言高性能编程 Go 语言陷阱 - 数组和切片 | Go 语言高性能编程 减小 Go 代码编译后的二进制体积 | Go 语言高性能编程 Go Reflect 提高反射性能 | Go 语言高性能编程 读写锁和互斥锁的性能比较 | Go 语言高性能编程 | 极客兔兔 for 和 range 的性能比较 | Go 语言高性能编程 切片(slice)性能及陷阱 | Go 语言高性能编程 | 极客兔兔 字符串拼接性能及原理 | Go 语言高性能编程 | 极客兔兔 benchmark 基准测试 | Go 语言高性能编程 Go 语言高性能编程 | 极客兔兔 Go 接口型函数的使用场景 | 极客兔兔 Python 简明教程 | 快速入门 | 极客兔兔 Go 语言笔试面试题(代码输出) | 极客面试 | 极客兔兔 动手写RPC框架 - GeeRPC第七天 服务发现与注册中心(registry) | 极客兔兔 动手写RPC框架 - GeeRPC第六天 负载均衡(load balance) 动手写RPC框架 - GeeRPC第五天 支持HTTP协议 | 极客兔兔 动手写RPC框架 - GeeRPC第四天 超时处理(timeout) | 极客兔兔 动手写RPC框架 - GeeRPC第三天 服务注册(service register) 动手写RPC框架 - GeeRPC第二天 支持并发与异步的客户端 | 极客兔兔 动手写RPC框架 - GeeRPC第一天 服务端与消息编码 | 极客兔兔 7天用Go从零实现RPC框架GeeRPC | 极客兔兔 Go 语言笔试面试题(并发编程) | 极客面试 | 极客兔兔 Go 语言笔试面试题(基础语法) | 极客面试 | 极客兔兔 Go 语言笔试面试题汇总 | 极客面试 | 极客兔兔 Go Context 并发编程简明教程 | 快速入门 Go Mmap 文件内存映射简明教程 | 快速入门 动手写ORM框架 - GeeORM第七天 数据库迁移(Migrate) | 极客兔兔 动手写ORM框架 - GeeORM第六天 支持事务(Transaction) | 极客兔兔 动手写ORM框架 - GeeORM第五天 实现钩子(Hooks) | 极客兔兔 动手写ORM框架 - GeeORM第四天 链式操作与更新删除 | 极客兔兔 动手写ORM框架 - GeeORM第三天 记录新增和查询 | 极客兔兔 动手写ORM框架 - GeeORM第二天 对象表结构映射 | 极客兔兔 动手写ORM框架 - GeeORM第一天 database/sql 基础 SQLite 常用命令 | 速查表(Cheat Sheet) 7天用Go从零实现ORM框架GeeORM | 极客兔兔 动手写分布式缓存 - GeeCache第七天 使用 Protobuf 通信 动手写分布式缓存 - GeeCache第六天 防止缓存击穿 | 极客兔兔 动手写分布式缓存 - GeeCache第五天 分布式节点 | 极客兔兔 动手写分布式缓存 - GeeCache第四天 一致性哈希(hash) | 极客兔兔 Go Mock (gomock)简明教程 | 快速入门 动手写分布式缓存 - GeeCache第三天 HTTP 服务端 动手写分布式缓存 - GeeCache第二天 单机并发缓存 | 极客兔兔 Go Test 单元测试简明教程 | 快速入门 7天用Go从零实现分布式缓存GeeCache | 极客兔兔 Go WebAssembly (Wasm) 简明教程 | 快速入门 Go RPC & TLS 鉴权简明教程 | 快速入门 Go Protobuf 简明教程 | 快速入门 Go语言动手写Web框架 - Gee第七天 错误恢复(Panic Recover) WSL, Git, Mircosoft Terminal 等常用工具配置 Rust 简明教程 | 快速入门 | 极客兔兔 Go语言动手写Web框架 - Gee第六天 模板(HTML Template) 百宝箱 - 值得收藏的工具网站 | 极客兔兔 Go语言动手写Web框架 - Gee第五天 中间件Middleware | 极客兔兔 Go语言动手写Web框架 - Gee第四天 分组控制Group | 极客兔兔 Go语言动手写Web框架 - Gee第三天 前缀树路由Router | 极客兔兔 博客折腾记(七) - Gitalk Plus | 极客兔兔 Go语言动手写Web框架 - Gee第二天 上下文Context | 极客兔兔 Go2 新特性简明教程 | 快速入门 | 极客兔兔 博客折腾记(六) - 不要为了流量忘记了初心 | 极客兔兔 Go语言动手写Web框架 - Gee第一天 http.Handler | 极客兔兔 7天用Go从零实现Web框架Gee教程 | 极客兔兔 Go Gin 简明教程 | 快速入门 Go 语言简明教程 | 快速入门 | 极客兔兔 机器学习笔试面试题 11-20 | 极客面试 | 极客兔兔 机器学习笔试面试题 1-10 | 极客面试 | 极客兔兔 机器学习笔试面试题汇总 | 极客面试 | 极客兔兔 TensorFlow 2 中文文档 - RNN LSTM 文本分类 TensorFlow 2 中文文档 - TFHub 迁移学习 TensorFlow 2 中文文档 - 卷积神经网络分类 CIFAR-10 TensorFlow 2 中文文档 - 保存与加载模型 TensorFlow 2 中文文档 - 过拟合与欠拟合 TensorFlow 2 中文文档 - 回归预测燃油效率 TensorFlow 2 中文文档 - 特征工程结构化数据分类 TensorFlow 2 中文文档 - IMDB 文本分类 TensorFlow 2 中文文档 - MNIST 图像分类 TensorFlow 2 / 2.0 中文文档 TensorFlow 2.0 (九) - 强化学习 70行代码实战 Policy Gradient 博客折腾记(五) - 友链这件事,没那么简单 | 极客兔兔 博客折腾记(四) - 原创资格是争取来的 | 极客兔兔 TensorFlow 2.0 (八) - 强化学习 DQN 玩转 gym Mountain Car TensorFlow 2.0 (七) - 强化学习 Q-Learning 玩转 OpenAI gym 博客折腾记(三) - 主题设计、彩蛋与阅读量翻倍 | 极客兔兔 TensorFlow 2.0 (六) - 监督学习玩转 OpenAI gym game 博客折腾记(二) - 对搜索引擎的理解 | 极客兔兔 博客折腾记(一) - 极致性能的尝试 | 极客兔兔 Pandas 数据处理(三) - Cheat Sheet 中文版 TensorFlow 2.0 (五) - mnist手写数字识别(CNN卷积神经网络) TensorFlow入门(四) - mnist手写数字识别(制作h5py训练集) | 极客兔兔 TensorFlow入门(三) - mnist手写数字识别(可视化训练) | 极客兔兔 Pandas 数据处理(二) - 筛选数据 | 极客兔兔 Pandas 数据处理(一) - DataFrame 与 Series
pprof 性能分析 | Go 语言高性能编程
2020-11-22 · via 极客兔兔

源代码/数据集已上传到 Github - high-performance-go

benchmark & profiling - high performance with go

benchmark(基准测试) 可以度量某个函数或方法的性能,也就是说,如果我们知道性能的瓶颈点在哪里,benchmark 是一个非常好的方式。但是面对一个未知的程序,如何去分析这个程序的性能,并找到瓶颈点呢?

pprof 就是用来解决这个问题的。pprof 包含两部分:

  • 编译到程序中的 runtime/pprof
  • 性能剖析工具 go tool pprof

1 性能分析类型

1.1 CPU 性能分析

CPU 性能分析(CPU profiling) 是最常见的性能分析类型。

启动 CPU 分析时,运行时(runtime) 将每隔 10ms 中断一次,记录此时正在运行的协程(goroutines) 的堆栈信息。

程序运行结束后,可以分析记录的数据找到最热代码路径(hottest code paths)。

Compiler hot paths are code execution paths in the compiler in which most of the execution time is spent, and which are potentially executed very often.
What’s the meaning of “hot codepath”

一个函数在性能分析数据中出现的次数越多,说明执行该函数的代码路径(code path)花费的时间占总运行时间的比重越大。

1.2 内存性能分析

内存性能分析(Memory profiling) 记录堆内存分配时的堆栈信息,忽略栈内存分配信息。

内存性能分析启用时,默认每1000次采样1次,这个比例是可以调整的。因为内存性能分析是基于采样的,因此基于内存分析数据来判断程序所有的内存使用情况是很困难的。

1.3 阻塞性能分析

阻塞性能分析(block profiling) 是 Go 特有的。

阻塞性能分析用来记录一个协程等待一个共享资源花费的时间。在判断程序的并发瓶颈时会很有用。阻塞的场景包括:

  • 在没有缓冲区的信道上发送或接收数据。
  • 从空的信道上接收数据,或发送数据到满的信道上。
  • 尝试获得一个已经被其他协程锁住的排它锁。

一般情况下,当所有的 CPU 和内存瓶颈解决后,才会考虑这一类分析。

1.4 锁性能分析

锁性能分析(mutex profiling) 与阻塞分析类似,但专注于因为锁竞争导致的等待或延时。

2 CPU 性能分析

记录性能数据会对程序的性能产生影响,建议一次只记录一类数据。

2.1 生成 profile

Go 的运行时性能分析接口都位于 runtime/pprof 包中。只需要调用 runtime/pprof 库即可得到我们想要的数据。

假设我们实现了这么一个程序,随机生成了 5 组数据,并且使用冒泡排序法排序。

1
2
3
4
5
6
7
8
9
10
11
12
13
14
15
16
17
18
19
20
21
22
23
24
25
26
27
28
29
30
31
32
33
34

package main

import (
"math/rand"
"time"
)

func generate(n int) []int {
rand.Seed(time.Now().UnixNano())
nums := make([]int, 0)
for i := 0; i < n; i++ {
nums = append(nums, rand.Int())
}
return nums
}
func bubbleSort(nums []int) {
for i := 0; i < len(nums); i++ {
for j := 1; j < len(nums)-i; j++ {
if nums[j] < nums[j-1] {
nums[j], nums[j-1] = nums[j-1], nums[j]
}
}
}
}

func main() {
n := 10
for i := 0; i < 5; i++ {
nums := generate(n)
bubbleSort(nums)
n *= 10
}
}

如果我们想度量这个应用程序的 CPU 性能数据,只需要在 main 函数中添加 2 行代码即可:

1
2
3
4
5
6
7
8
9
10
11
12
13
14
15
16
17
import (
"math/rand"
"os"
"runtime/pprof"
"time"
)

func main() {
pprof.StartCPUProfile(os.Stdout)
defer pprof.StopCPUProfile()
n := 10
for i := 0; i < 5; i++ {
nums := generate(n)
bubbleSort(nums)
n *= 10
}
}

为了简单,直接将数据输出到标准输出 os.Stdout。运行该程序,将输出定向到文件 cpu.pprof 中。

1
$ go run main.go > cpu.pprof

一般来说,不建议将结果直接输出到标准输出,因为如果程序本身有输出,则会相互干扰,直接记录到一个文件中是最好的方式。

1
2
3
4
5
6
7
8
9
10
11
12
func main() {
f, _ := os.OpenFile("cpu.pprof", os.O_CREATE|os.O_RDWR, 0644)
defer f.Close()
pprof.StartCPUProfile(f)
defer pprof.StopCPUProfile()
n := 10
for i := 0; i < 5; i++ {
nums := generate(n)
bubbleSort(nums)
n *= 10
}
}

这样只需运行 go run main.go 即可。

2.2 分析数据

接下来,可以用 go tool pprof 分析这份数据

1
$ go tool pprof -http=:9999 cpu.pprof

如果提示 Graphviz 没有安装,则通过 brew install graphviz(MAC) 或 apt install graphviz(Ubuntu) 即可。

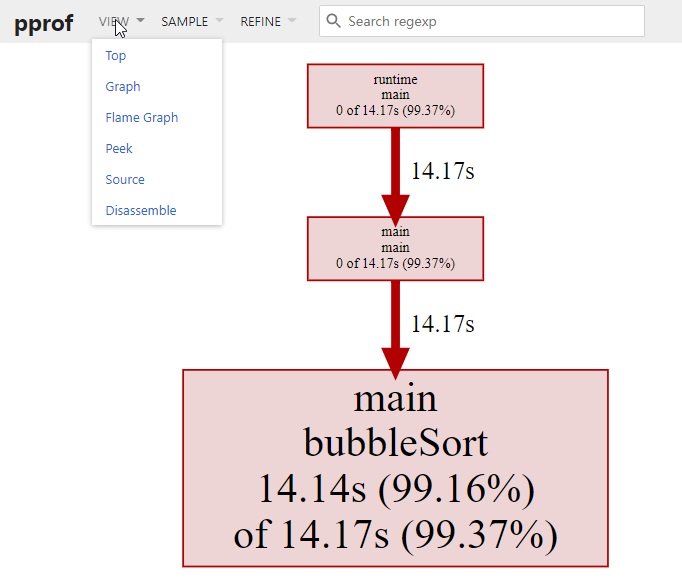
访问 localhost:9999,可以看到这样的页面:

bubble sort pprof

除了在网页中查看分析数据外,我们也可以在命令行中使用交互模式查看。

1
2
3
4
5
6
7
8
9
10
11
12
13
$ go tool pprof cpu.pprof
File: main
Type: cpu
Time: Nov 19, 2020 at 1:43am (CST)
Duration: 16.42s, Total samples = 14.26s (86.83%)
Entering interactive mode (type "help" for commands, "o" for options)
(pprof) top
Showing nodes accounting for 14.14s, 99.16% of 14.26s total
Dropped 34 nodes (cum <= 0.07s)
flat flat% sum% cum cum%
14.14s 99.16% 99.16% 14.17s 99.37% main.bubbleSort
0 0% 99.16% 14.17s 99.37% main.main
0 0% 99.16% 14.17s 99.37% runtime.main

可以看到 main.bubbleSort 是消耗 CPU 最多的函数。

还可以按照 cum (累计消耗)排序:

1
2
3
4
5
6
7
(pprof) top --cum
Showing nodes accounting for 14.14s, 99.16% of 14.26s total
Dropped 34 nodes (cum <= 0.07s)
flat flat% sum% cum cum%
14.14s 99.16% 99.16% 14.17s 99.37% main.bubbleSort
0 0% 99.16% 14.17s 99.37% main.main
0 0% 99.16% 14.17s 99.37% runtime.main

help 可以查看所有支持的命令和选项:

1
2
3
4
5
6
7
8
9
10
11
(pprof) help
Commands:
callgrind Outputs a graph in callgrind format
comments Output all profile comments
disasm Output assembly listings annotated with samples
dot Outputs a graph in DOT format
eog Visualize graph through eog
evince Visualize graph through evince
gif Outputs a graph image in GIF format
gv Visualize graph through gv
......

3 内存性能分析

3.1 生成 profile

假设我们实现了这么一个程序,生成长度为 N 的随机字符串,拼接在一起。

1
2
3
4
5
6
7
8
9
10
11
12
13
14
15
16
17
18
19
20
21
22
23
24
25
26
27
28
29
package main

import (
"github.com/pkg/profile"
"math/rand"
)

const letterBytes = "abcdefghijklmnopqrstuvwxyzABCDEFGHIJKLMNOPQRSTUVWXYZ"

func randomString(n int) string {
b := make([]byte, n)
for i := range b {
b[i] = letterBytes[rand.Intn(len(letterBytes))]
}
return string(b)
}

func concat(n int) string {
s := ""
for i := 0; i < n; i++ {
s += randomString(n)
}
return s
}

func main() {
defer profile.Start(profile.MemProfile, profile.MemProfileRate(1)).Stop()
concat(100)
}

接下来,我们使用一个易用性更强的库 pkg/profile 来采集性能数据,pkg/profile 封装了 runtime/pprof 的接口,使用起来更简单。

比如我们想度量 concat() 的 CPU 性能数据,只需要一行代码即可生成 profile 文件。

1
2
3
4
5
6
7
8
import (
"github.com/pkg/profile"
)

func main() {
defer profile.Start().Stop()
concat(100)
}

运行 go run main.go

1
2
3
$ go run main.go
2020/11/22 18:38:29 profile: cpu profiling enabled, /tmp/profile068616584/cpu.pprof
2020/11/22 18:39:12 profile: cpu profiling disabled, /tmp/profile068616584/cpu.pprof

CPU profile 文件已经在 tmp 目录生成,得到 profile 文件后,就可以像之前一样,用 go tool pprof 命令,在浏览器或命令行进行分析了。

接下来将使用类似的方式,进行采集内存数据,同样地,只需简单地修改 main 函数即可。

1
2
3
4
func main() {
defer profile.Start(profile.MemProfile, profile.MemProfileRate(1)).Stop()
concat(100)
}

运行 go run main.go:

1
2
3
$ go run main.go
2020/11/22 18:59:04 profile: memory profiling enabled (rate 1), /tmp/profile215959616/mem.pprof
2020/11/22 18:59:04 profile: memory profiling disabled, /tmp/profile215959616/mem.pprof

3.2 分析数据

接下来,我们在浏览器中分析内存性能数据:

1
go tool pprof -http=:9999 /tmp/profile215959616/mem.pprof

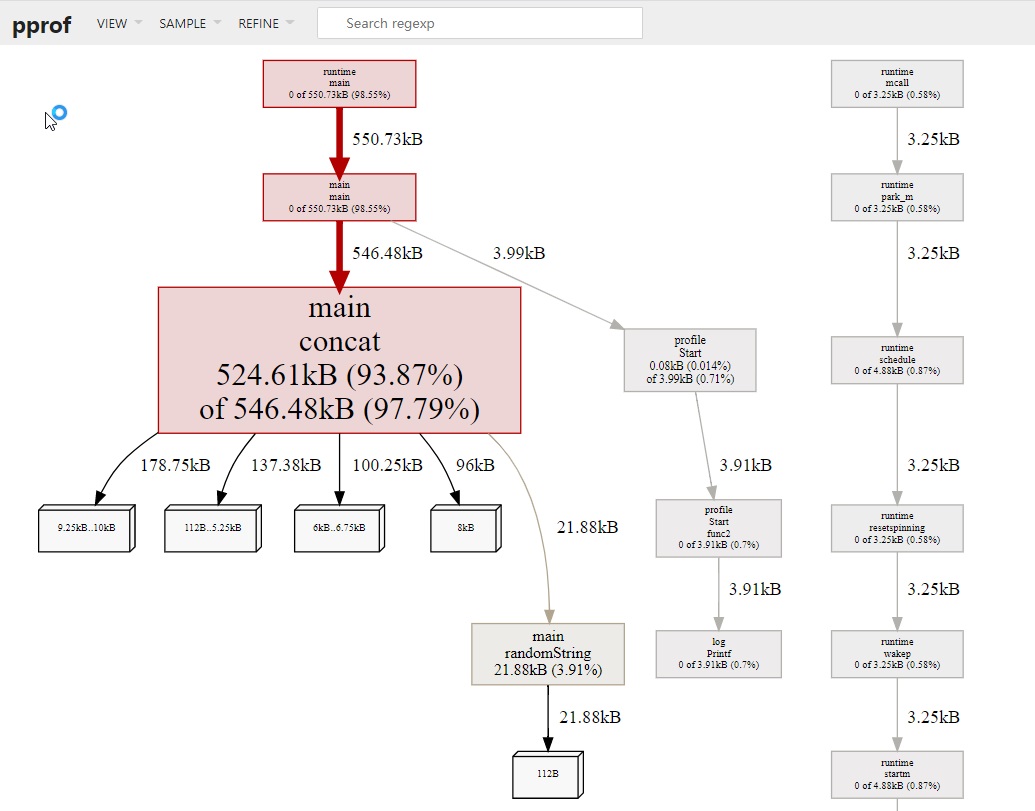
concat memory pprof

从这张图中,我们可以看到 concat 消耗了 524k 内存,randomString 仅消耗了 22k 内存。理论上,concat 函数仅仅是将 randomString 生成的字符串拼接起来,消耗的内存应该和 randomString 一致,但怎么会产生 20 倍的差异呢?这和 Go 语言字符串内存分配的方式有关系。字符串是不可变的,因为将两个字符串拼接时,相当于是产生新的字符串,如果当前的空间不足以容纳新的字符串,则会申请更大的空间,将新字符串完全拷贝过去,这消耗了 2 倍的内存空间。在这 100 次拼接的过程中,会产生多次字符串拷贝,从而消耗大量的内存。

那有什么好的方式呢?使用 strings.Builder 替换 + 进行字符串拼接,将有效地降低内存消耗。

1
2
3
4
5
6
7
func concat(n int) string {
var s strings.Builder
for i := 0; i < n; i++ {
s.WriteString(randomString(n))
}
return s.String()
}

接下来,重新运行 go run main.go

1
2
3
$ go run main.go
2020/11/22 19:17:55 profile: memory profiling enabled (rate 1), /tmp/profile061547314/mem.pprof
2020/11/22 19:17:55 profile: memory profiling disabled, /tmp/profile061547314/mem.pprof

使用交互模式,查看内存消耗情况:

1
2
3
4
5
6
7
8
9
10
11
12
13
14
15
$ go tool pprof /tmp/profile061547314/mem.pprof
File: main
Type: inuse_space
Time: Nov 22, 2020 at 7:17pm (CST)
Entering interactive mode (type "help" for commands, "o" for options)
(pprof) top --cum
Showing nodes accounting for 71.22kB, 89.01% of 80.01kB total
Dropped 25 nodes (cum <= 0.40kB)
Showing top 10 nodes out of 50
flat flat% sum% cum cum%
0 0% 0% 71.88kB 89.84% main.main
0 0% 0% 71.88kB 89.84% runtime.main
0 0% 0% 67.64kB 84.54% main.concat
45.77kB 57.20% 57.20% 45.77kB 57.20% strings.(*Builder).WriteString
21.88kB 27.34% 84.54% 21.88kB 27.34% main.randomString

可以看到,使用 strings.Builder 后,concat 内存消耗降为了原来的 1/8 。

4 benchmark 生成 profile

使用 testing 库进行 benchmark 基准测试 这篇文章中,我们介绍了 benchmark 的使用方式。除了直接在命令行中查看测试的结果外,也可以生成 profile 文件,使用 go tool pprof 分析。

testing 支持生成 CPU、memory 和 block 的 profile 文件。

  • -cpuprofile=$FILE
  • -memprofile=$FILE, -memprofilerate=N 调整记录速率为原来的 1/N。
  • -blockprofile=$FILE

在介绍 benchmark 如何使用,我们举了下面这个例子:

1
2
3
4
5
6
7
8
9
10
11
12
func fib(n int) int {
if n == 0 || n == 1 {
return n
}
return fib(n-2) + fib(n-1)
}

func BenchmarkFib(b *testing.B) {
for n := 0; n < b.N; n++ {
fib(30)
}
}

只需要在 go test 添加 -cpuprofile 参数即可生成 BenchmarkFib 对应的 CPU profile 文件:

1
2
3
4
5
6
7
$ go test -bench="Fib$" -cpuprofile=cpu.pprof .
goos: linux
goarch: amd64
pkg: example
BenchmarkFib-8 196 6071636 ns/op
PASS
ok example 2.046s

用例执行完毕后,当前目录多出了一个 cpu.pprof 文件,接下来就可以使用 go tool pprof 命令进行分析了。

使用 -text 选项可以直接将结果以文本形式打印出来。

1
2
3
4
5
6
7
8
9
10
11
$ go tool pprof -text cpu.pprof
File: example.test
Type: cpu
Time: Nov 22, 2020 at 7:52pm (CST)
Duration: 2.01s, Total samples = 1.77s (87.96%)
Showing nodes accounting for 1.77s, 100% of 1.77s total
flat flat% sum% cum cum%
1.76s 99.44% 99.44% 1.76s 99.44% example.fib
0.01s 0.56% 100% 0.01s 0.56% runtime.futex
0 0% 100% 1.76s 99.44% example.BenchmarkFib
0 0% 100% 0.01s 0.56% runtime.findrunnable

pprof 支持多种输出格式(图片、文本、Web等),直接在命令行中运行 go tool pprof 即可看到所有支持的选项:

1
2
3
4
5
6
7
8
9
10
$ go tool pprof

Details:
Output formats (select at most one):
-dot Outputs a graph in DOT format
-png Outputs a graph image in PNG format
-text Outputs top entries in text form
-tree Outputs a text rendering of call graph
-web Visualize graph through web browser
...

附 推荐与参考


edit this page last updated at 2026-02-23