惯性聚合 高效追踪和阅读你感兴趣的博客、新闻、科技资讯
阅读原文 在惯性聚合中打开

推荐订阅源

V
Vulnerabilities – Threatpost
Know Your Adversary
Know Your Adversary
C
Cyber Attacks, Cyber Crime and Cyber Security
S
Secure Thoughts
让小产品的独立变现更简单 - ezindie.com
宝玉的分享
宝玉的分享
Spread Privacy
Spread Privacy
AWS News Blog
AWS News Blog
D
Docker
Threat Intelligence Blog | Flashpoint
OSCHINA 社区最新新闻
OSCHINA 社区最新新闻
TaoSecurity Blog
TaoSecurity Blog
博客园 - 三生石上(FineUI控件)
Apple Machine Learning Research
Cyberwarzone
Cyberwarzone
V
V2EX
Exploit-DB.com RSS Feed
WordPress大学
WordPress大学
P
Palo Alto Networks Blog
H
Heimdal Security Blog
奇客Solidot–传递最新科技情报
奇客Solidot–传递最新科技情报
博客园 - 叶小钗
N
News and Events Feed by Topic
cs.CL updates on arXiv.org
Simon Willison's Weblog
Project Zero
Project Zero
Martin Fowler
Martin Fowler
大猫的无限游戏
大猫的无限游戏
D
DataBreaches.Net
Engineering at Meta
Engineering at Meta
S
Schneier on Security
Google DeepMind News
cs.CV updates on arXiv.org
Hugging Face - Blog
Hugging Face - Blog
P
Proofpoint News Feed
S
SegmentFault 最新的问题
Hacker News: Ask HN
Hacker News: Ask HN
小众软件
小众软件
博客园 - 聂微东
S
Security Affairs
T
Tor Project blog
www.infosecurity-magazine.com
T
Threat Research - Cisco Blogs
T
Threatpost
博客园 - 【当耐特】
L
LINUX DO - 热门话题
G
Google Developers Blog
P
Privacy & Cybersecurity Law Blog
A
About on SuperTechFans
F
Fortinet All Blogs

祈雨的笔记

安全多方计算MPC spark原理解析 kueue执行源码分析 spark on k8s执行源码分析 spark-operator源码解析 系统压测遇到的缓存击穿问题 我的世界PC与安卓联机 蚂蚁金服流量投放平台的AIG改造 G1大对象致Old区占用率高 日志打印导致接口响应率下跌分析 Groovy加载类导致OOM分析 ERROR日志打印导致CPU满载 记OceanBase死锁超时 应用发版期间服务响应超时 Ark Serverless初探 系统优化复盘一二三 The user specified as a definer does not exist Kong网关初探 API网关选型调研 配置中心选型调研 root操作Nginx导致用户组错误 基于Proxifier使用代理 FastJSON字段智能匹配踩坑 Nacos初探 记一次Nginx服务器CPU满荷载故障 基于券系统分库分表的思考 limit不参与SQL成本计算致索引失效 Linux常用性能监控命令 golang低版本http2偶现400 hostname in certificate didn't match 常见对称加密原理以及应用 tcp_tw_recycle引起的TCP握手失败 记一次mysql执行DDL导致锁表 mysql磁盘占用查看 mysql对text字段update致磁盘增长 elasticsearch报错index read-only TIME_WAIT与Http的Keep-Alive 记一次TIME_WAIT导致连接数报警 记一次生产事故OOM问题排查 redis分布式锁RedissonLock的实现细节 webservice复杂加密签名(2)java调用 webservice复杂加密签名(1)SoapUI mysql延时关联 利用中间人拦截实现APP内H5窜改 MySQL表字符集不同导致关联查询索引失效 通过SSH隧道远程办公 数据落盘方案 BeanDefinitionRegistryPostProcessor扩展 mysql空间索引 HTTPS攻击 spring循环依赖过程解析 elasticsearch性能优化 mysql IS NULL 使用索引 mysql字符集utf8mb4失效踩坑 常用加密算法 xml与javaBean转换 初探InnoDB MVCC源码实现 mysql索引原理 redis之list源码分析 redis之key过期源码分析 redis之string源码分析 redis之hash源码分析 线程池之ThreadPoolExecutor mysql数据页结构 Using temporary与Using filesort mysql回表致索引失效 springboot(28)HTTP连接池 定时任务之ScheduledThreadPoolExecutor elasticsearch常用script聚合 elasticsearch实现like查询 elasticsearch实现乐观锁 elasticsearch准实时原理 springboot(27)自定义缓存读写机制CachingConfigurerSupport optimizer tracing arthas常用命令 HTTP和HTTPS详解 redis集群选举机制 kafka消息重试 一点压力测试的经验 kafka架构概念 explain分析sql语句字段的解释 JVM问题分析处理手册 logstash过滤器(2)date logstash过滤器(3)dissect logstash编码器(1)json logstash编码器(2)multiline logstash表达式 logstash输入(1)通用选项 logstash输入(3)file logstash过滤器(1)通用选项 logstash输入(2)stdin logstash安装 记一次前端vConsole导致JSON序列化错误排查 解决多个异步操作嵌套问题 fastjson反序列化失败autoType is not support RTMP串流服务 POI自动调整列宽错误 Nginx+Lua实现动态黑名单 使用curl命令模拟POST和GET请求 ResponseEntity下载文件
CPU火焰图常用工具
祈雨的笔记 · 2021-02-27 · via 祈雨的笔记

CPU火焰图

关于性能分析

  • On-CPU火焰图: 基于线程在CPU执行上耗时采样,可以直观地查看线程花费在CPU上的时间分布
  • Off-CPU火焰图: 基于线程在CPU等待(I/O、锁、中断等原因)上耗时采样,可以直观地查看线程花费在阻塞上的时间分布

一篇关于off-cpu火焰图的入门引导性文章:offcpuanalysis

Off-CPU analysis is complementary to CPU analysis, so that 100% of thread time can be understood. This method also differs from tracing techniques that instrument applications functions that commonly block, since this method targets the kernel scheduler’s notion of blocking, which is a convenient catch-all.

Threads can leave CPU for a number of reasons, including I/O and locks, but also some that are unrelated to the current thread’s execution, including involuntary context switching due to high demand for CPU resources, and interrupts. Whatever the reason, if this occurs during a workload request (a synchronous code-path), then it is introducing latency.

常用工具

arthas

arthas是Alibaba开源的Java诊断工具,其中整合了很多实用的工具,例如查看当前JVM的线程堆栈信息、查看和修改JVM的系统属性、方法执行数据观测、生成火焰图等。最大的优点是对监控应用无代码侵入,也不需要重启监控应用或者添加启动参数就可以随意attach到目标JVM进程然后进行各种操作。

此处重点提到的是arthas中的profiler功能,实际上是对async-profiler的封装,可以对JVM应用进行采样后输出各种类型的火焰图。

使用教程

  1. 启动arthas
1
2
wget https://alibaba.github.io/arthas/arthas-boot.jar
java -jar arthas-boot.jar
  1. 启动profiler采样
1
2
3
# 基于CPU使用率采样(适用于CPU密集型)
$ profiler start
Started [cpu] profiling
1
2
3
# 基于样本采样,可估算耗时(适用于IO密集型)
$ profiler start -e wall
Started [wall] profiling
  1. 获取已采集的sample的数量
1
2
$ profiler getSamples
23
  1. 查看profiler状态
1
2
$ profiler status
[cpu] profiling is running for 4 seconds
  1. 生成svg格式结果
1
2
3
$ profiler stop
profiler output file: /tmp/demo/arthas-output/20191125-135546.svg
OK

采样事件

async-profiler支持对多种事件做采样分析,例如cpualloclockcache-misses等,常用的采样事件为cpuwall。其中火焰图采样未指定事件时默认对cpu事件进行采样,即On-CPU火焰图,仅包含JVM在CPU执行时的采样,而不包含CPU等待时的采样。

如果需要分析IO密集型应用,比较适合对wall事件进行采样,如下官方描述,wall事件会对所有任意状态的线程进行采样,既包含CPU执行时的采样,也包含了CPU等待时的采样,可以用来更显著地分析线程在各个方法上的耗时分布。

-e wall option tells async-profiler to sample all threads equally every given period of time regardless of thread status: Running, Sleeping or Blocked. For instance, this can be helpful when profiling application start-up time.

demo

1
2
3
4
5
6
7
8
9
10
11
12
13
14
15
16
17
18
19
20
21
22
23
24
25
26
27
28
29
30
31
32
33
34
35
@RestController
@RequestMapping
public class IndexController {

@GetMapping("/")
public String index() throws InterruptedException {
long start = System.currentTimeMillis();
cpuHandler();
long time1 = System.currentTimeMillis();
timeHandler();
long time2 = System.currentTimeMillis();
normalHandler();
long time3 = System.currentTimeMillis();

return String.format("%d %d %d", time1 - start, time2 - time1, time3 - time2);
}

private int cpuHandler() {
int value = 0;
int max = (int)(Math.random() * 100_000_000);
for (int i = 0; i < max; i++) {
value += i;
}
return value;
}

private void timeHandler() throws InterruptedException {
Thread.sleep(10);
}

private void normalHandler() {
Random random = new Random();
random.nextInt(100);
}
}
  • cpu事件采样

image

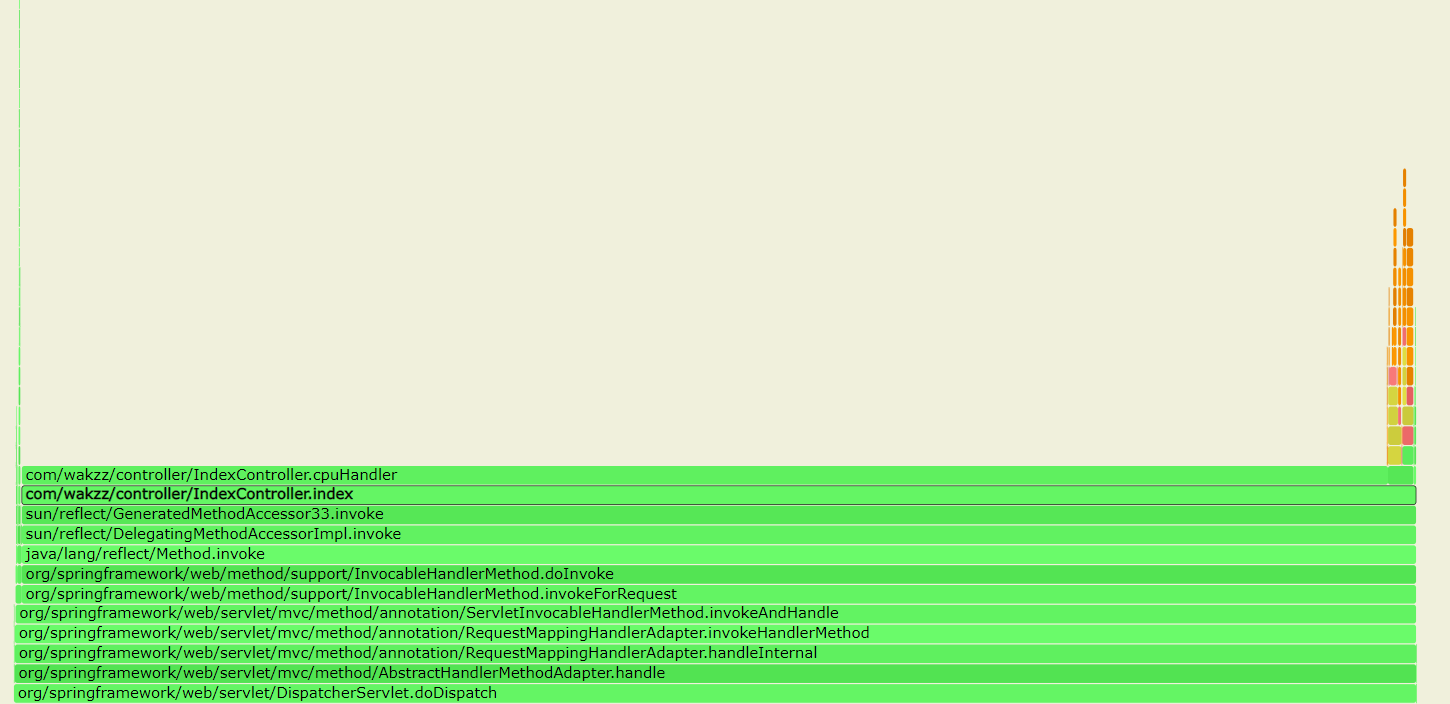
由图可以明细的看出来,index方法中cpuHandler事件采样占比最高,即On-CPU中cpuHandler方法占用的CPU最高。如果因为应用占用CPU消耗高,需要进行优化,那么通过该火焰图很容易分析出来需要对cpuHandler方法优化来降低CPU消耗。

  • wall事件采样

image

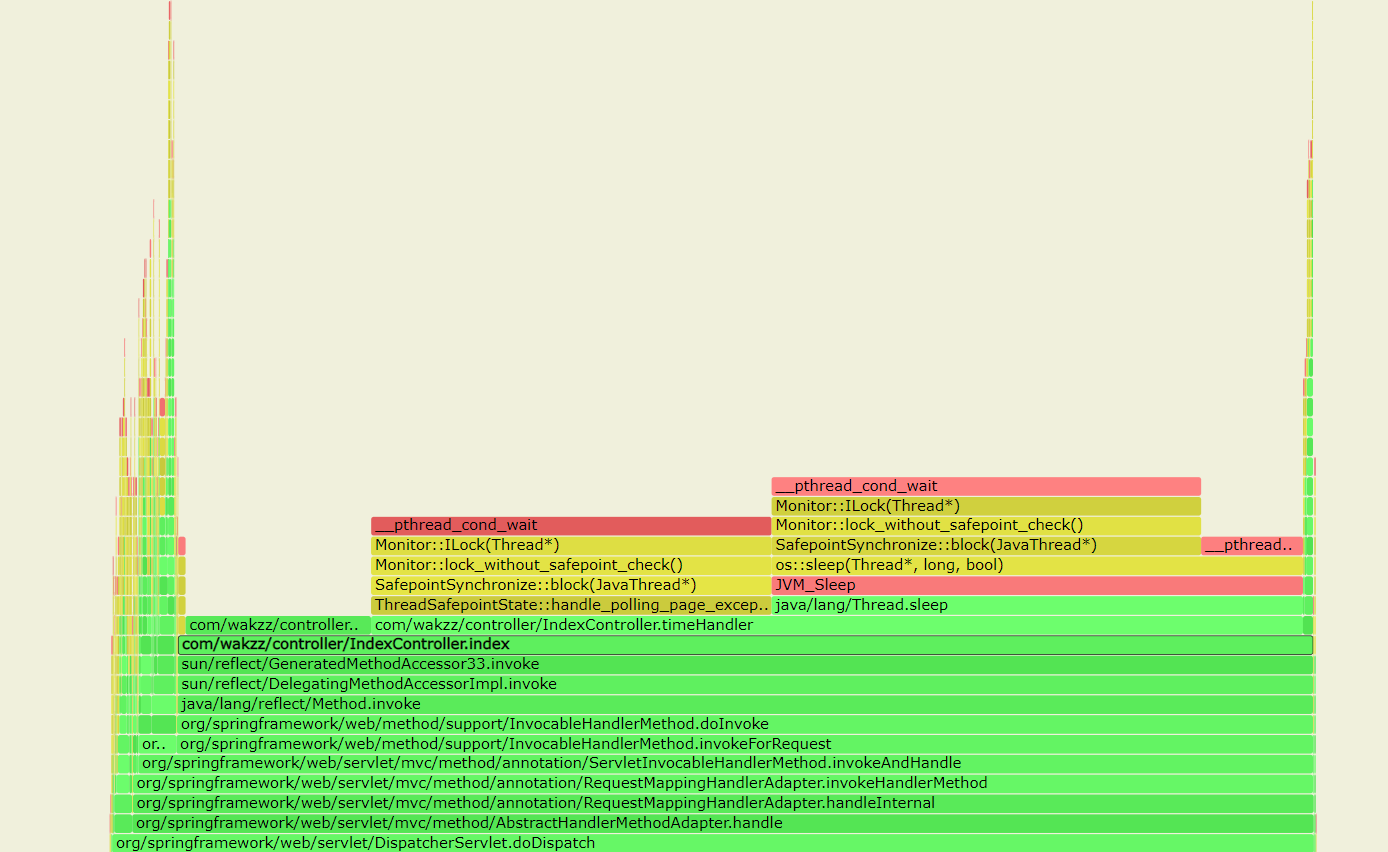
由图可以明细的看出来,index方法中timeHandler事件采样占比最高,即timeHandler方法占用线程耗时时间最高。如果因为index方法耗时较长,需要进行优化,那么通过该火焰图很容易分析出来需要对timeHandler方法优化来降低线程耗时时间。

pprof

pprof是Golang用于可视化和分析配置文件数据的工具。

pprof读取profile.proto格式的分析样本的集合,并生成报告以可视化并帮助分析数据。它可以生成文本和图形报告。

使用教程

1
2
curl -so on-cpu.pprof http://127.0.0.1:9090/debug/pprof/profile?seconds=10
go tool pprof -http=0.0.0.0:6061 ./on-cpu.pprof
1
2
3
curl -so pprof.trace http://127.0.0.1:9090/debug/pprof/trace?seconds=10
go tool trace --pprof=sync pprof.trace > off-cpu.pprof
go tool pprof -http=0.0.0.0:6061 ./off-cpu.pprof

采样事件

pprof中的profile事件实际上就是CPU执行上耗时采样,适合用于分析CPU密集型的耗时分布,或者用于分析应用CPU性能的执行荷载分布。

而pprof中的trace事件虽然官方文档描述如下说是追踪事件,但实际测试下来有点像是Off-CPU的时间分布,但又有有些区别,例如最简单的time.Sleep()睡眠时间并未采集到该事件中。

The package also exports a handler that serves execution trace data for the “go tool trace” command

demo

1
2
3
4
5
6
7
8
9
10
11
12
13
14
15
16
17
18
19
20
21
22
23
24
25
26
27
28
29
30
31
32
33
34
35
36
37
38
39
40
41
42
43
44
45
46
package main

import (
"fmt"
"log"
"math/rand"
"net/http"
_ "net/http/pprof"
"time"
)

func main() {
http.HandleFunc("/", handler)
err := http.ListenAndServe(":9090", nil)
if err != nil {
log.Fatal("ListenAndServe: ", err)
}
}

func handler(w http.ResponseWriter, r *http.Request) {
start := time.Now()
cpuHandler()
time1 := time.Now()
sleepHandler()
time2 := time.Now()
normalHandler()
time3 := time.Now()

response := fmt.Sprintf("%v, %v, %v", time1.Sub(start), time2.Sub(time1), time3.Sub(time2))
_, _ = fmt.Fprint(w, response)
}

func cpuHandler() (value int) {
for i := 0; i < 10_000_000; i++ {
value += i
}
return
}

func sleepHandler() {
_, _ = http.Get("http://192.168.50.150")
}

func normalHandler() {
rand.Int31n(100)
}
  • profile事件采样

image

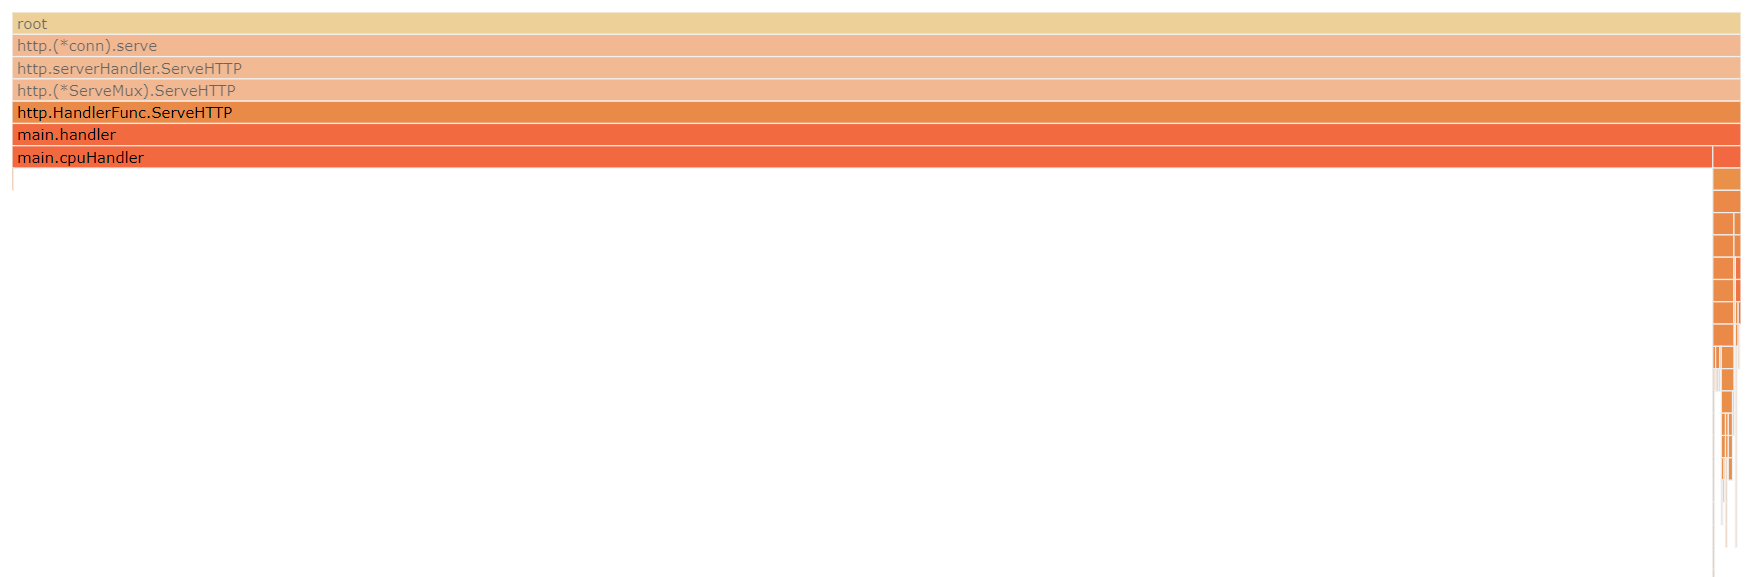
由图可以明细的看出来,handler方法中cpuHandler事件采样占比最高,即On-CPU中cpuHandler方法占用的CPU最高。如果因为应用占用CPU消耗高,需要进行优化,那么通过该火焰图很容易分析出来需要对cpuHandler方法优化来降低CPU消耗。

  • trace事件采样

image

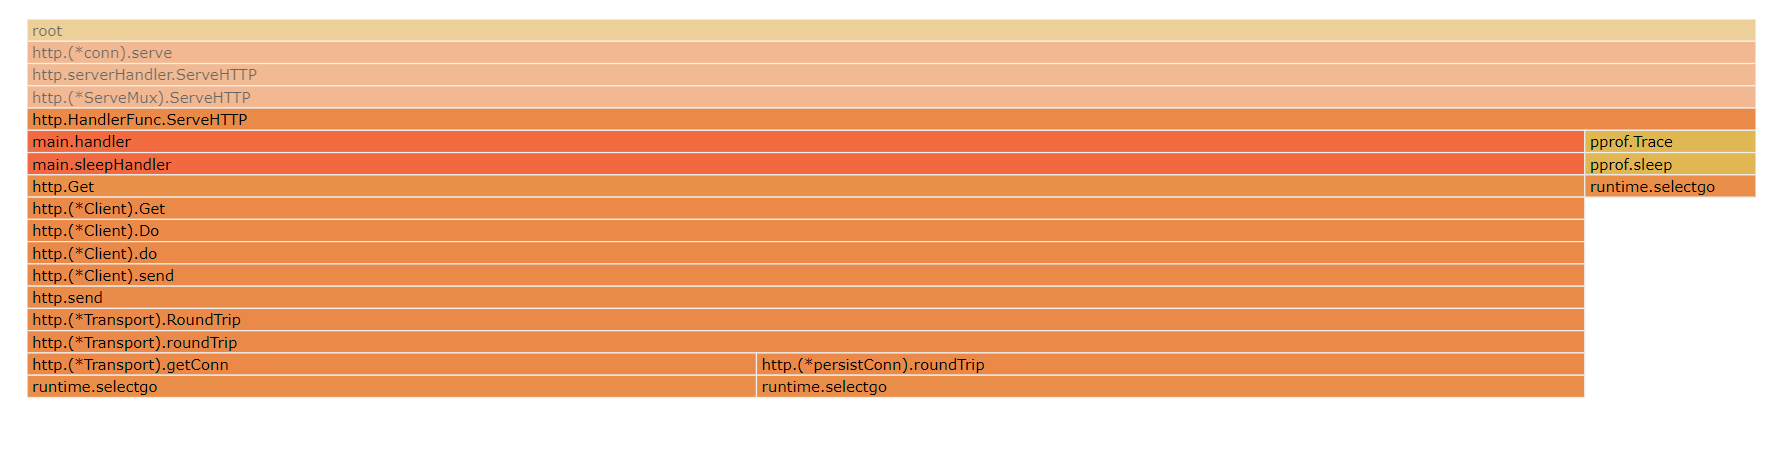
由图可以明细的看出来,handler方法中sleepHandler事件采样占比最高,即Off-CPU中sleepHandler方法占用的CPU等待时间最高。如果因为handler方法耗时久,需要进行优化,那么通过该火焰图很容易分析出来需要优先对sleepHandler方法优化来降低CPU等待耗时。

但由于trace事件采样的局限性,不能展示出线程的耗时分布,因此还需要更多的信息来分析handler方法的耗时原因。

常见错误

当对采集数据进行可视化分析时,如果控制台或者WEB界面输出如下错误,则说明当前机器需要安装graphviz依赖。对于centos快速安装依赖的方式为执行命令:yum install -y graphviz

1
2
3
4
5
[root@localhost ~]# go tool pprof -http=0.0.0.0:6061 ./pprof
Serving web UI on http://0.0.0.0:6061
http://0.0.0.0:6061
Failed to execute dot. Is Graphviz installed?
exec: "dot": executable file not found in $PATH
1
Could not execute dot; may need to install graphviz.

fgprof

基于Golang官方提供的pprof的内置采集事件只能采集On-CPU时间,第三方库实现了类似于pprof的工具fgprof,可以对Golang的On-CPU和Off-CPU的性能一起提供分析。

使用教程

1
2
curl -so fgprof.pprof http://127.0.0.1:9090/debug/fgprof?seconds=10
go tool pprof -http=0.0.0.0:6061 ./fgprof.pprof

采集事件

fgprof is a sampling Go profiler that allows you to analyze On-CPU as well as Off-CPU (e.g. I/O) time together.

Go’s builtin sampling CPU profiler can only show On-CPU time, but it’s better than fgprof at that. Go also includes tracing profilers that can analyze I/O, but they can’t be combined with the CPU profiler.

fgprof is designed for analyzing applications with mixed I/O and CPU workloads. This kind of profiling is also known as wall-clock profiling.

fgprof的采集事件与arthas中的wall事件类似,都是直接对所有状态的goroutine进行采样,既包含CPU执行时的采样,也包含了CPU等待时的采样,可以用来更显著地分析线程在各个方法上的耗时分布。

demo

1
2
3
4
5
6
7
8
9
10
11
12
13
14
15
16
17
18
19
20
21
22
23
24
25
26
27
28
29
30
31
32
33
34
35
36
37
38
39
40
41
42
43
44
45
46
47
package main

import (
"fmt"
"github.com/felixge/fgprof"
"log"
"math/rand"
"net/http"
"time"
)

func main() {
http.HandleFunc("/", handler)
http.Handle("/debug/fgprof", fgprof.Handler())
err := http.ListenAndServe(":9090", nil)
if err != nil {
log.Fatal("ListenAndServe: ", err)
}
}

func handler(w http.ResponseWriter, r *http.Request) {
start := time.Now()
cpuHandler()
time1 := time.Now()
sleepHandler()
time2 := time.Now()
normalHandler()
time3 := time.Now()

response := fmt.Sprintf("%v, %v, %v", time1.Sub(start), time2.Sub(time1), time3.Sub(time2))
_, _ = fmt.Fprint(w, response)
}

func cpuHandler() (value int) {
for i := 0; i < 10_000_000; i++ {
value += i
}
return
}

func sleepHandler() {
_, _ = http.Get("http://192.168.50.150")
}

func normalHandler() {
rand.Int31n(100)
}
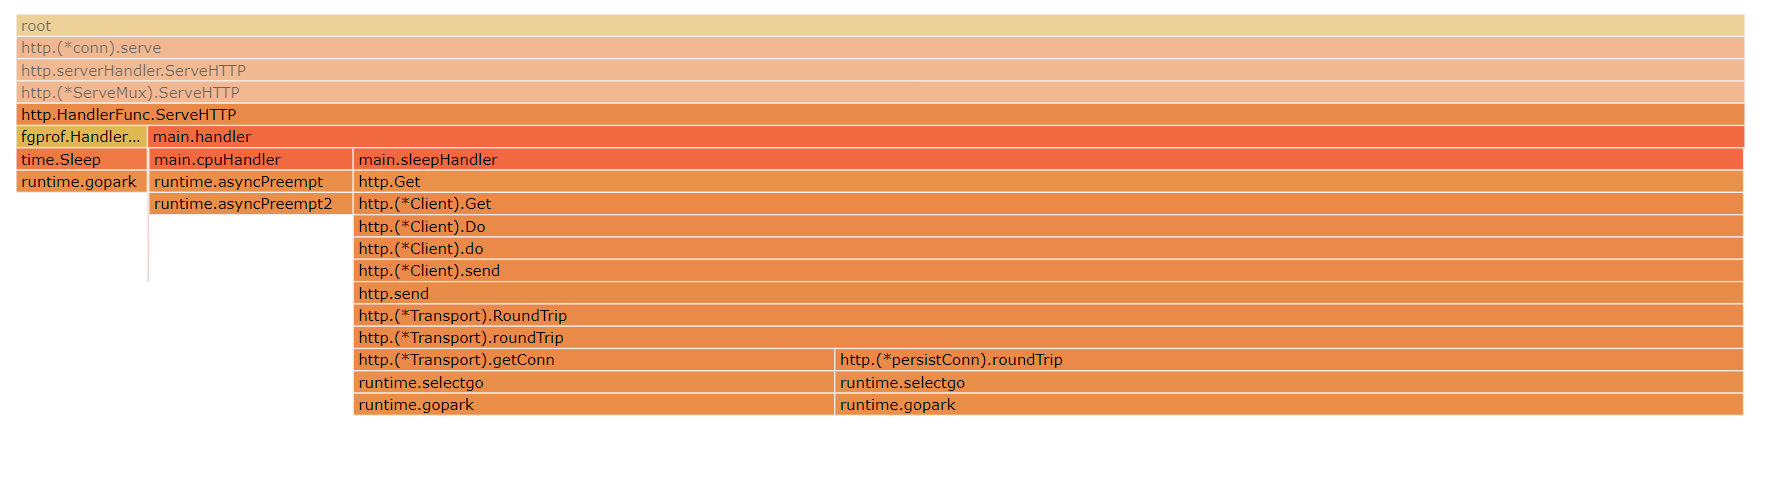
  • fgprof采样

image

由图可以明细的看出来,handler方法中sleepHandler事件采样占比最高,即sleepHandler方法占用的线程耗时时间最多。如果因为handler方法耗时久,需要进行优化,那么通过该火焰图很容易分析出来需要优先对sleepHandler方法优化来降低线程耗时。

perf

采集事件

使用教程

  1. 数据采样
1
2
// On-CPU采样数据
perf record -g
1
2
// Off-CPU采样数据
perf record -g -e 'sched:sched_switch' -e 'sched:sched_stat_sleep' -e 'sched:sched_process_exit'
  1. 生成火焰图
1
git clone https://github.com/brendangregg/FlameGraph
1
perf script | ./FlameGraph/stackcollapse-perf.pl | ./FlameGraph/flamegraph.pl > perf.svg

demo

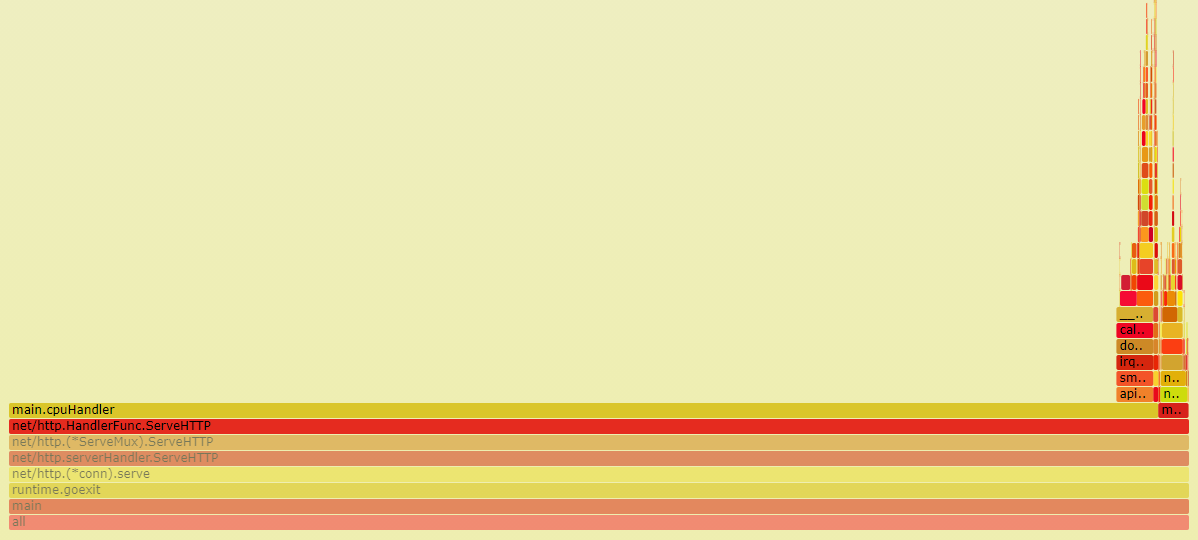
  • On-CPU采样

image

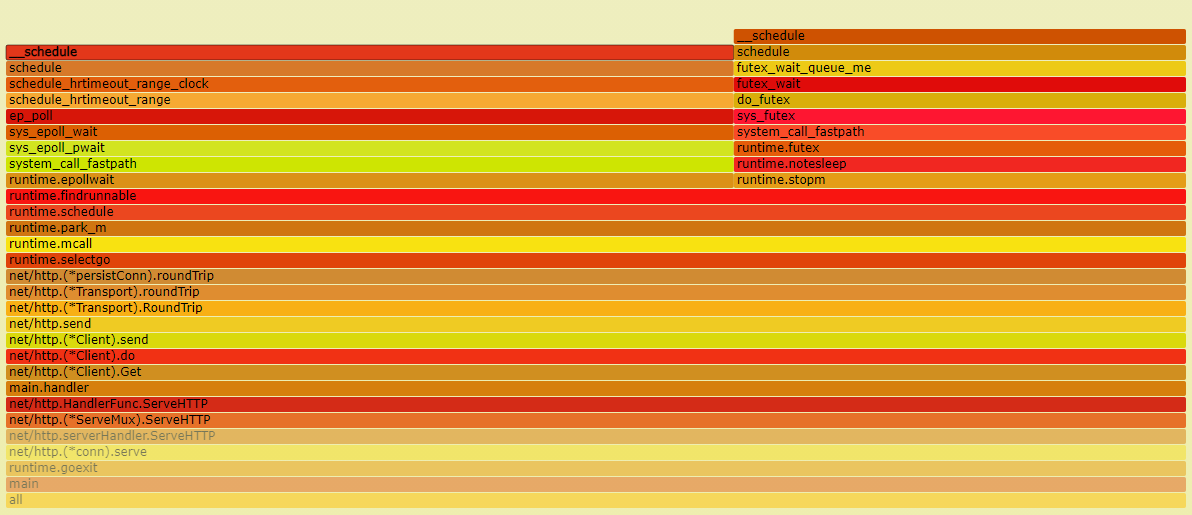
  • Off-CPU采样

image