惯性聚合 高效追踪和阅读你感兴趣的博客、新闻、科技资讯
阅读原文 在惯性聚合中打开

推荐订阅源

Security Archives - TechRepublic
T
The Exploit Database - CXSecurity.com
P
Proofpoint News Feed
Scott Helme
Scott Helme
NISL@THU
NISL@THU
Cisco Talos Blog
Cisco Talos Blog
C
Cybersecurity and Infrastructure Security Agency CISA
AWS News Blog
AWS News Blog
V
Vulnerabilities – Threatpost
J
Java Code Geeks
U
Unit 42
The GitHub Blog
The GitHub Blog
H
Help Net Security
T
Tenable Blog
aimingoo的专栏
aimingoo的专栏
Jina AI
Jina AI
Spread Privacy
Spread Privacy
Apple Machine Learning Research
人人都是产品经理
人人都是产品经理
L
Lohrmann on Cybersecurity
T
Threatpost
让小产品的独立变现更简单 - ezindie.com
Engineering at Meta
Engineering at Meta
A
About on SuperTechFans
I
InfoQ
Microsoft Azure Blog
B
Blog
L
LINUX DO - 最新话题
K
Kaspersky official blog
cs.CV updates on arXiv.org
T
Threat Research - Cisco Blogs
C
Check Point Blog
T
The Blog of Author Tim Ferriss
有赞技术团队
有赞技术团队
宝玉的分享
宝玉的分享
Help Net Security
Help Net Security
Google DeepMind News
A
Arctic Wolf
Y
Y Combinator Blog
N
News | PayPal Newsroom
M
MIT News - Artificial intelligence
Latest news
Latest news
H
Hacker News: Front Page
Blog — PlanetScale
Blog — PlanetScale
腾讯CDC
I
Intezer
爱范儿
爱范儿
F
Fortinet All Blogs
P
Palo Alto Networks Blog
C
CERT Recently Published Vulnerability Notes

Android Performance

SmartPerfetto 架构文章 Q&A:8 个深度技术问答 从 Trace 到洞察:SmartPerfetto AI Agent 的 Harness Engineering 实战 OpenClaw 常见问题解答:Token 消耗、能干什么、本地模型、隐私安全、使用体验 我把 OpenClaw 跑在本地三周后,发现它根本不是聊天机器人 Android Perfetto 系列 10 - Binder 调度与锁竞争 Android Perfetto 系列 9 - CPU 信息解读 Android Perfetto 系列 8:深入理解 Vsync 机制与性能分析 Android Perfetto 系列 7 - MainThread 和 RenderThread 解读 Android Perfetto 系列 6:为什么是 120Hz?高刷新率的优势与挑战 Android Perfetto 系列 5:Android App 基于 Choreographer 的渲染流程 Android Perfetto 系列 4:使用命令行在本地打开超大 Trace Android ANR 系列 3 :ANR 案例分享 Android ANR 系列 2 :ANR 分析套路和关键 Log 介绍 Android ANR 系列 1 :理解 Android ANR 设计思想 Android Perfetto 系列 3:熟悉 Perfetto View Android Perfetto 系列 2:Perfetto Trace 抓取 Android Perfetto 系列 1:Perfetto 工具简介 Android Perfetto 系列目录 2023 年的方方面面 关于 The Android Performance 知识星球介绍 The Performance Design Of OS OS 设计之性能设计 当 App 有了系统权限,真的可以为所欲为? The Performance 星球茶话会 - 第一期 Systrace 线程 CPU 运行状态分析技巧 - Sleep 和 Uninterruptible Sleep 篇 Systrace 线程 CPU 运行状态分析技巧 - Running 篇 Systrace 线程 CPU 运行状态分析技巧 - Runnable 篇 Android 性能优化的术、道、器 Techniques, Philosophy, and Tools for Android Performance Optimization 回顾 2021 一本讲 Android 流畅性的书,应该有什么内容? Android 系统开发系列(1):Android 12 源代码下载、编译和刷机 Android Systrace 响应速度实战 3 :响应速度延伸知识 Android Systrace 响应速度实战 2 :响应速度实战分析-以启动速度为例 Android Systrace 响应速度实战 1 :了解响应速度原理 Android Systrace 流畅性实战 3 :卡顿分析过程中的一些疑问 Android Systrace 流畅性实战 2 :案例分析 - MIUI 桌面滑动卡顿分析 Android Systrace 流畅性实战 1 :了解卡顿原理 华为手机刷微博体验更好?技术角度的一些分析和思考 一个「闰」字引发的事故 - 三星系统重启分析 Android App 链式唤醒分析 Android Systrace 基础知识 - SurfaceFlinger 解读 Android 开发者学习路线(2020 版本) 我的 2020 年读书单 Android Systrace 基础知识 - CPU Info 解读 Android Systrace 基础知识 - Triple Buffer 解读 Android Systrace 基础知识 - Binder 和锁竞争解读 「置顶」博客文章目录 Android Systrace 基础知识 - Vsync 解读 Android App 启动优化全记录 Android Systrace 基础知识 - MainThread 和 RenderThread 解读 Android Systrace 基础知识 - Input 解读 Android 中的“后台无效动画“行为分析 Android 基于 Choreographer 的渲染机制详解 Android 中的卡顿丢帧原因概述 - 低内存篇 Android 桌面被杀问题分析案例 Android 中的卡顿丢帧原因概述 - 应用篇 Android 中的卡顿丢帧原因概述 - 系统篇 Android 中的卡顿丢帧原因概述 - 方法论 Android 中的 Activity Launch Mode 详解 Android 中的 Hardware Layer 详解 Android Systrace 基础知识 -- 分析 Systrace 预备知识 Android Systrace 基础知识 - SystemServer 解读 Android Systrace 基础知识 -- Systrace 简介 Android Systrace 基础知识 -- Why 60 fps ? Android Systrace -- 系列文章目录 Android 新的流畅体验,90Hz 漫谈 利器 - 高效工具推荐 Android 无障碍服务导致的整机卡顿案例分析 2018 年度好物推荐 - 给辛勤工作的自己一点奖励 Android 系统开发源码环境搭建 陆奇:除了好代码,工程师怎样才算优秀? 程序员的修炼-08-阅读之美 程序员的修炼-07-游戏与编程 程序员的修炼-06-互联网那些事 程序员的修炼-05-了解你的用户 程序员的修炼-04-关于测试的一些思考 程序员的修炼-03-Web 设计原则 程序员的修炼-02-编程之道 程序员的修炼-01-绝地反击之术 Android 系统不释放内存吗? 关于 Android 系统流畅性的一些思考 知乎 救救你的 StartingWindow 「置顶」Android 性能优化必知必会 2017 年度好物推荐 - 给辛勤工作的自己一点奖励 2017 Android Bottom navigation 规范二:样式、行为与规格 Android Bottom Navigation 规范一:使用方法 Android 中如何计算 App 的启动时间? Android 应用启动优化:一种 DelayLoad 的实现和原理(下篇) Android 应用启动优化 - 一种 DelayLoad 的实现和原理(上篇) Android hwui 中 RenderThread 工作流程 Java7 HashMap 源码分析 Android 代码内存优化建议 - OnTrimMemory 优化 Android 代码内存优化建议 - Android 资源篇 Android 代码内存优化建议 - Android 官方篇 Android 代码内存优化建议 - Java 官方篇 Nexus6 with Android M 开启多窗口模式 细说 Java 单例模式 Android 性能优化典范 - Understanding VSYNC
Android 性能优化典范 - Profile GPU Rendering
Gracker · 2015-04-19 · via Android Performance

系列文章目录:

  1. Android性能优化典范综述
  2. Android性能优化典范之Render Performance
  3. Android性能优化典范之Understanding Overdraw
  4. Android性能优化典范之Understanding VSYNC
  5. Android性能优化典范之Profile GPU Rendering

“If you can measure it, you can optimize it” is a common term in the computing world, and for Android’s rendering system, the same thing holds true. In order to optimize your pipeline to be more efficient for rendering, you need a tool to give you feedback on where the current perf problems lie.

And in this video, +Colt McAnlis walks you through an on-device tool that’s built for this exact reason. “Profile GPU Rendering” will help you understand the stages of the rendering pipeline, and also get a chance to see what portions of it might be taking too long, and what you can do about it for your application.

GPU Profile工具

渲染性能问题往往是偷取你宝贵帧数的罪魁祸首,这种问题很容易产生,很容易出现,而且在一个非常方便的工具的帮助下,也非常容易去追踪. 使用Peofile GPU Rendering tool,你可以在手机上就可以看到究竟是什么导致你的应用程序出现卡顿,变慢的情况.

Profile GPU Rendering 现在仍然适合做现场快速判断:柱子高,说明某段 UI 路径有明显帧耗时。但它只能给出按阶段聚合后的屏上信号,不能还原 App 帧、SurfaceFlinger 合成、CPU 调度、Binder/I/O 和 GPU 等待之间的因果。今天的流程应是先用它发现“哪段操作不稳”,再抓 Perfetto/System Trace 看 Frame Timeline 和线程状态;如果要防回归,则用 Macrobenchmark FrameTimingMetric 固化这段操作,而不是靠肉眼观察柱状图。

这个工具在设置-开发者选项-Profile GPU rendering选项,打开后选择on screen as bars:
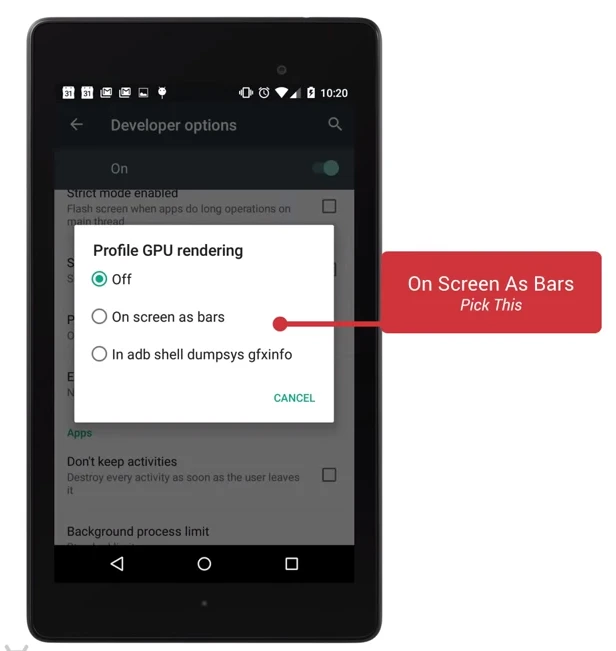
Profile GPU rendering

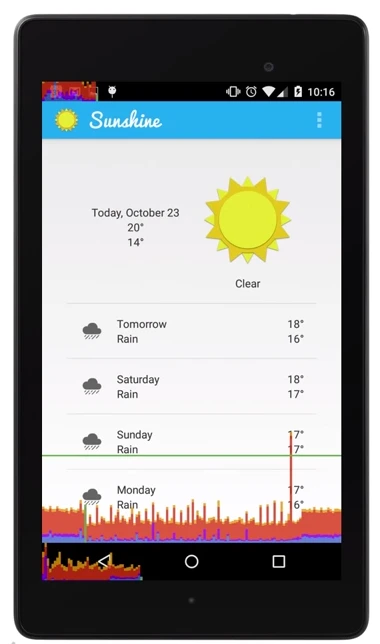
然后手机屏幕上就会出现三个颜色组成的小柱状图,以及一条绿线:

gpu工具

这个工具会在屏幕上显示经过分析后的图形数据,最底部的图显示的是Navigation的相关信息,最上面显示的是Notification的相关信息,中间的图显示的是当前应用程序的图.

使用GPU Profile工具

当你的应用程序在运行时,你会看到一排柱状图在屏幕上,从左到右动态地显示,每一个垂直的柱状图代表一帧的渲染,越长的垂直柱状图表示这一帧需要渲染的时间越长.随着需要渲染的帧数越来越多,他们会堆积在一起,这样你就可以观察到这段时间帧率的变化.

绿线

下图中的绿线代表16ms,要确保一秒内打到60fps,你需要确保这些帧的每一条线都在绿色的16ms标记线之下.任何时候你看到一个竖线超过了绿色的标记现,你就会看到你的动画有卡顿现象产生.
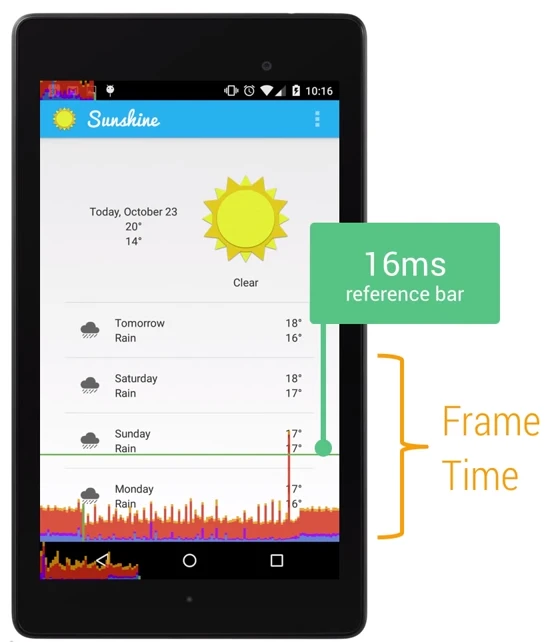
绿线

柱状图

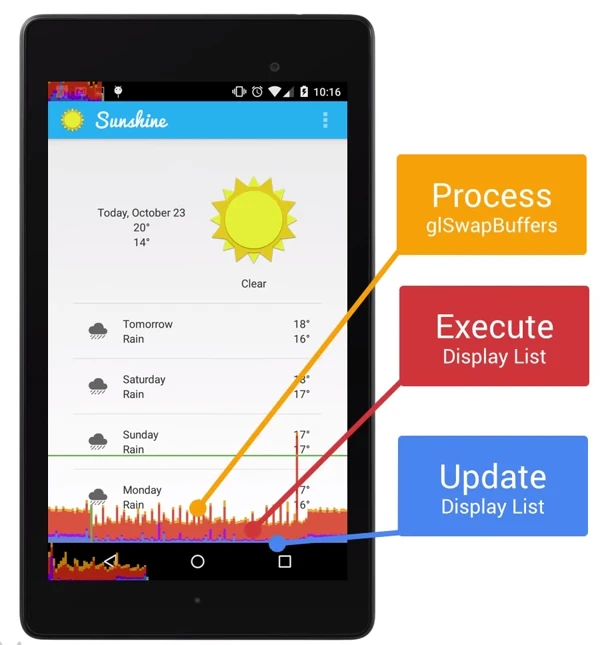
每一条柱状图都由三种颜色组成: 蓝-红-黄. 这些线直接和Android的渲染流水线和他实际运行帧数的时间关联:
柱状图

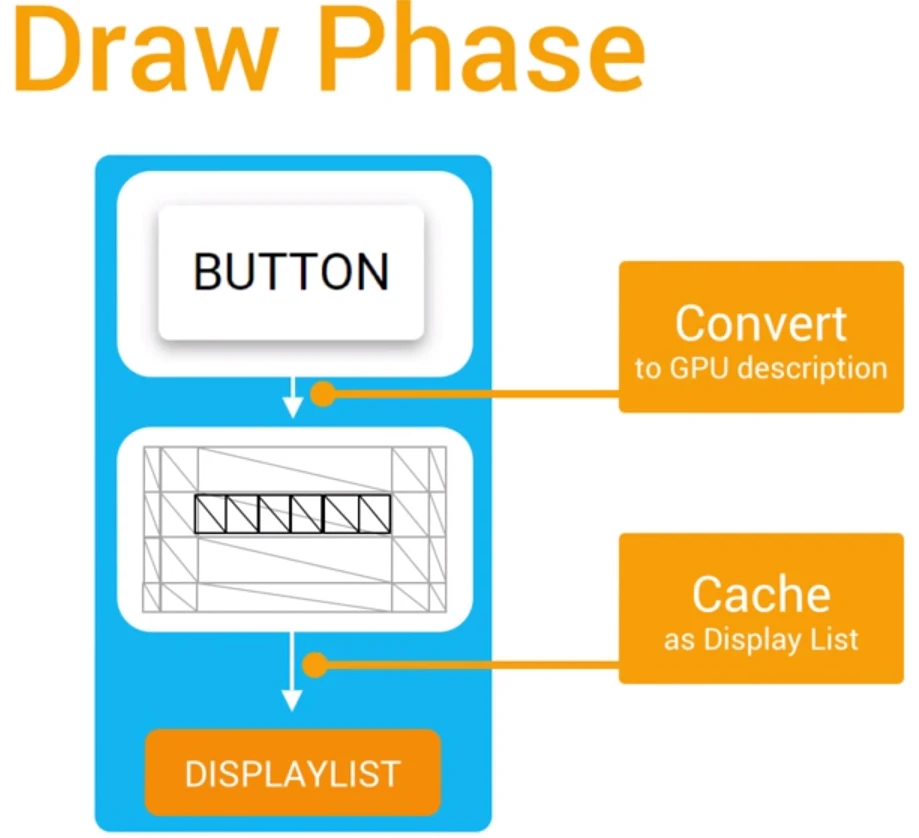
  • 蓝色代表测量绘制的时间,或者说它代表需要多长时间去创建和更新你的DisplayList.在Android中,一个视图在可以实际的进行渲染之前,它必须被转换成GPU所熟悉的格式,简单来说就是几条绘图命令,复杂点的可能是你的自定义的View嵌入了自定义的Path. 一旦完成,结果会作为一个DisplayList对象被系统送入缓存,蓝色就是记录了需要花费多长时间在屏幕上更新视图(说白了就是执行每一个View的onDraw方法,创建或者更新每一个View的Display List对象).
Draw Phase

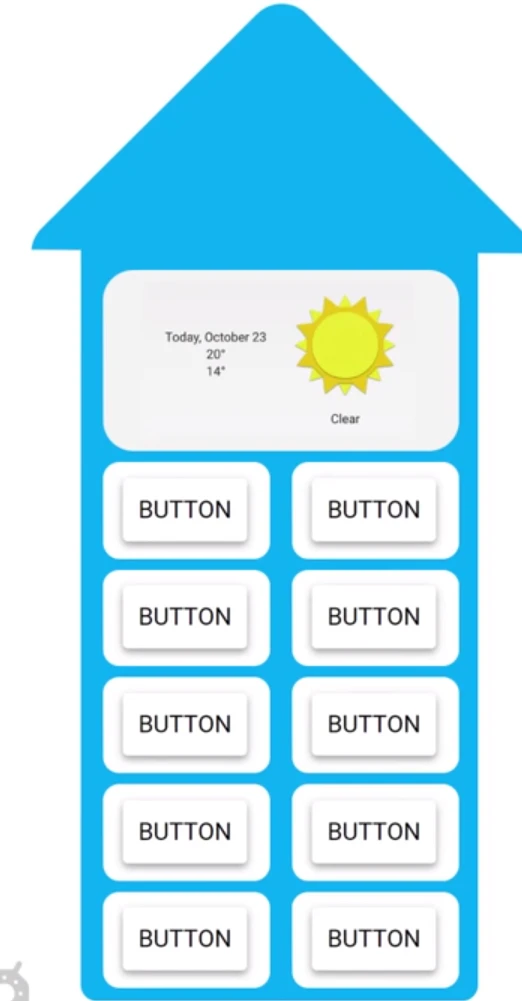
当你看到蓝色的线很高的时候,有可能是因为你的一堆视图突然变得无效了(即需要重新绘制),或者你的几个自定义视图的onDraw函数过于复杂.
自定义视图

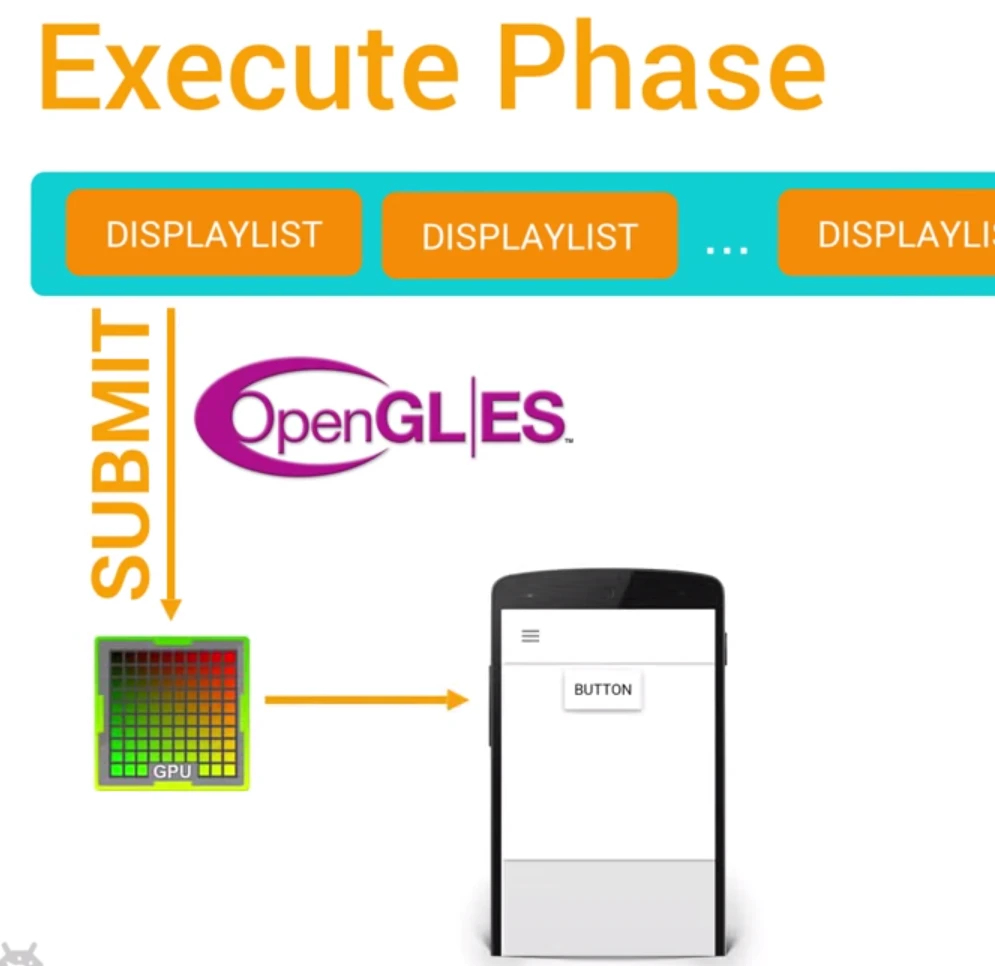
  • 红色代表执行的时间,这部分是Android进行2D渲染 Display List的时间,为了绘制到屏幕上,Android需要使用OpenGl ES的API接口来绘制Display List.这些API有效地将数据发送到GPU,最总在屏幕上显示出来.
红色

记住绘制下图这样自定义的比较复杂的视图时,需要用到的OpenGl的绘制命令也会更复杂
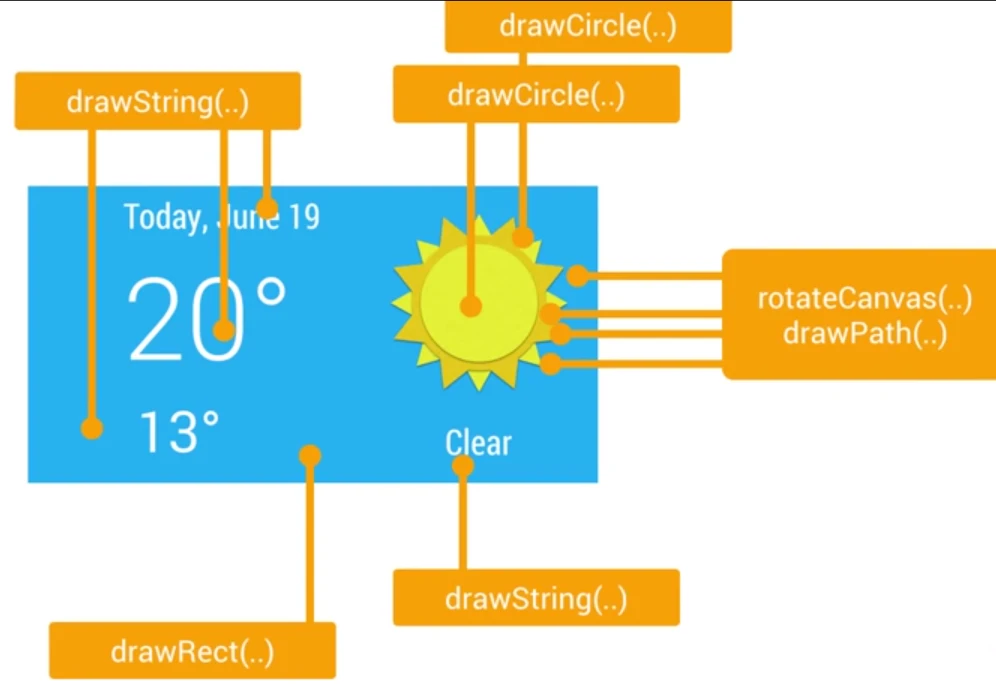
自定义的复杂View

当你看到红色的线非常高的时候,这些复杂的自定义View就是罪魁祸首:

Paste_Image.png

值得一提的是,上面图中红色线较高的一种可能性是因为重新提交了视图而导致的.这些视图并不是失效的视图,但是有些时候发生了某些事,例如视图旋转,我们需要重新清理这个区域的视图,这样可能会影响这个视图下面的视图,因为这些视图都需要进行重新的绘制操作.

  • 橙色部分表示的是处理时间,或者说是CPU告诉GPU渲染一帧的地方,这是一个阻塞调用,因为CPU会一直等待GPU发出接到命令的回复,如果柱状图很高,那就意味着你给GPU太多的工作,太多的负责视图需要OpenGL命令去绘制和处理.

保持动画流畅的关键就在于让这些垂直的柱状条尽可能地保持在绿线下面,任何时候超过绿线,你就有可能丢失一帧的内容.

总结

GPU Profile工具能够很好地帮助你找到渲染相关的问题,但是要修复这些问题就不是那么简单了. 你需要结合代码来具体分析,找到性能的瓶颈,并进行优化.

有时候你可以以这个为工具,让负责设计这个产品的人修改他的设计,以获得良好的用户体验.

Perf Matters

keep calm, profile your code, and always remember, Perf Matters

关于我 && 博客

下面是个人的介绍和相关的链接,期望与同行的各位多多交流,三人行,则必有我师!

  1. 博主个人介绍 :里面有个人的微信和微信群链接。
  2. 本博客内容导航 :个人博客内容的一个导航。
  3. 个人整理和搜集的优秀博客文章 - Android 性能优化必知必会 :欢迎大家自荐和推荐 (微信私聊即可)
  4. Android性能优化知识星球 : 欢迎加入,多谢支持~

一个人可以走的更快 , 一群人可以走的更远

微信扫一扫