







Note: This is substantially updated from the first version. I’ve made some more conservative calculations and narrated a bit more about what I think the Faros data is saying.
This is a continuation of the discussion in How I’m thinking about the value of LLMs. I’m arguing elsewhere that LLMs will never be geniuses. This is not part 2 of The Ontology Argument.
In How I’m thinking I said I wasn’t ready to take a stance on LLM value creation. That changes in this post. Here is the stance I’m taking:
It’s likely, at scale, use of LLMs is destroying value in the software industry.
My stance originates from stumbling on Faros.ai - a software development telemetry firm. They have products that pipe into common development tools like Jira, Github, and CI/CD pipelines to directly measure major operational metrics for software development teams.
Faros published a report in March that directly compares the output of customers using LLMs in their software development process vs those that are not. 22,000 developers, 4000 teams in the sample.
This is, by far, the best data I’ve been able to locate that directly measures the operational impact of use of LLMs in the software development process.
It’s bad.
Really, really, really bad.
I’m going to give you the headline conclusions now from my analysis:
Faros’ customers, at the peak of their AI use are shipping less software into production. Maybe 50% less. It could be worse than that.
On average, Faros’ customers’ bottleneck is located in the review stage of their software production process.
Faros’ customers - on average - are trading off developer productivity for product quality. This trade is a bad one. On average - it’s likely destroying value.
The whole report is worth a read, but I’m going to cover just three major headline conclusions.
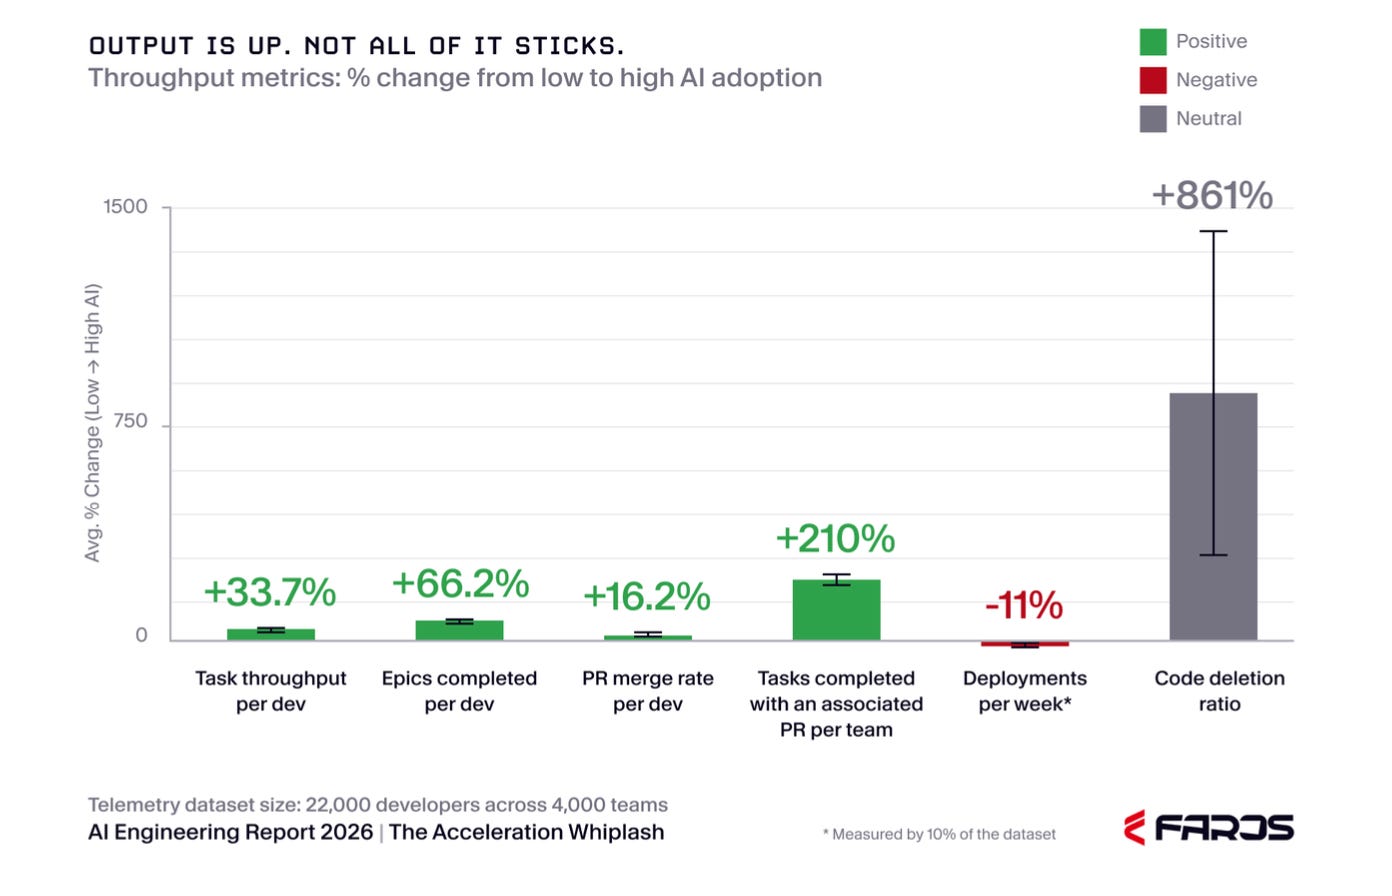
I think this supports what I said in How I’m thinking - there is clearly an individual productivity speedup that happens with LLMs. Although, I will say - it doesn’t look like it’s 10x. It’s like 1.33x. A much more modest improvement than what the optimistic AI case would tell you.
The canary in the coal mine is that -11% in deployment frequency. That’s a system level metric. It directly measures how often the firms are delivering value to their customers.
I won’t even touch that code deletion ratio. You can draw your own conclusions there.
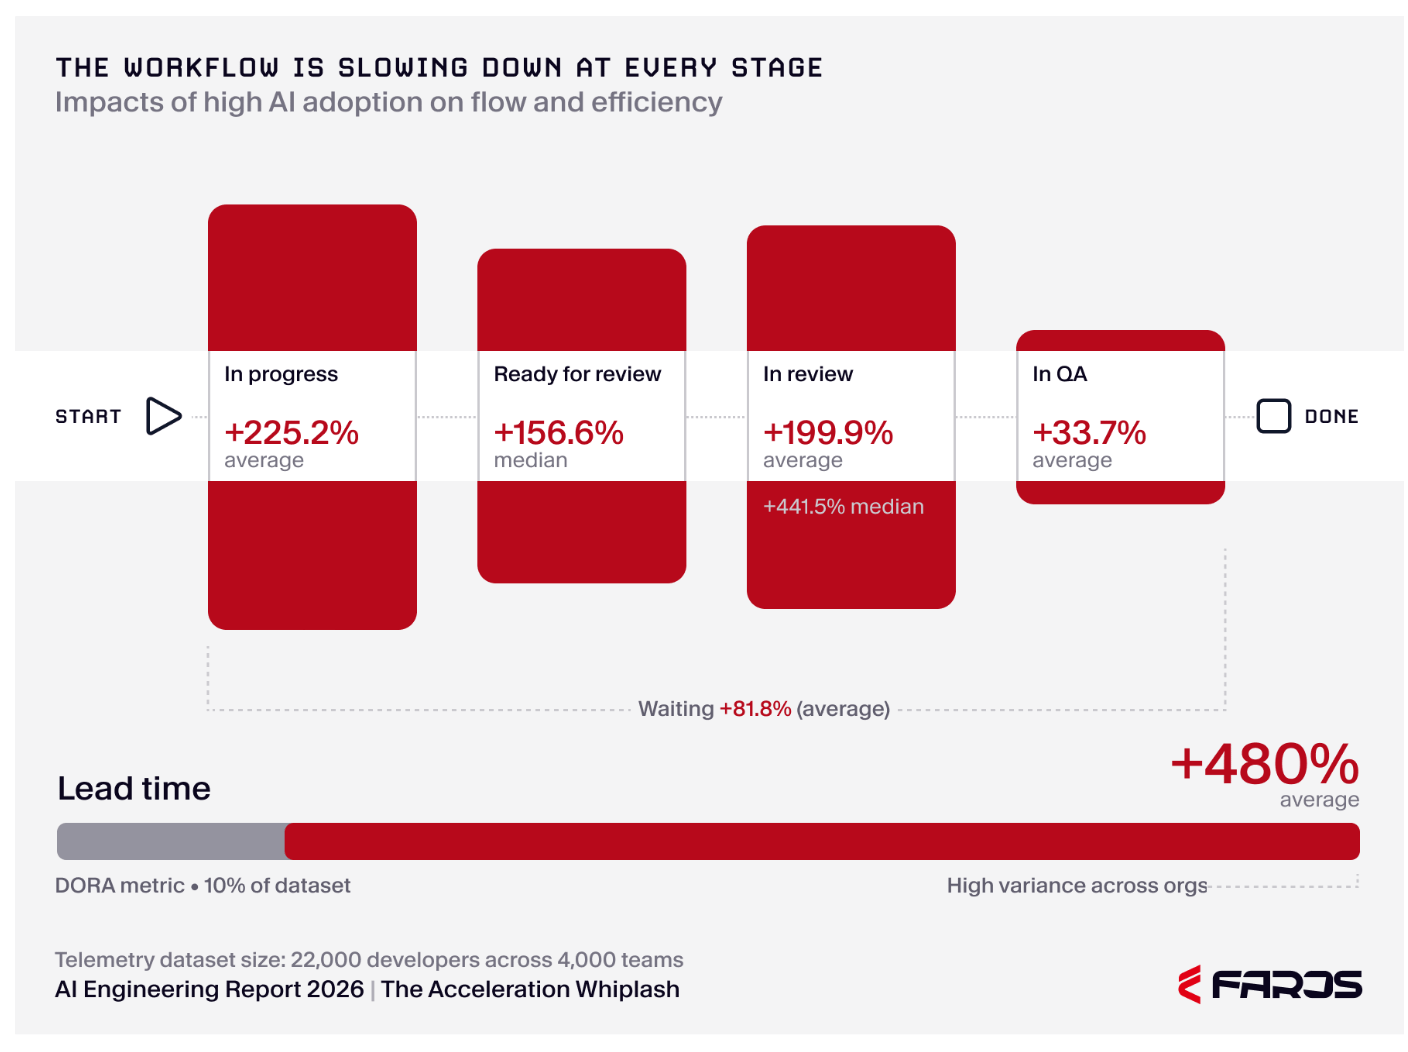
It’s hard for me to even put into words how bad this is. I’m truly in awe. I’m an AI skeptic and this is just much, much worse than I would have anticipated.
Imagine if Amazon prime adjusted their guaranteed delivery to 10 days. That’s essentially what some of Faros’ customers have done with LLMs to their product operations.
These metrics are a direct correlate to finished feature production. What this chart is saying is that a feature is taking somewhere between 80% (added wait time) to 480% longer to work its way through the product development process.
This has some absurdly stark implications which I’ll discuss in What is Happening, but we can’t get there until we discuss the worst outcome:
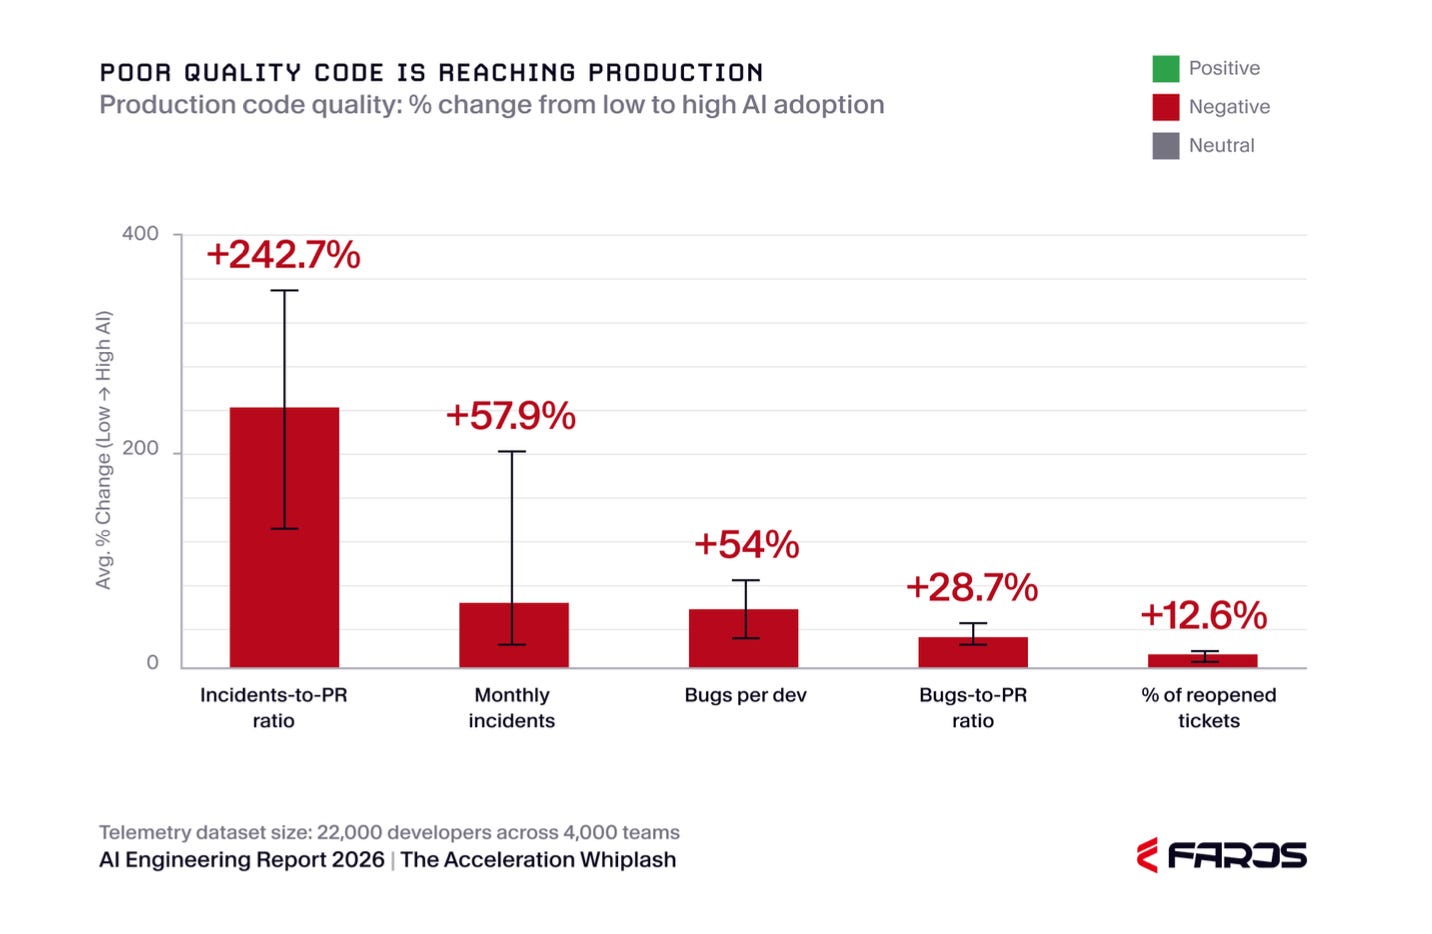
What more can be said here?
One thing operations taught me is to be skeptical of easy stories. I automatically disbelieve anyone selling “easier” operations. In my twenty professional years, the only thing I’ve seen is operations get better, not easier.
What’s the easy story the Faros data is telling about LLM use? That the software industry is producing more features at the expense of worse work in progress (WIP), lead time, and quality.
I don’t think that’s right. Generally those three things don’t move in opposite directions. That’s not to say the Faros folks have the wrong data or are lying. I actually think it’s the right data. I just think that story is the only narrative you can put on the data that doesn’t require a huge reconsideration of LLM’s utility. But, in my view, it’s obviously wrong.
Let me tell you what I think is happening.
The next section will rely on some basic ideas from queuing theory. My people, much like network engineers, love queuing theory. It tells you super important things about operations. Faros is intentionally measuring queue metrics, so we need just a bit of theory to make sense of it.
There are three things that matter in a classical queue:
Throughput:How much stuff is flowing through it in a specific period of time?
Work in progress (WIP): How much stuff is in it?
Lead time: how long does it take the stuff to traverse the queue?
Let’s look at an example1:

A old timey bank teller situation.
In this case the WIP is obvious, there are five people in the line.
Notice something else - the person at the back of the line is going to wait longer than the person at the front of the line. How much longer?
Let’s assume that it takes about 5 minutes for the teller to do her job with each person and she just started with that nice lady at the beginning.
That guy in back then is going to wait:
\(5\,\text{min/person} \times 5\,\text{people} = 25\,\text{min}\)
We can repeat that operation to compute an average lead time for the whole line:
\(\bar{L} = \frac{1}{5}\left( 5\cdot 1 + 5\cdot 2 + 5\cdot 3 + 5\cdot 4 + 5\cdot 5 \right)\,\text{min} = 15\,\text{min}\)
The throughput is just the 5 minutes it takes the teller to work with each customer inverted - i.e. 1 customer every five minutes.
Let’s say the teller is better at her job than we thought and her processing time is actually 3 minutes (in throughput: 1 customer every 3 minutes). Then with the same WIP, guy in back should only expect to wait:
\(3\,\text{min/person} \times 5\,\text{people} = 15\,\text{min}\)
And the whole line’s lead time goes to:
\(\bar{L} = \frac{1}{5}\left( 3\cdot 1 + 3\cdot 2 + 3\cdot 3 + 3\cdot 4 + 3\cdot 5 \right)\,\text{min} = 9\,\text{min}\)
Why doesn’t the WIP go down? That’s just an an artifact of the example picture. See, in real life, if the teller was going faster - when that guy in back arrived, he probably would only have 3-4 people in front of him, making WIP less too.
That gives you some intuition for why lead time, throughput, and WIP move together. The lower the throughput, the more stuff in the queue, the more items to average over to get lead time. The inverse also holds. So, things get better or they get worse together.
That’s why it’s suspicious to say “throughput” of the developers is going up, but lead times are big up and WIP is up.
Also, it shows you that the way Faros is thinking about “throughput” is not “throughput” - do you see a period of time in their measures of “throughput”? You don’t. You see a productivity measure - i.e. how much stuff a single person is producing.
It took physical manufacturing a long time to realize this, but you could almost call this a fundamental law of operations: Productivity != throughput.
Or, in a more common framing: motion is not progress.
There’s a variable we omitted from our bank teller example. Let’s look at a diagram:
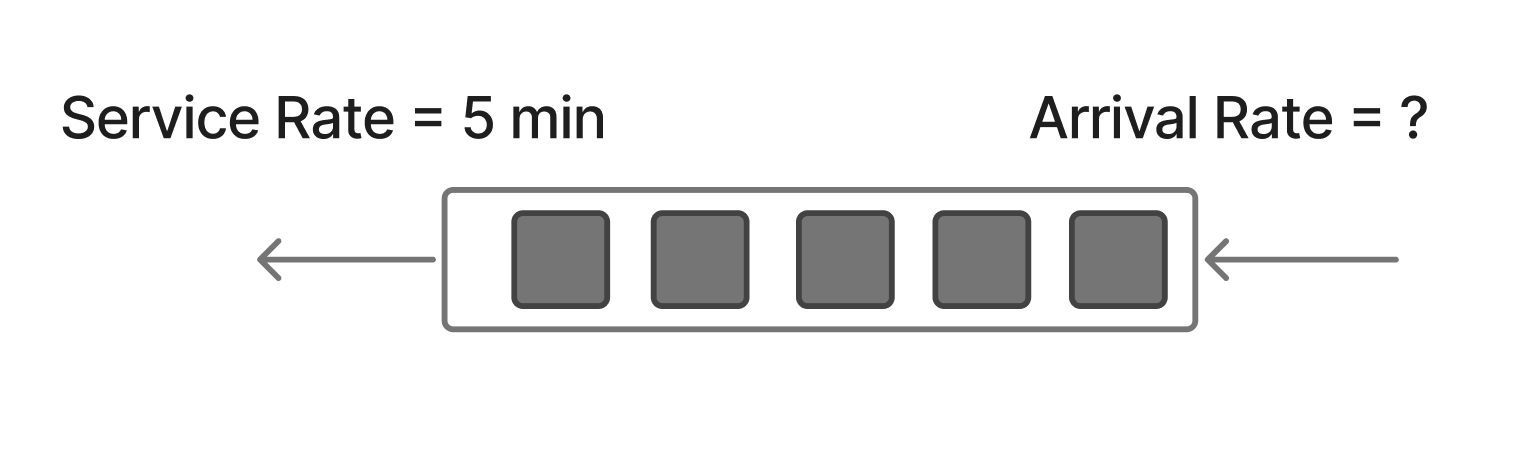
What I gave you before for throughput is actually the service rate - how fast the teller can work. What I didn’t give you is the arrival rate - how fast the customers are arriving. In the example given it didn’t matter because at that point in time the service rate was equivalent to the instantaneous throughput because a queue had formed.
But, what if we had looked at the line when the bank first opened? Maybe customers were only arriving once every fifteen minutes? Then the throughput would have been driven by the customer arrival rate - 1 customer per fifteen minutes.
So there is this interplay where arrival rate sometimes dominates queue behavior and sometimes service rate dominates queue behavior. There are two domains:
service rate > arrival rate - then your throughput is - on average - the arrival rate.
service rate < arrival rate - then your throughput is the service rate.
These two are not equivalent from an operations perspective. You always want (1). (2) - if sustained for long enough - is a black hole of death. I’ll show you why.

In (2), the line just gets longer and longer i.e. WIP explodes. Lead times blow up. People get frustrated. The servers get overtaxed and start to slow down. This happens to you every time you go to the grocery store and there’s a long line for one check out counter. You hate that. Everybody does.
If, as a business, you’re managing something like feature delivery to customers and you get into state (2) with your product development pipeline, your delivery timelines get longer and longer and longer. Customers start to get frustrated. It gets harder to realize revenue because - I cannot emphasize this enough - people only continue to pay for stuff that is done and delivered. Just like you only pay for an Amazon package once it’s on your doorstep.
Sure, you can lie and say you’ll deliver it, but people get wise after the first couple of times. Then they stop paying you.
Between (1) and (2), which domain do you think the Faros data indicates the software industry is in with LLM use?
Let me just return your attention to a figure here.
That’s why I said it’s hard for me to put into words how bad this is. But, to quote Khabib Nurmagomedov, “Let’s talk now”.
The Faros data clearly indicates that broadly across their customer base - they’re in domain (2). Look, I’ll show you.
The following is based on a straightforward application of Little’s Law - the ur-law of queuing theory. I have a technical appendix explaining some of this. The main thing you need to to understand is, the lead time and WIP estimates in the data, if they were in domain (1), would agree with the developer “throughput” improvements. If they disagree, you’re in domain (2). So let’s see.
First, let’s define the “stuff” that’s in the queue. There are two candidates in the data.
Pull requests (PRs) - for those of you who don’t speak software dev - code blocks that add features or fix bugs in a software product.
Task tickets - like from Jira and AzureDevOps - second order data that describes the work to be done in the pull requests.
We can use the data in this figure to capture an idea of WIP increase:
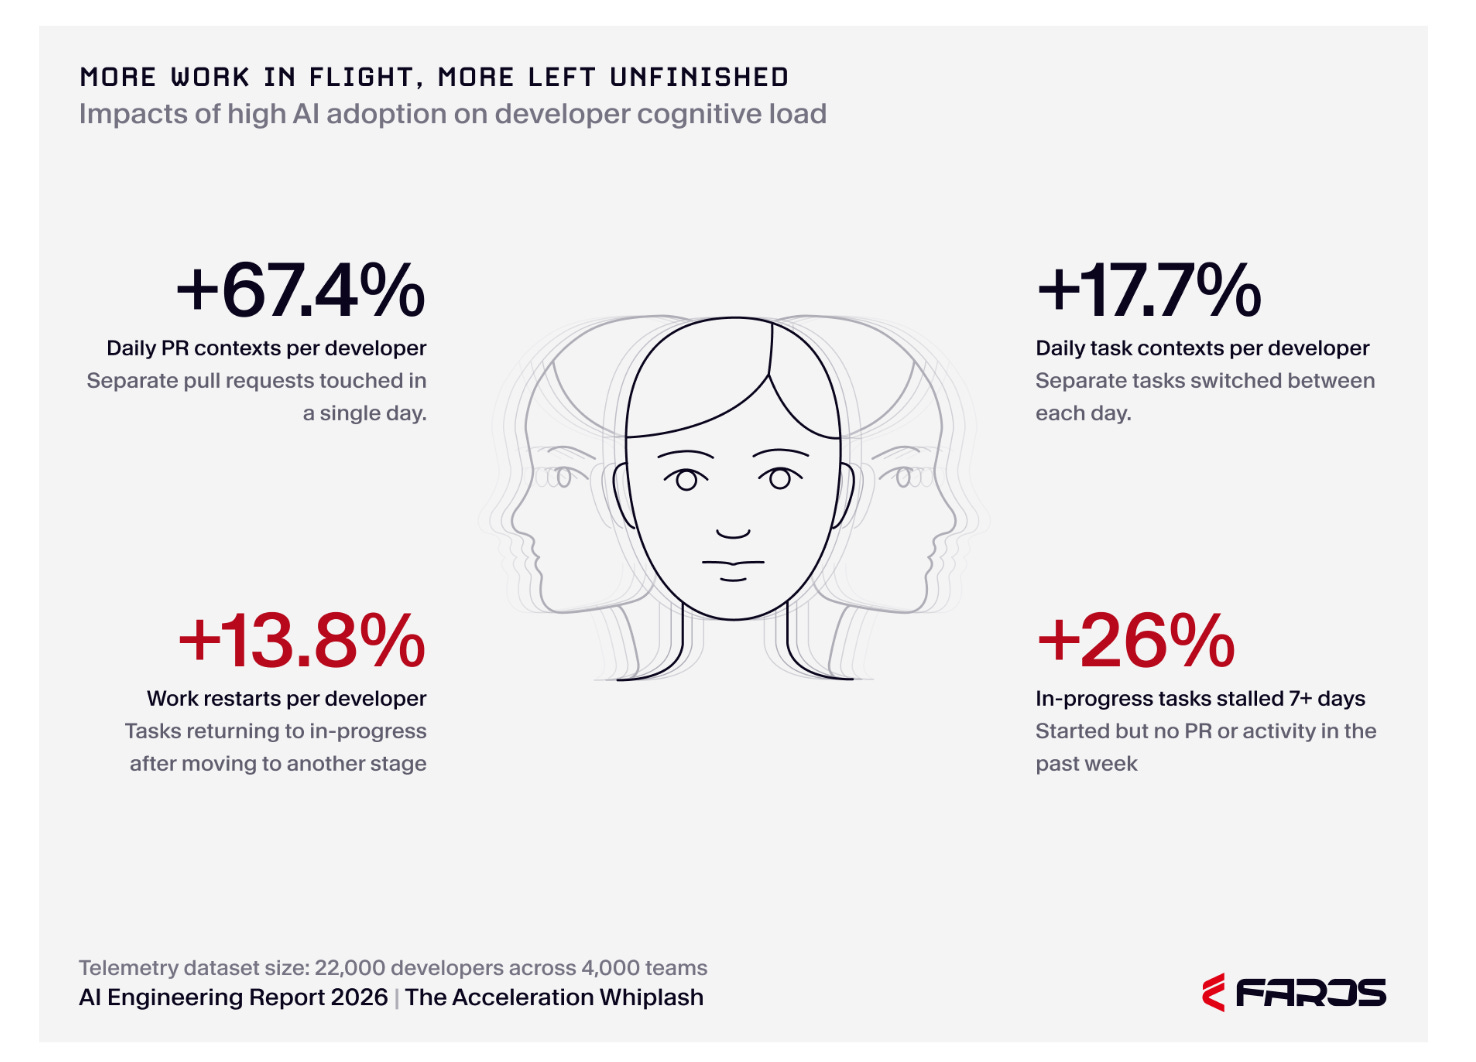
For PRs, we have 67% increase in WIP, for tasks we have a 18% increase in WIP. These, I would argue, are lower bounds on WIP increase. Meaning the calcs we’re about to do are conservative.
Now we need lead times. For pull requests, there’s two numbers we can use. That 80% figure of wait time in the workflow slowdown figure - that’s based on the full dataset so it’s a solid number and super conservative. The wait time is only a fraction of the full lead time that’s been added to the PRs. We can also use that 480% number that is more true to pull requests, but is only representative of 10% of the dataset2. To me, I find it highly likely that that 480% number is representative, but we don’t have to chose.
For 80% increase in wait time for PRs, we have:
\(\frac{\text{Throughput}_{\text{LLM}}}{\text{Throughput}_{\text{NoLLM}}} = \frac{\text{Lead Time}_{\text{NoLLM}}}{\text{Lead Time}_{\text{LLM}}} \cdot \frac{\text{WIP}_{\text{LLM}}}{\text{WIP}_{\text{NoLLM}}} = \frac{1.66}{1.80} = 92\%\)
Even in the best case we’re going to talk about - a fictional best case because the lead time must be up by more than that 80% wait time - the implied throughput for high LLM use is down by 8%. It’s only going to get worse from here.
For the 480% increase in wait time for PRs, we have:
\(\frac{\text{Throughput}_{\text{LLM}}}{\text{Throughput}_{\text{NoLLM}}} = \frac{\text{Lead Time}_{\text{NoLLM}}}{\text{Lead Time}_{\text{LLM}}} \cdot \frac{\text{WIP}_{\text{LLM}}}{\text{WIP}_{\text{NoLLM}}} = \frac{1.66}{5.80} = 29\%\)
Crazy man, just crazy.
Let’s do it for the tasks now.
The data is silent on how WIP is distributed between the different stages of In Progress, Ready for Review, In Review, and QA. Let’s just assume a flat distribution and calc an arithmetic average.
\(\bar{\text{Lead Time}}_{ratio} = \frac{1}{n}\sum_{i=1}^{n} \frac{\text{Lead Time}_i^{LLM}}{\text{Lead Time}_i^{NoLLM}} = \frac{3.252 + 2.566 + 2.996 + 1.337}{4} = 2.54\)
Now we can just do the math:
\(\frac{\text{Throughput}_{\text{LLM}}}{\text{Throughput}_{\text{NoLLM}}} = \frac{\text{Lead Time}_{\text{NoLLM}}}{\text{Lead Time}_{\text{LLM}}} \cdot \frac{\text{WIP}_{\text{LLM}}}{\text{WIP}_{\text{NoLLM}}} = \frac{1.18}{2.54} = 46\%\)
In all cases, the implied throughput of the data show a degradation of throughput, so it’s wildly out of alignment with the “throughput” developer data. Devs are doing more, but the shops are shipping less per unit of time.
Hard to believe? Don’t worry, I’m not done.
Here’s the first headline conclusion for you though:
Faros’ customers, at the peak of their AI use are shipping less software into production. Maybe 50% less. It could be worse than that.
There is a famous book in operations lore - The Goal. It’s one of those weird business parable books. It tells the story of a young factory manager who has to learn that single station productivity does not equate to finished good production - emphasis again - the stuff people pay for.
That’s unintuitive for most people. People think “oh if I just make this one step in this process more efficient, the whole thing will go faster”. But that’s not right.
Think about a funnel.

As you start to pour water into a funnel, if you go slow enough, how much water you’re pouring determines how fast the fluid moves through the funnel. Start to pour more though, then the funnel’s mouth takes over and limits the flow rate to what the mouth can handle. That water that builds up in the top of the funnel? Yeah, that’s a queue. Domain (2).
Thing is, there’s always a step in any process that’s like the mouth of the funnel. And the thing about queues is that if you make stuff upstream of the “mouth” - the appropriately named bottleneck - more efficient, you don’t make the system able to flow more water. It’s like widening a funnel at the top, keeping the mouth the same size, and expecting more stuff to flow through the mouth. It just doesn’t make any sense.
When you pour more water into the funnel than can flow through the mouth, water builds up in the cone. That happens in production systems too. Work in progress builds up in the system. And that has costs. It clogs the system. Makes everyone frustrated. You’re standing in that line wondering what the holdup is.
The Faros data strongly indicate that writing code is not the bottleneck in the software development processes of their customers. Review is.
Why do I say that? Three lines of evidence:
Ready for Review and In Review in the slowdown figure are big up.
People are skipping it! To the tune of 31% more often! Classic human behavior. When we hit a bottleneck in a process, we try to jump it. Look at this figure:
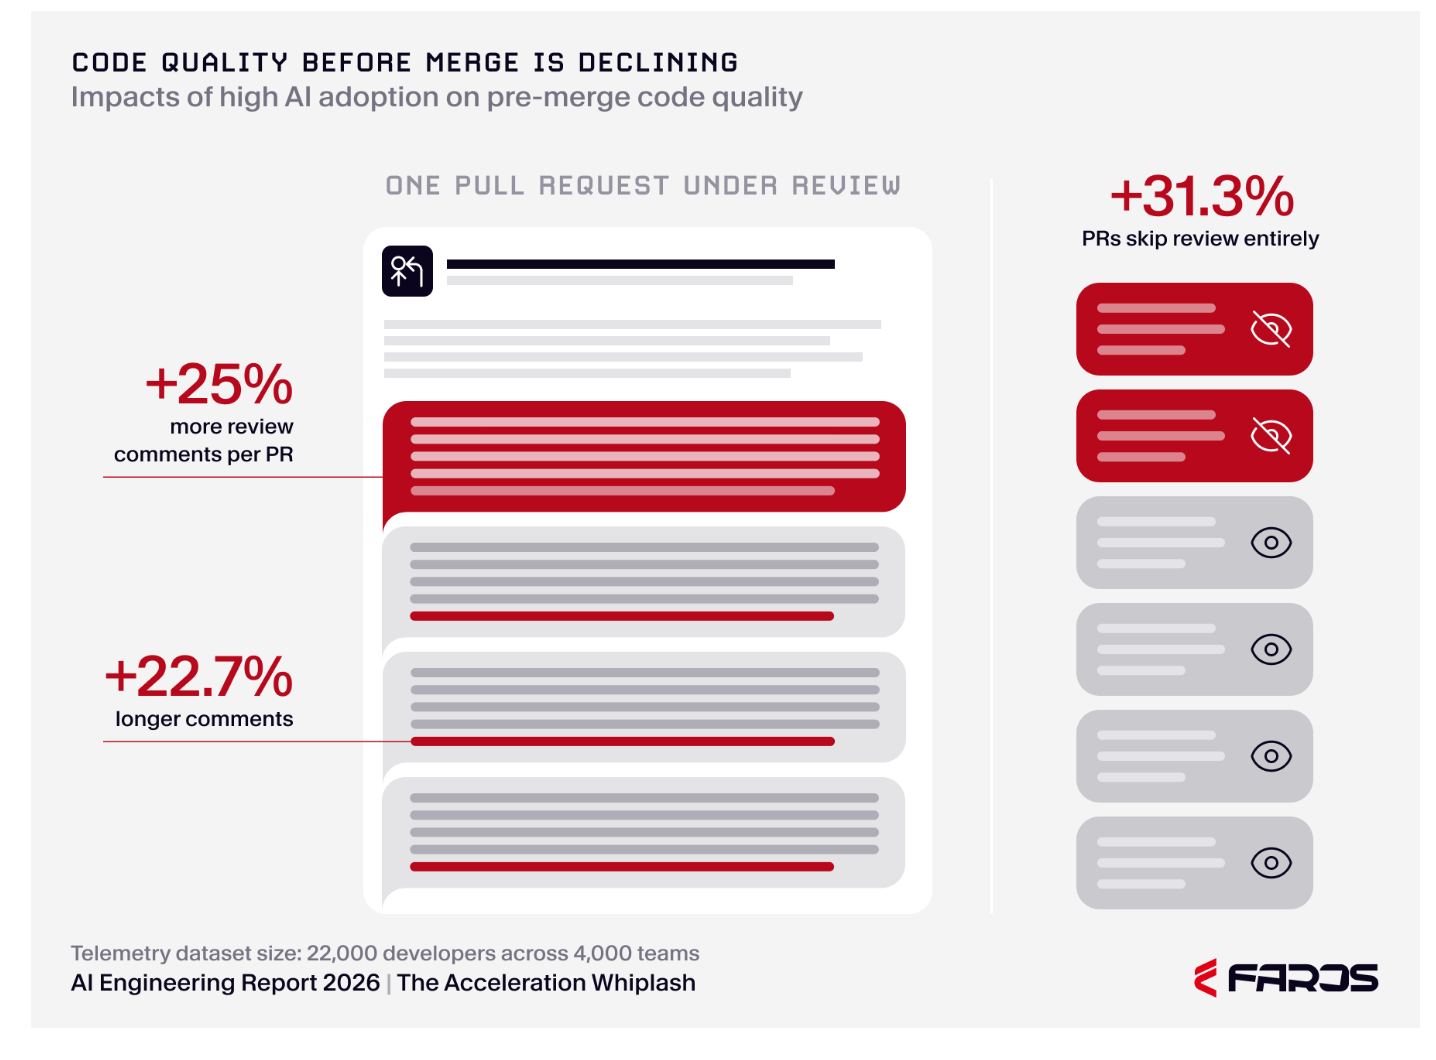
3. Faros says this directly in the report: "Organizations are generating more code than the system can review and merge." This is meaningful because Faros has access to the whole dataset.
This finding would likely be unintuitive to anyone who worked in a software development process pre LLMs. Review traditionally has not been the perceived bottleneck. Figuring out what to build and then building it has been. It’s like LLM use moved the bottleneck downstream to review.
Today, this aligns with people’s intuitions of what LLMs are doing to the process. The main benefit here of the Faros data is providing empirical confirmation of these intuitions.
Here’s the next headline conclusion:
On average, Faros’ customers’ bottleneck is located in the review stage of their software production process.
Poorly. Here, I’ll show you.
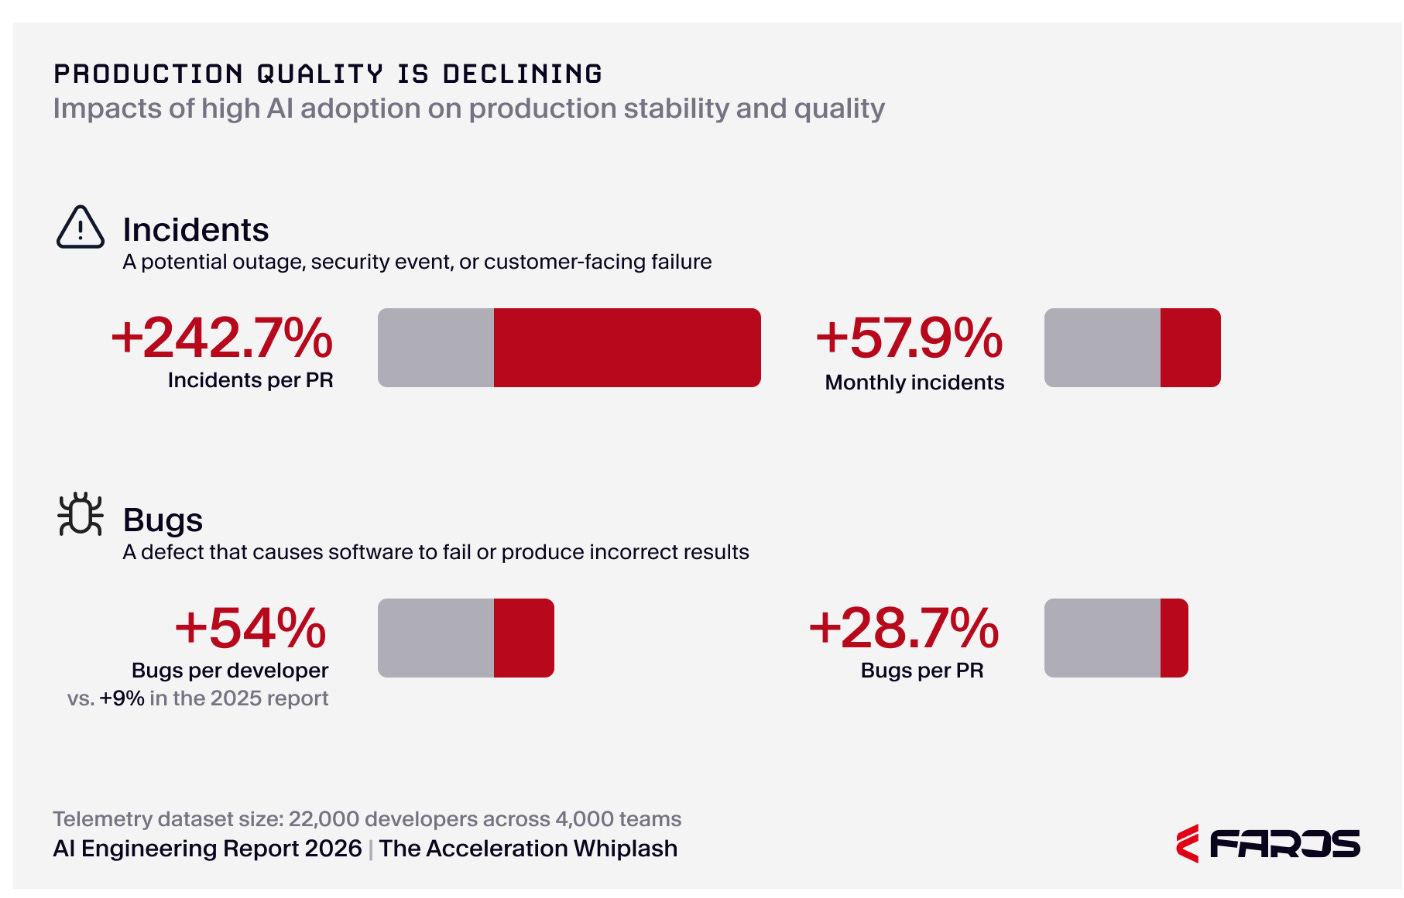
Why do you think the defect rate is up so high? Where do you think those defects are coming from?
Another bit of Operations lore: Toyota circa 1985 is lionized in the operations literature for being the machine that changed the world. It’s probably hard for you to imagine how much navel gazing and forced change Toyota inflicted on the American manufacturing industry in the 1990s3.
The thing that was weird about Toyota was that they focused rigorously on quality. That was really weird for American manufacturers. Quality has always been kind of a strange beast to the US. As consumers, we love quality - I mean Toyota beat the ever-loving-shit out of US automotive manufacturers in the 90s on our home turf.
But, as producers, man we’re much more skeptical of quality. That’s my perspective from working at the edge of value creation in our society for the past 20 years. Reasonable people will disagree.
I’ll give you an example. In a Toyota factory, one of the primary responsibilities of every worker is to not pass defects to the next station. They are super, uber serious about this at Toyota. Their culture has deeply internalized the idea that the earlier a defect is discovered and fixed, the less it costs the system as a whole. That’s also a common heuristic in the software industry as well:
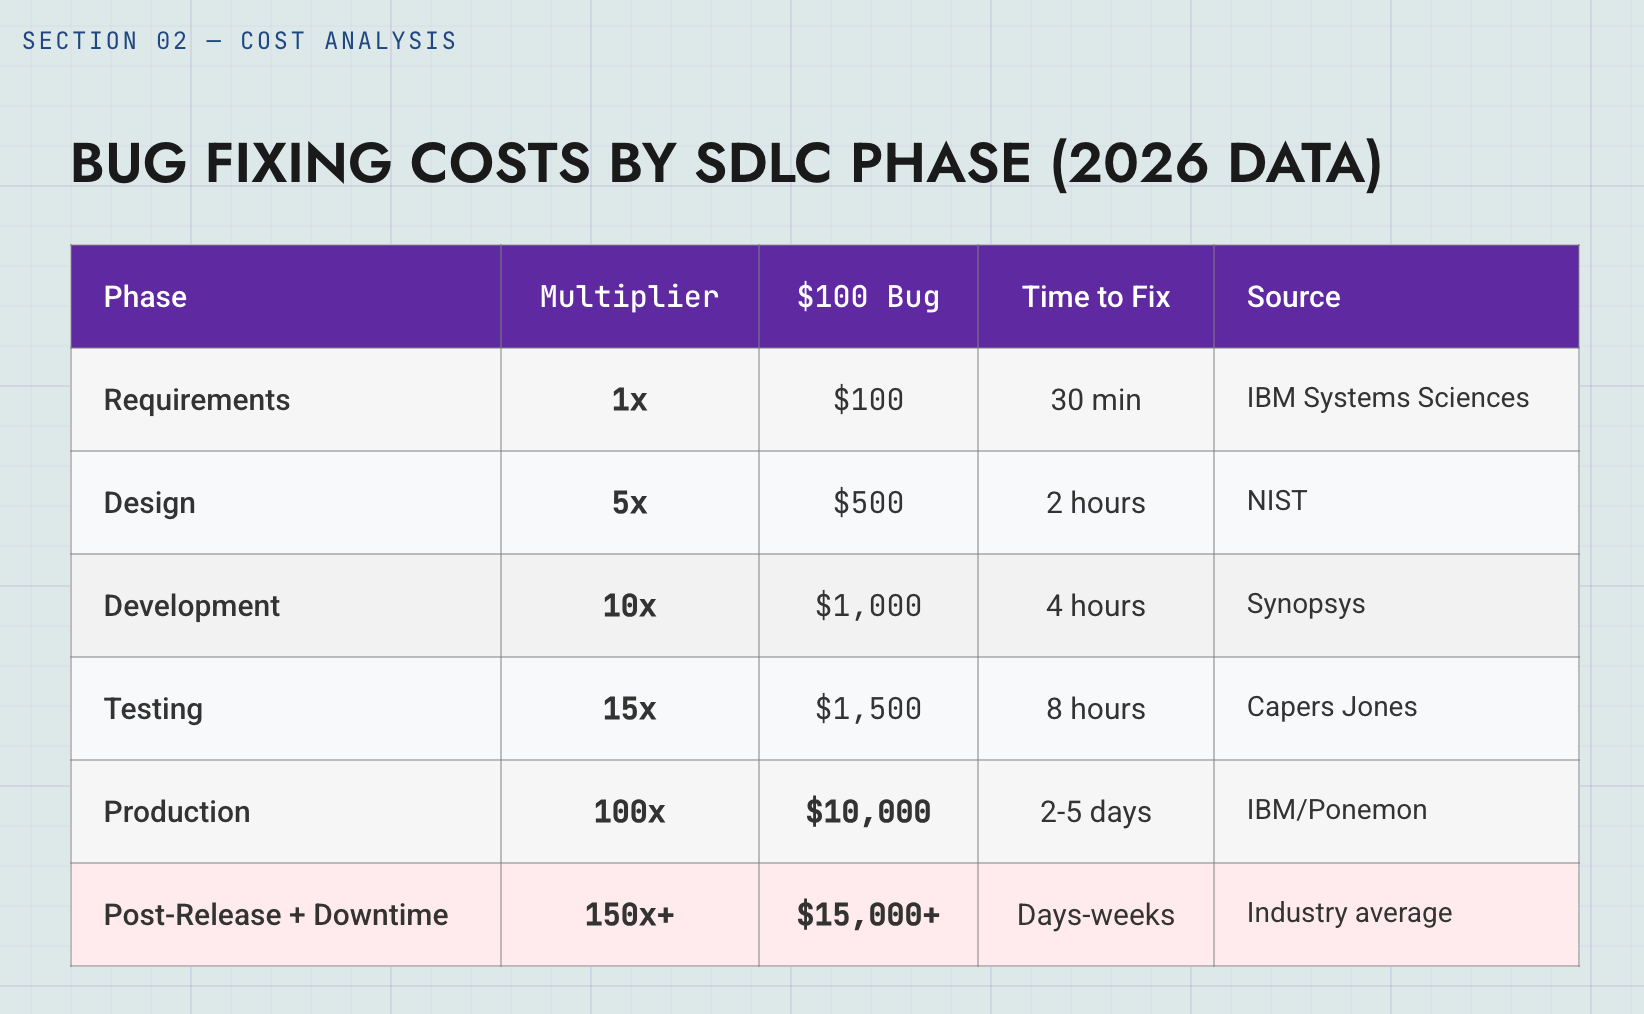
I call it a heuristic because I don’t think anyone really knows if this is right in a western scientific way. It’s super hard to measure these things rigorously. It’s more like a belief that guides what you prioritize.
The interesting thing about Toyota is they had all these wild practices: like Andon cords that any worker could use to stop an entire production line to troubleshoot and fix a defect. (Imagine that - any worker can stop the whole production line!)
To American eyes this looked like idealism run amuck. But Toyota laughed all the way to the bank. They crushed their competition on cost, throughput, flexibility, and quality. They did everything well. (Almost like how with queues things get all better or all worse - in fact exactly like that.)
This was deeply mysterious to American manufacturers. It made them uncomfortable. It violated some of their deepest intuitions about how to build things. As I mentioned before, they never really recovered. (Make no mistake - America lost the war for manufacturing. In my view, we didn’t even really fight.)
What does any of this have to do with LLMs? Well that depends on you.
Do you take seriously the idea that defects discovered later in a production process are exponentially more expensive to address the further they travel undiscovered?
If you don’t, you can stop now. Nothing further is going to convince you. Take your LLMs and go build the next hyper-scalar. We’re all waiting.
If you do take it seriously, I think the Faros data is telling you two really important things about what the use of LLMs is likely doing to your business.
First, it’s likely destroying value at an incredible rate. That productivity boost that your developers perceive? It’s actually quite small and modest, but it’s likely injecting an incredible amount of defects into your production pipeline that is driving re-work that is subtracting a meaningful amount from your capacity.
That’s hard to see because effects are distant. It’s easy to go fast when you’re not accountable to the second order impacts of your actions.
Second, something has been lost from the process of constructing software. The bottleneck moving from writing code to reviewing it is symptomatic of some important value creation being transitioned from the author to the reviewer. And, in my view, it’s clearly more effective for that step to sit with the creator, rather than the consumer.
Here’s your last conclusion:
Faros’ customers - on average - are trading off developer productivity for product quality. This trade is a bad one. On average - it’s likely destroying value.
Let’s deal with a few objections:
It’s reasonable to say “Faros is incentivized to say that things are bad - that’s how they sell”. But, the thing is - these are their customers! They can only present data from organizations using their tools. I don’t think they know what they have here. Their framing of developer throughput completely misses the broader point of finished feature production - which, I cannot emphasize enough, is the only thing that matters.
I think you would also have to believe they are lying about their numbers. If you do, I can’t go there with you. I trust them on that front.
You can certainly say here that correlation is not causation. Faros is doing something sophisticated though - they’re comparing within-company changes between each company’s lowest and highest AI adoption quarters, with per-company standardization. So it’s good observational study, but not causal.
The Faros report is interesting for all sorts of reasons that I don’t have the space or inclination to discuss, but there’s another fact that’s very interesting. They built some statistical models trying to figure out whether certain features of the organizations predicted worse outcomes. Here’s an amazing observation:
DORA’s 2025 State of AI-Assisted Software Development report concludes that AI amplifies existing strengths and weaknesses . . . Our telemetry data . . . does not support that as a protective factor. High-performing engineering organizations are experiencing the same downstream deterioration as everyone else.
Emphasis mine.
I think there are four lines of high quality data describing the impact of LLMs use on product development operations in the software industry.
Direct productivity studies
The shovelware data
The state of the DevOps reports for 2024 and 2025
Faros’ 2026 customer metrics
I covered 1-3 in How I’m thinking and 4 in this article.
I think these different lines paint a consistent picture: People are experiencing individual productivity benefits of using LLMs, but at the organizational level it’s not showing up. In the best case, these effects are neutral for finished good (completed features) throughput. In the worst case - supported by the most granular and direct data - the effects are slowing down system throughput - i.e. actively destroying value.
For quality - in my mind - there can be no best case or worst case. The data is unambiguous. Our use of LLMs is destroying product quality and hence enterprise value.
This thesis is showing up in the discourse around LLMs. You need only look at some recent articles to see people commenting on this effect.
For example, Azeem Azhar of Exponential View (a commentator I deeply respect) - just yesterday posted an essay discussing this issue. His view is that this dichotomy of individual productivity vs organizational effectiveness is a deployment problem. In his view, not enough has changed at the organizational level to fully realize value from the technology.
I think that’s wrong.
Azeem reaches for the deployment of the electrical grid as a historical comparison. His analogy being that new technology takes time for organizations to learn how to use and deploy properly. In electricity’s case it took about 30 years for that effect to show up in aggregate productivity statistics. Rearrange everything in the organization around the new tech, the argument goes, and then the system level productivity comes.
Here’s the difference I see - in every case where a radical new technology has revolutionized industry - manufacturing machines, plumbing, planes, electricity, computers, the internet, etc - there is an increasing trend of reliability. Each one of those foundational technologies started from a place of unreliability and moved to a place of very high reliability. They became foundational because humans learned to trust them implicitly.
This is not a limitation that can be overcome by LLMs. Their generative value is in their unreliability. If you turn temperature down to zero, you get a deterministic machine - but you also break the value proposition of every meaningful application I know of in production.
So this is inherent to the technology. No amount of tokenmaxxing is going to change it. LLM development even breaks common and well accepted quality norms in software development - like backwards compatibility. You literally can’t (and wouldn’t want!) an LLM to do the same thing in the same way twice. But this means, LLMs - on their own - are not a solid foundation to build a revolution on. They never can be.
I’ve been very careful in this post to use the term “how we use LLMs” rather than just “LLMs”. I think the personification of LLMs in our discourse is deeply damaging on a number of levels. Here it distracts from the fact that they are tools. They don’t think. They don’t have agency. They don’t do anything without you telling them to (If you disagree with this - I invite you to read Country of Kaleidoscopes in a Datacenter).
A tool is only as good as how a person wields it. And I do think a lot of us are wielding them in a way that is guaranteed to destroy value. In my experience, It’s very common for people to say things like “use the LLM to make the first draft and then edit it afterwards”.
I think that’s exactly backwards. The first draft of something is the core intellectual contribution you are making. The effort of making it shapes your thinking. It causes you to interact with the ideas and understand the structure of what you’re trying to communicate. To me, this is true in natural and formal language.
Your understanding of the structure is - in my mind - the main part of the value you’re producing by writing something. By first-drafting with an LLM I think you are essentially handing off the thinking to the person downstream of you. And, in the process, you’re handing off responsibility for the defects introduced by your work. I think you are also dramatically increasing the cost of addressing those defects. I think the Faros data says this very plainly.
After you get the first draft down - rough as it might be - the LLM is a great help in shaping it into something coherent. It can give you great feedback. And, as you delta the structure, you continue to hold the responsibility for what’s changing. If this was the dominant pattern of how we used LLMs, I think it would enormously increase the quality of our products and hence deliver value.
You may disagree with me. That’s fine. I’m just trying to tell you what I think. I’ve had this conversation with a lot of people over the past few weeks and I get a lot of reactions. My view is that people are having a hard time really looking at LLMs. And I have a thought about that too.
I think many people think that because LLMs talk, they are intelligent.
My formative professional development happened in the construction trades. A bit of wisdom from that domain may be medicinal here.
Talk is cheap.
The Faros data allows us - along with an assumption - to compute a range of finished feature throughputs implied by their data with an application of Little’s Law.
What we want is a Little’s Law computation for the whole system describing the percent change. So we have:
Wikipedia has a great explanation of this law that I can’t improve on:
In plain terms, the law says that the average number of items in a system (L) depends on both the rate at which items enter the system (\lambda) and the average time each item remains there (W). If items arrive faster, or if each item stays longer, the average number present increases proportionally.
(Ok, I did improve on it a bit by putting the symbols in the explanation.)
We can’t compute directly from the law stated because we’re dealing with percent changes. Fortunately, we also want a percent changes from NoLLM to LLM. So with some division and rearrangement we get:
\(\frac{\lambda_{\text{LLM}}}{\lambda_{\text{NoLLM}}} = \frac{W_{\text{NoLLM}}}{W_{\text{LLM}}} \cdot \frac{L_{\text{LLM}}}{L_{\text{NoLLM}}}\)
That’s our workhorse in the above discussion.