8 tiny LLMs benchmarked across 4 power modes on Jetson Orin Nano Super 8GB: llama.cpp vs Ollama. 25W sweet spot: 43% more tok/s than 15W, better tok/J than MAXN.
Platform: NVIDIA Jetson Orin Nano Super 8GB
CPU: 6-core Arm Cortex-A78AE · GPU: NVIDIA Ampere (1024 CUDA cores, 32 Tensor cores)
Memory: 8 GB LPDDR5 shared CPU+GPU · JetPack: R36.4.7 (L4T 36.4)
Backends: llama.cpp CUDA (-ngl 99, --no-cache-prompt) · Ollama (CUDA, matched quantizations)
Runs: llama.cpp - four full sweeps: 7W, 15W, 25W, MAXN_SUPER · Ollama - 7W, 15W, 25W, and MAXN complete
Sweep: prompt ∈ {128, 512, 1024, 2048} tok × gen ∈ {64, 128, 256} tok × 20 reqs/combo
Concurrency: 1 (single-user)
Key metric: output tok/J = OSL ÷ (decode_power_W × p50_decode_s) - decode-phase energy only
Raw data on Hugging Face - complete per-cell JSON exports (all 33 metrics, 12 prompt×gen combos × 20 requests per cell, profile_export_aiperf.json + tegrastats.log + server logs):
llama.cpp
| Mode | Dataset | Models | Cells |
|---|---|---|---|
| 7W | YuvrajSingh9886/jetson-non-reasoning-benchmark-7w |
8 | 96 |
| 15W | YuvrajSingh9886/jetson-non-reasoning-benchmark-15w |
8 | 96 |
| 25W | YuvrajSingh9886/jetson-non-reasoning-benchmark-25w |
8 | 96 |
| MAXN | YuvrajSingh9886/jetson-non-reasoning-benchmark-maxn |
8 | 96 |
Ollama
| Mode | Dataset | Models | Cells |
|---|---|---|---|
| 7W | YuvrajSingh9886/jetson-non-reasoning-benchmark-ollama-7w |
8 | 96 |
| 15W | YuvrajSingh9886/jetson-non-reasoning-benchmark-ollama-15w |
8 | 96 |
| 25W | YuvrajSingh9886/jetson-non-reasoning-benchmark-ollama-25w |
8 | 96 |
| MAXN | YuvrajSingh9886/jetson-non-reasoning-benchmark-ollama-maxn |
8 | 96 |
Githubrepo with all code, scripts, and plotting notebooks can be found here
- Version caveat: All results are specific to the tested software versions — llama.cpp build b9292 (commit
ef570f630, CUDA backend) and Ollama v0.24.0 (default GPU offload).- Ollama v0.24.0 was the only latest supported version that loaded all GGUFs (especially LFM2.5) across all eight models without failures on JetPack R36.4.7. Ollama v0.24.0 vendors llama.cpp at commit
ec98e2002(Dec 2025, ~5 months older than the standalone b9292 build) and was fixed in this version since the test was conducted in early June.
- In particular, Ollama’s GGML CUDA backend for LFM2.5 models may improve in future versions. Re-benchmark before drawing conclusions about current versions.
GPU offloading: Ollama loaded all models with 100 % GPU offload (confirmed via
ollama ps). No layers fell back to CPU. The performance gap is not caused by partial GPU offloading — it reflects differences in CUDA kernel efficiency and server overhead between the two backends at identical GPU utilisation.
Eight models were benchmarked across all four Jetson Orin Nano Super power modes under llama.cpp CUDA and, for a direct backend comparison, under Ollama (matched quantizations) at all four power modes. Each model ran 12 combinations of prompt × generation length (20 requests per combo) at every power mode where it could load.
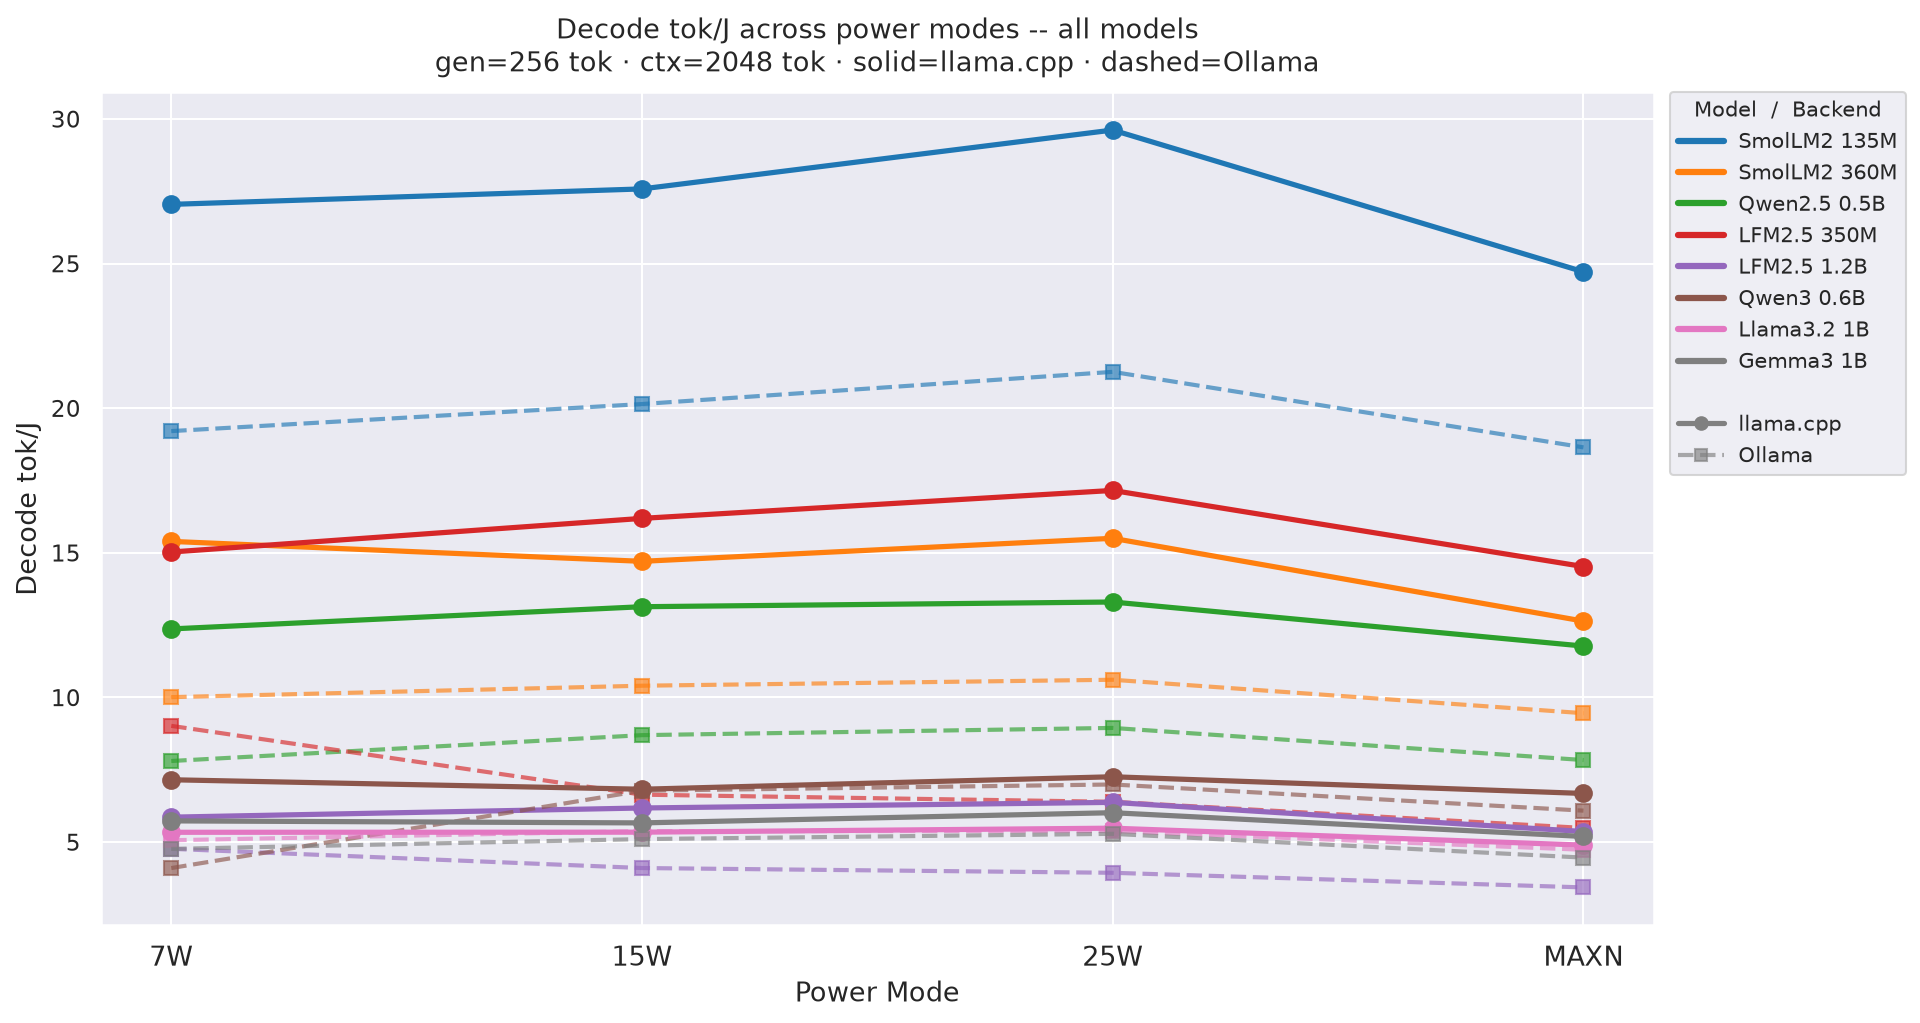
Key finding: 25W (nvpmodel -m 1) is the paretto sweet spot for every model under llama.cpp. It delivers 35-47 % more output tok/s than 15W while pushing output tok/J 1-7 % higher than 15W and 9-23 % higher than MAXN_SUPER across every model (ctx=2048, gen=256, corrected decode-phase tok/J).
Backend finding: llama.cpp outperforms Ollama by 36-74 % on throughput for sub-1B transformer models, with proportionally higher tok/J. Qwen3-0.6B and Llama3.2-1B are the exception - nearly identical across backends (~1-6 % difference at all four power modes). LFM2.5-350M suffers most under Ollama (3.35× slower than llama.cpp at 15W, 4.2× at 25W).
Sub-1B standouts at 25W llama.cpp:
~1B class at 25W llama.cpp (ctx=2048, gen=256):
Throughput winner at each mode (ctx=2048, gen=256, highest sweep point):
Table 1: Throughput and efficiency winner at each power mode (ctx=2048, gen=256)
llama.cpp / CUDA:
| Mode | Fastest model | Output Tok/s |
Output Tok/J† |
|---|---|---|---|
| 7W | smollm2-135m | 53.8 | 27.0‡ |
| 15W | smollm2-135m | 114.7 | 27.58 |
| 25W | smollm2-135m | 165.2 | 29.62 |
| MAXN | smollm2-135m | 159.5 | 24.72 |
Ollama (matched quantizations):
| Mode | Fastest model | Output Tok/s |
Output Tok/J† |
|---|---|---|---|
| 7W | smollm2-135m | 36.4 | 19.21 |
| 15W | smollm2-135m | 84.4 | 20.14 |
| 25W | smollm2-135m | 120.6 | 21.26 |
| MAXN | smollm2-135m | 132.2 | 18.65 |
† Output tok/J = OSL ÷ (decode_power_W × p50_decode_s) - decode-phase energy only (corrected method).
‡ 7W llama.cpp approximated: no tegrastats retained for that run; older avg-power method used.
Table 2: Hardware configuration
| Component | Detail |
|---|---|
| Board | Jetson Orin Nano Super 8GB (Developer Kit) |
| CPU | 6× Arm Cortex-A78AE @ up to 1.728 GHz |
| GPU | NVIDIA Ampere, 1024 CUDA cores, 32 Tensor cores |
| Memory | 8 GB LPDDR5 204.8 GB/s (unified CPU + GPU) |
| Cooling | Active fan; peak junction temperature ≤ 73 °C across all modes |
| Layer | Version / Detail |
|---|---|
| Board | NVIDIA Jetson Orin Nano Super 8GB Developer Kit |
| OS / JetPack | JetPack R36.4.7 (Ubuntu 22.04, L4T 36.4.7) |
| CUDA | 12.6 |
| llama.cpp | build b9292 (commit ef570f630), CUDA backend, -ngl 99, --no-cache-prompt --cache-ram 0 |
| llama-server | host 0.0.0.0:8080, --parallel 1, -c 2560 |
| Ollama | v0.24.0, default GPU offload, REST API on port 11434 |
| Load generator | aiperf (NVIDIA AI Performance tool) |
| Power telemetry | tegrastats at 500 ms, VDD_CPU_GPU_CV rail (mW) |
| Python | 3.10 (aiperf-env), pandas, seaborn, matplotlib |
| Datasets | Synthetic prompts at exact token counts (128, 512, 1024, 2048) generated via aiperf |
| Concurrency | 1 user, 1 request at a time (--parallel 1, --concurrency 1) - single-user latency and throughput profile only |
| Clock locking | jetson_clocks run after each nvpmodel switch (pins GPU + CPU at the mode’s maximum frequency so DVFS cannot drop clocks between requests - see I.13 for why this matters for reproducibility) |
| Model | Quant | GGUF size | Tokenizer |
|---|---|---|---|
| SmolLM2-135M-Instruct | Q4_K_M | 101 MB | HuggingFaceTB/SmolLM2-135M-Instruct |
| SmolLM2-360M-Instruct | Q8_0 | 369 MB | HuggingFaceTB/SmolLM2-360M-Instruct |
| Qwen2.5-0.5B-Instruct | Q4_K_M | 469 MB | Qwen/Qwen2.5-0.5B-Instruct |
| LFM2.5-350M | Q4_K_M | 219 MB | LiquidAI/LFM2.5-350M |
| LFM2.5-1.2B-Instruct | Q4_K_M | 698 MB | LiquidAI/LFM2.5-1.2B-Instruct |
| Qwen3-0.6B | Q8_0 | 610 MB | Qwen/Qwen3-0.6B |
| Llama-3.2-1B-Instruct | Q4_K_M | 771 MB | meta-llama/Llama-3.2-1B-Instruct |
| Gemma3-1B-IT | Q4_K_M | 769 MB | google/gemma-3-1b-it |
Quantization note: SmolLM2-360M-Instruct and Qwen3-0.6B use Q8_0 (8-bit, near-lossless); all other models use Q4_K_M (4-bit K-quant medium).
Table 5: Power mode configurations
| Mode | nvpmodel | GPU clock | CPU clock | VDD_CPU_GPU_CV avg across models |
|---|---|---|---|---|
| 7W | -m 3 |
~408 MHz | 960 MHz | 1.96-2.34 W |
| 15W | -m 0 |
~612 MHz | 1 190 MHz | 4.16-6.06 W |
| 25W | -m 1 |
~820 MHz | 1 420 MHz | 5.54-8.58 W |
| MAXN | -m 2 + jetson_clocks |
1020 MHz | 1 728 MHz | 6.36-10.64 W |
model × prompt × gen combo, aiperf sends 20 single-concurrency requests with synthetic prompts at the exact target token count.tegrastats VDD_CPU_GPU_CV (mW → W) at 500 ms intervals. For both llama.cpp (15W/25W/MAXN) and all four Ollama modes, per-request nanosecond timestamps from profile_export.jsonl (request_start_ns, request_ack_ns, request_end_ns) are used to classify each tegrastats sample as prefill (start→ack) or decode (ack→end). decode_power_W is the median of samples that fall inside decode windows. output_tok_J = OSL ÷ (decode_power_W × p50_decode_s) - decode-phase energy only. This avoids inflating the denominator with the high-power prefill spike, giving a more accurate per-output-token efficiency figure.jetson_clocks at all modes. CMA was compacted (/proc/sys/vm/compact_memory) between model loads.nvpmodel and monitored for thermal stability (no sustained throttling; junction temp ≤ 73 °C).TTFT, ITL, and request latency (RL) values reported in charts, tables, and energy calculations use the p50 (median) over the 20 requests per combo. The mean is not used for latency because occasional slow requests (GC pause, memory compaction, OS scheduling) inflate it without reflecting typical behaviour. p90 and p99 are available in the raw per-mode Hugging Face datasets (see raw data table at the top of this post) for tail-latency analysis.All charts use data from all four power modes.
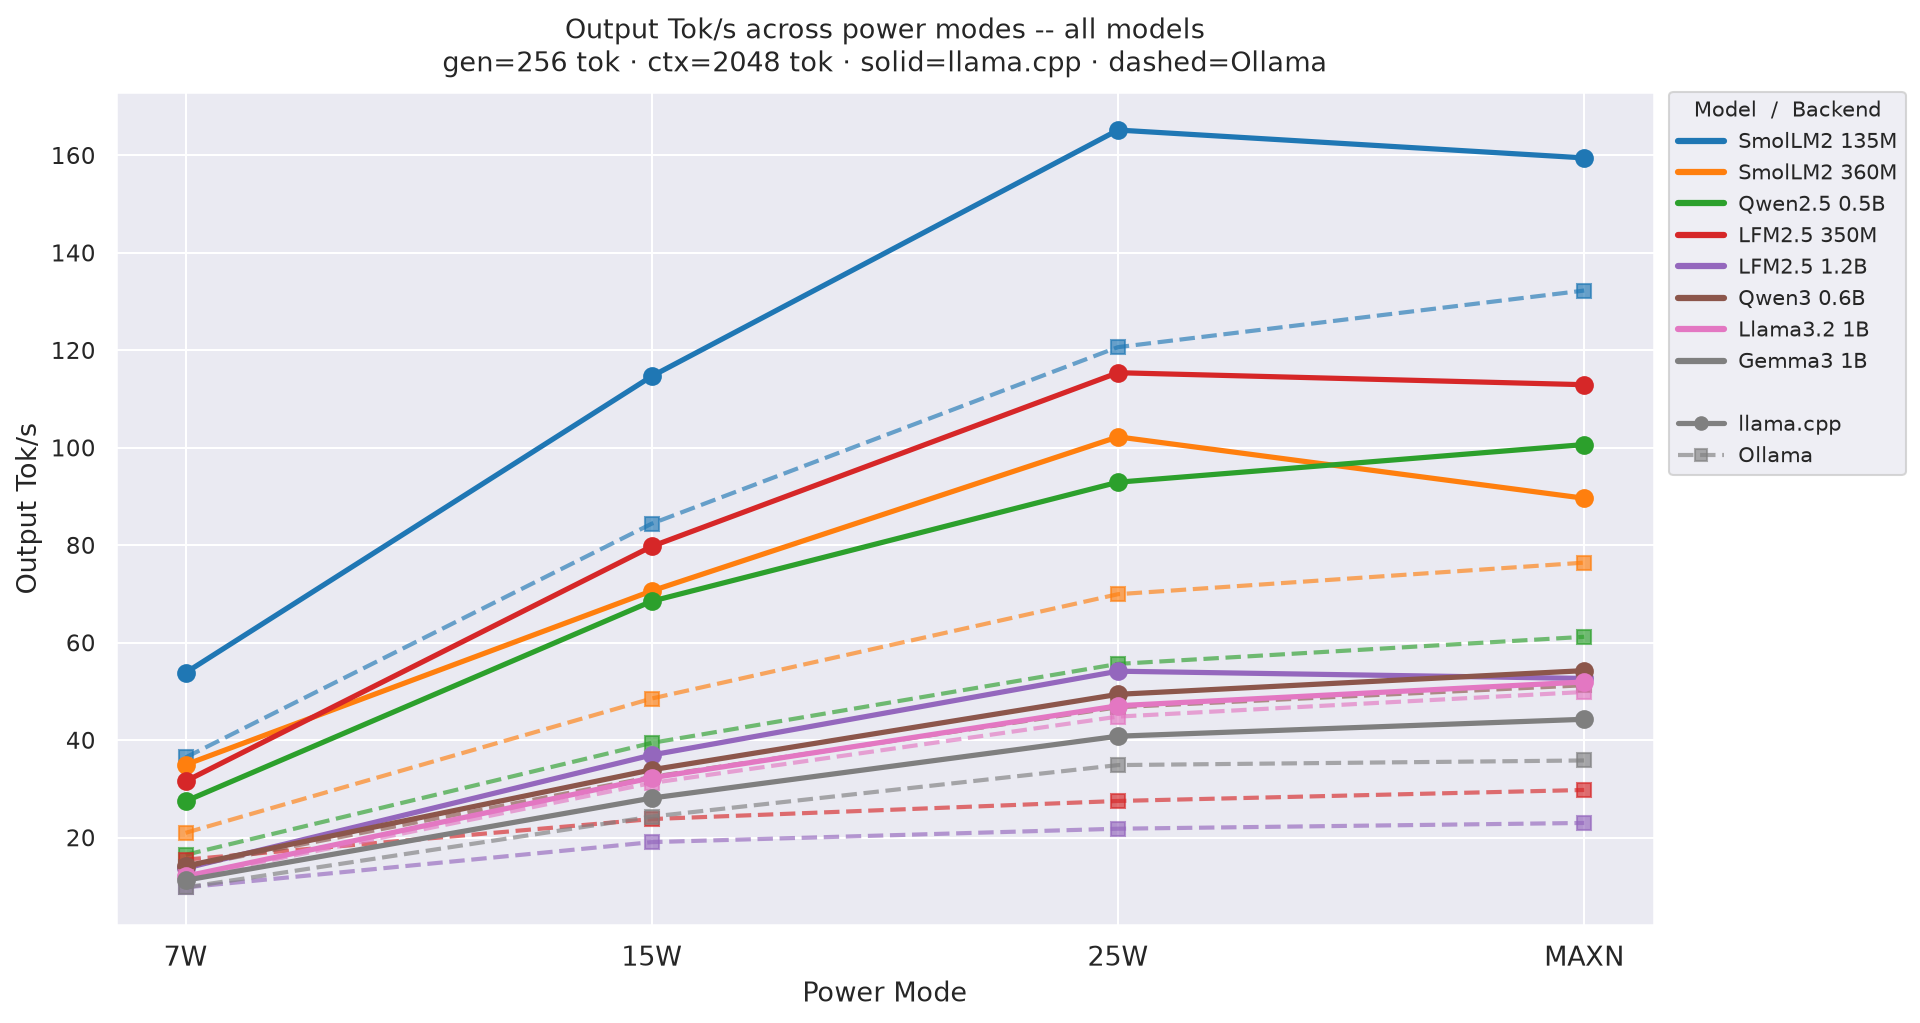
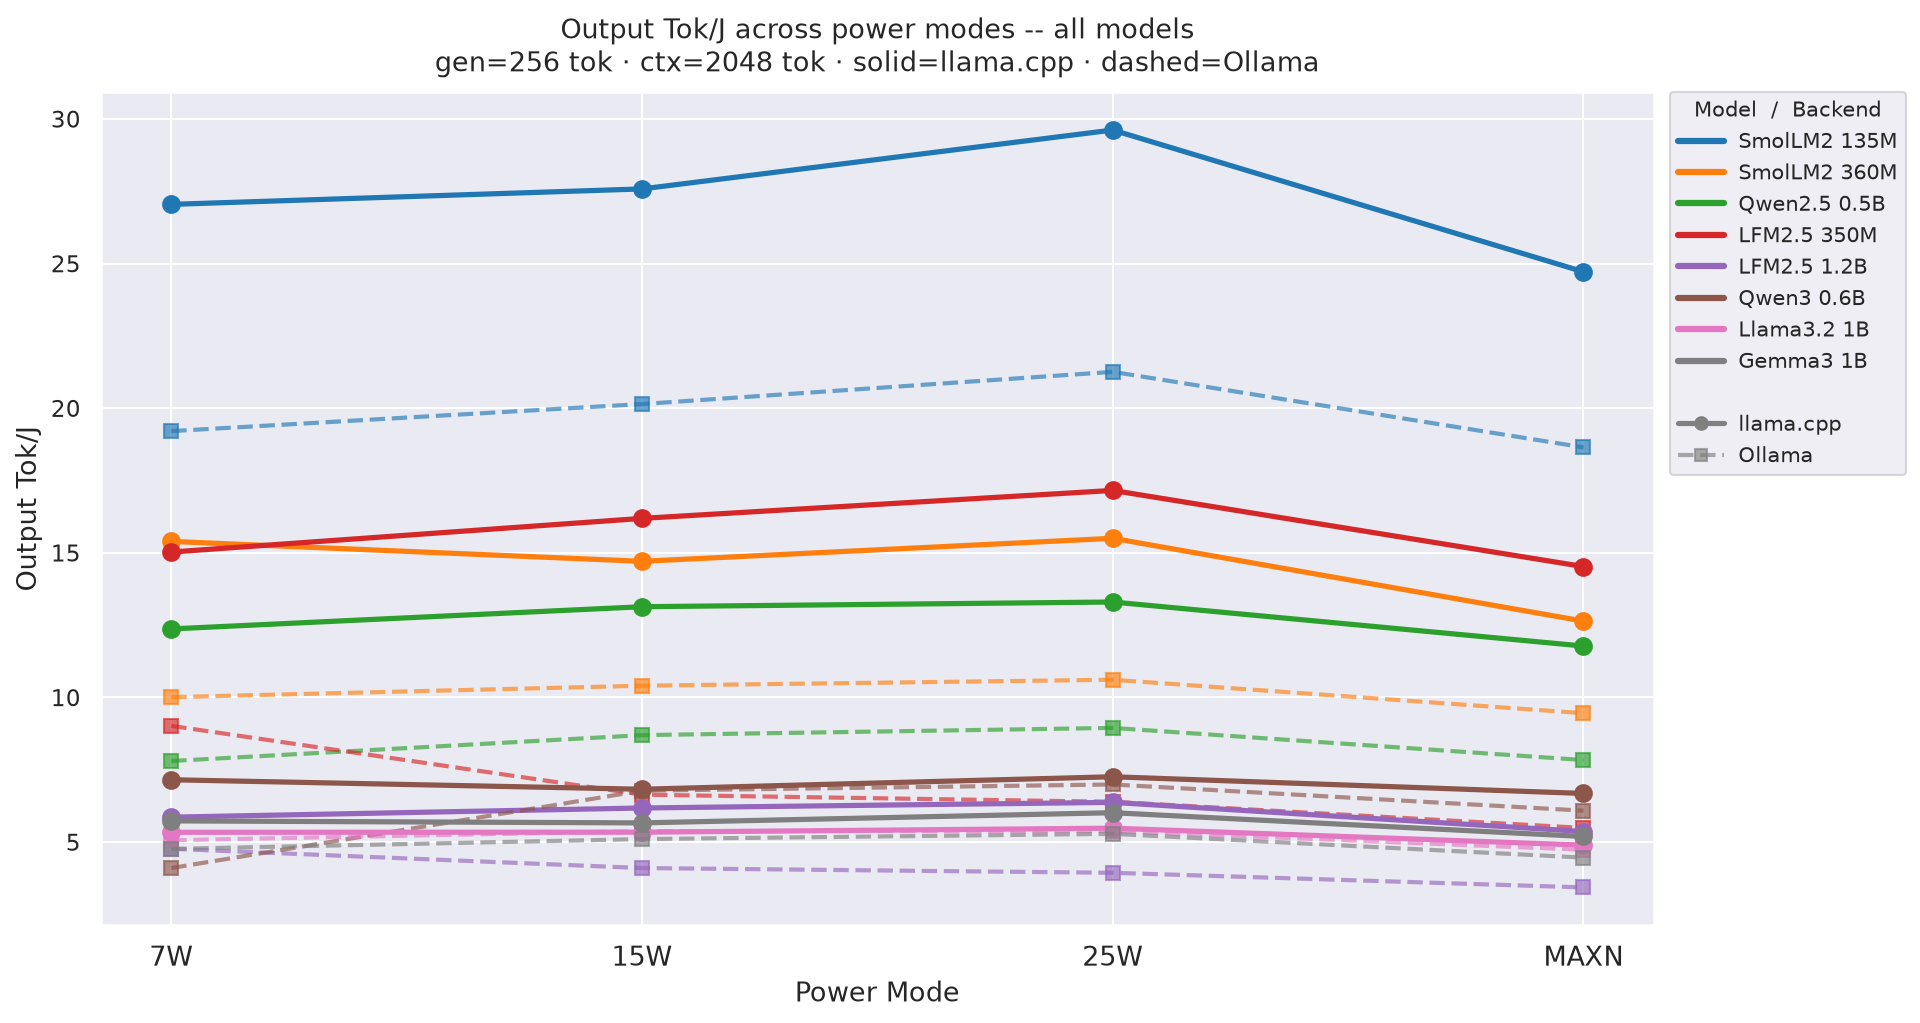
Line/point convention throughout: Solid lines / filled circles = llama.cpp. Dashed lines / open squares = Ollama. Each model gets its own colour.
Output tok/s by power mode at gen=256, ctx=2048 across all models; solid lines = llama.cpp, dashed = Ollama. 25W consistently leads:
Figure 1: Output tok/s by power mode - all models (gen=256, ctx=2048)
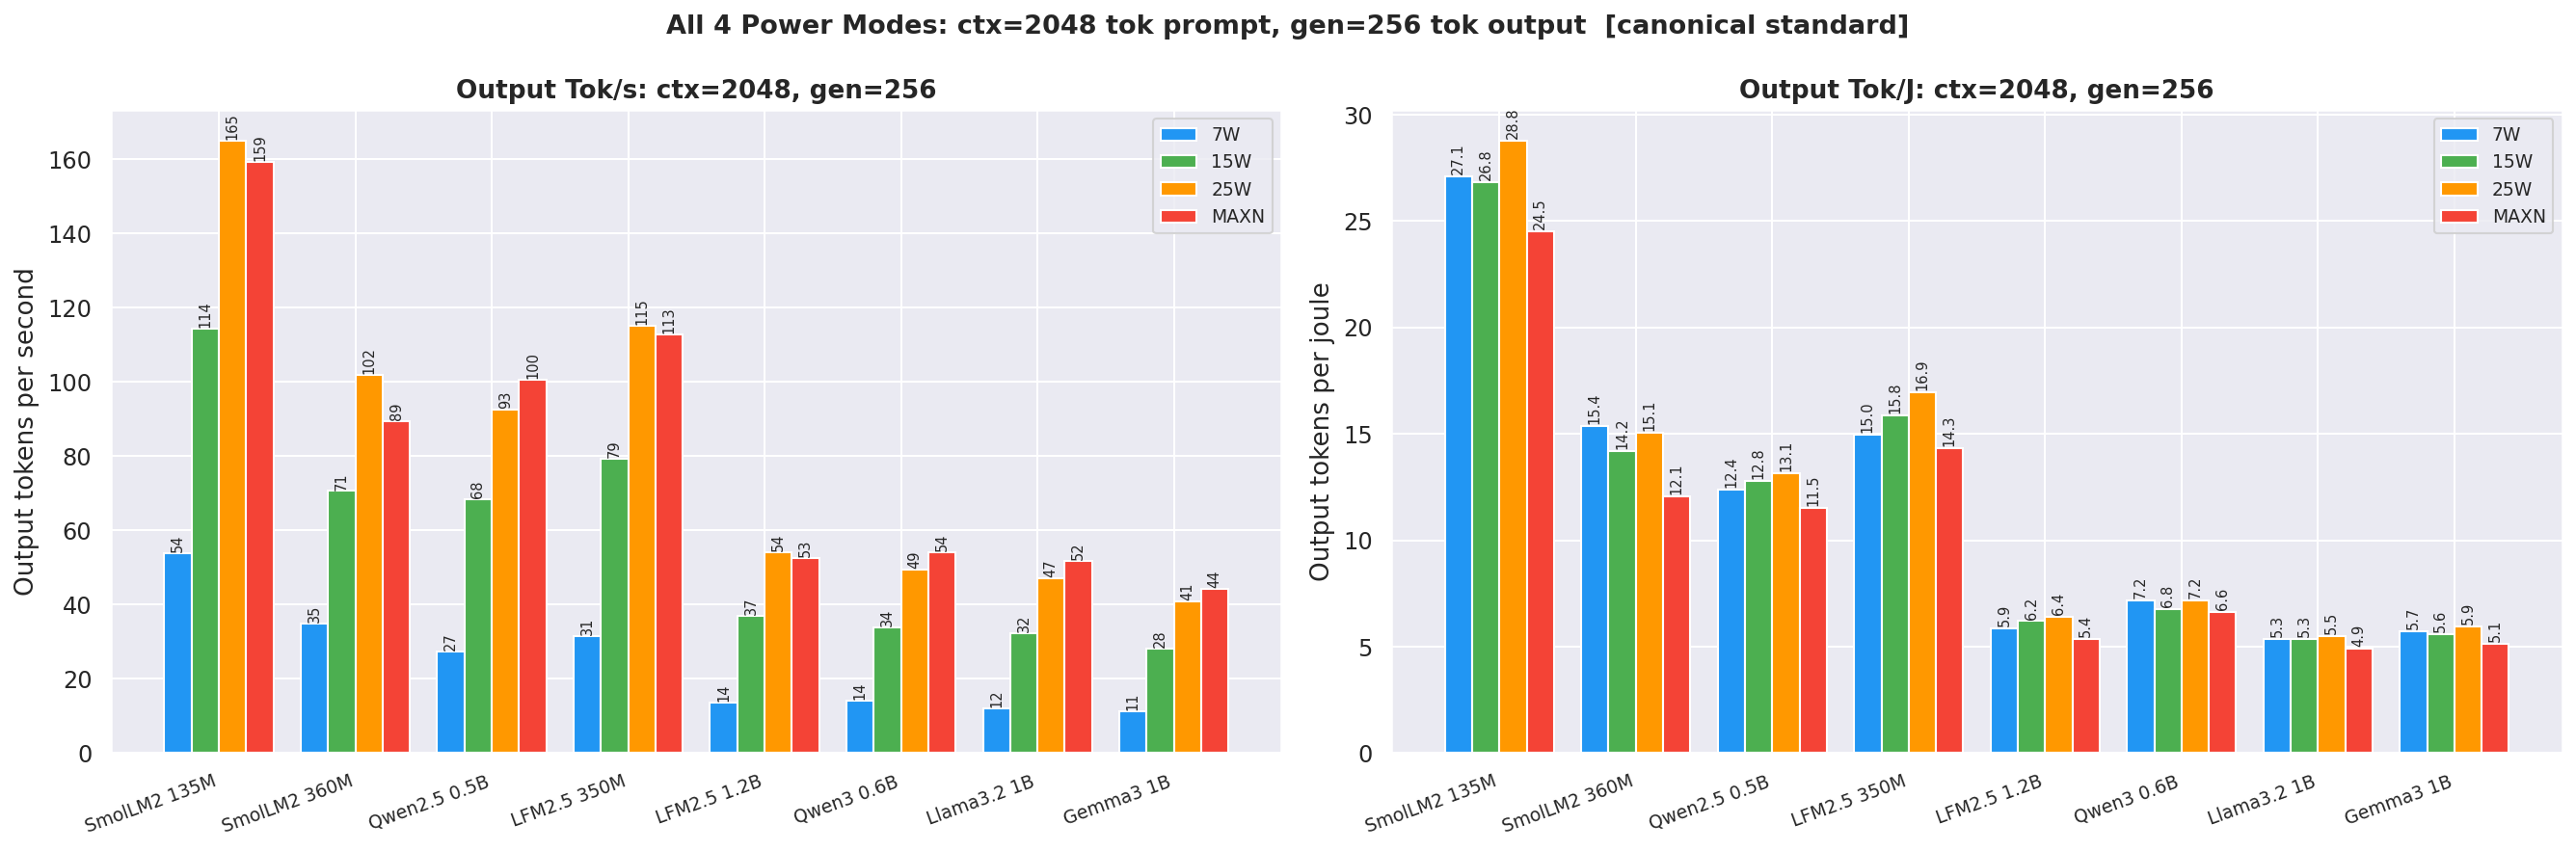
Canonical cell (ctx=2048, gen=256), side-by-side output tok/s and output tok/J bars for all 4 modes:
Figure 2: Canonical cell: output tok/s and tok/J side by side (ctx=2048, gen=256)
Output Tok/J by power mode at gen=256, ctx=2048; 25W leads for every model at every power mode:Figure 3: Output tok/J by power mode - all models (gen=256, ctx=2048)
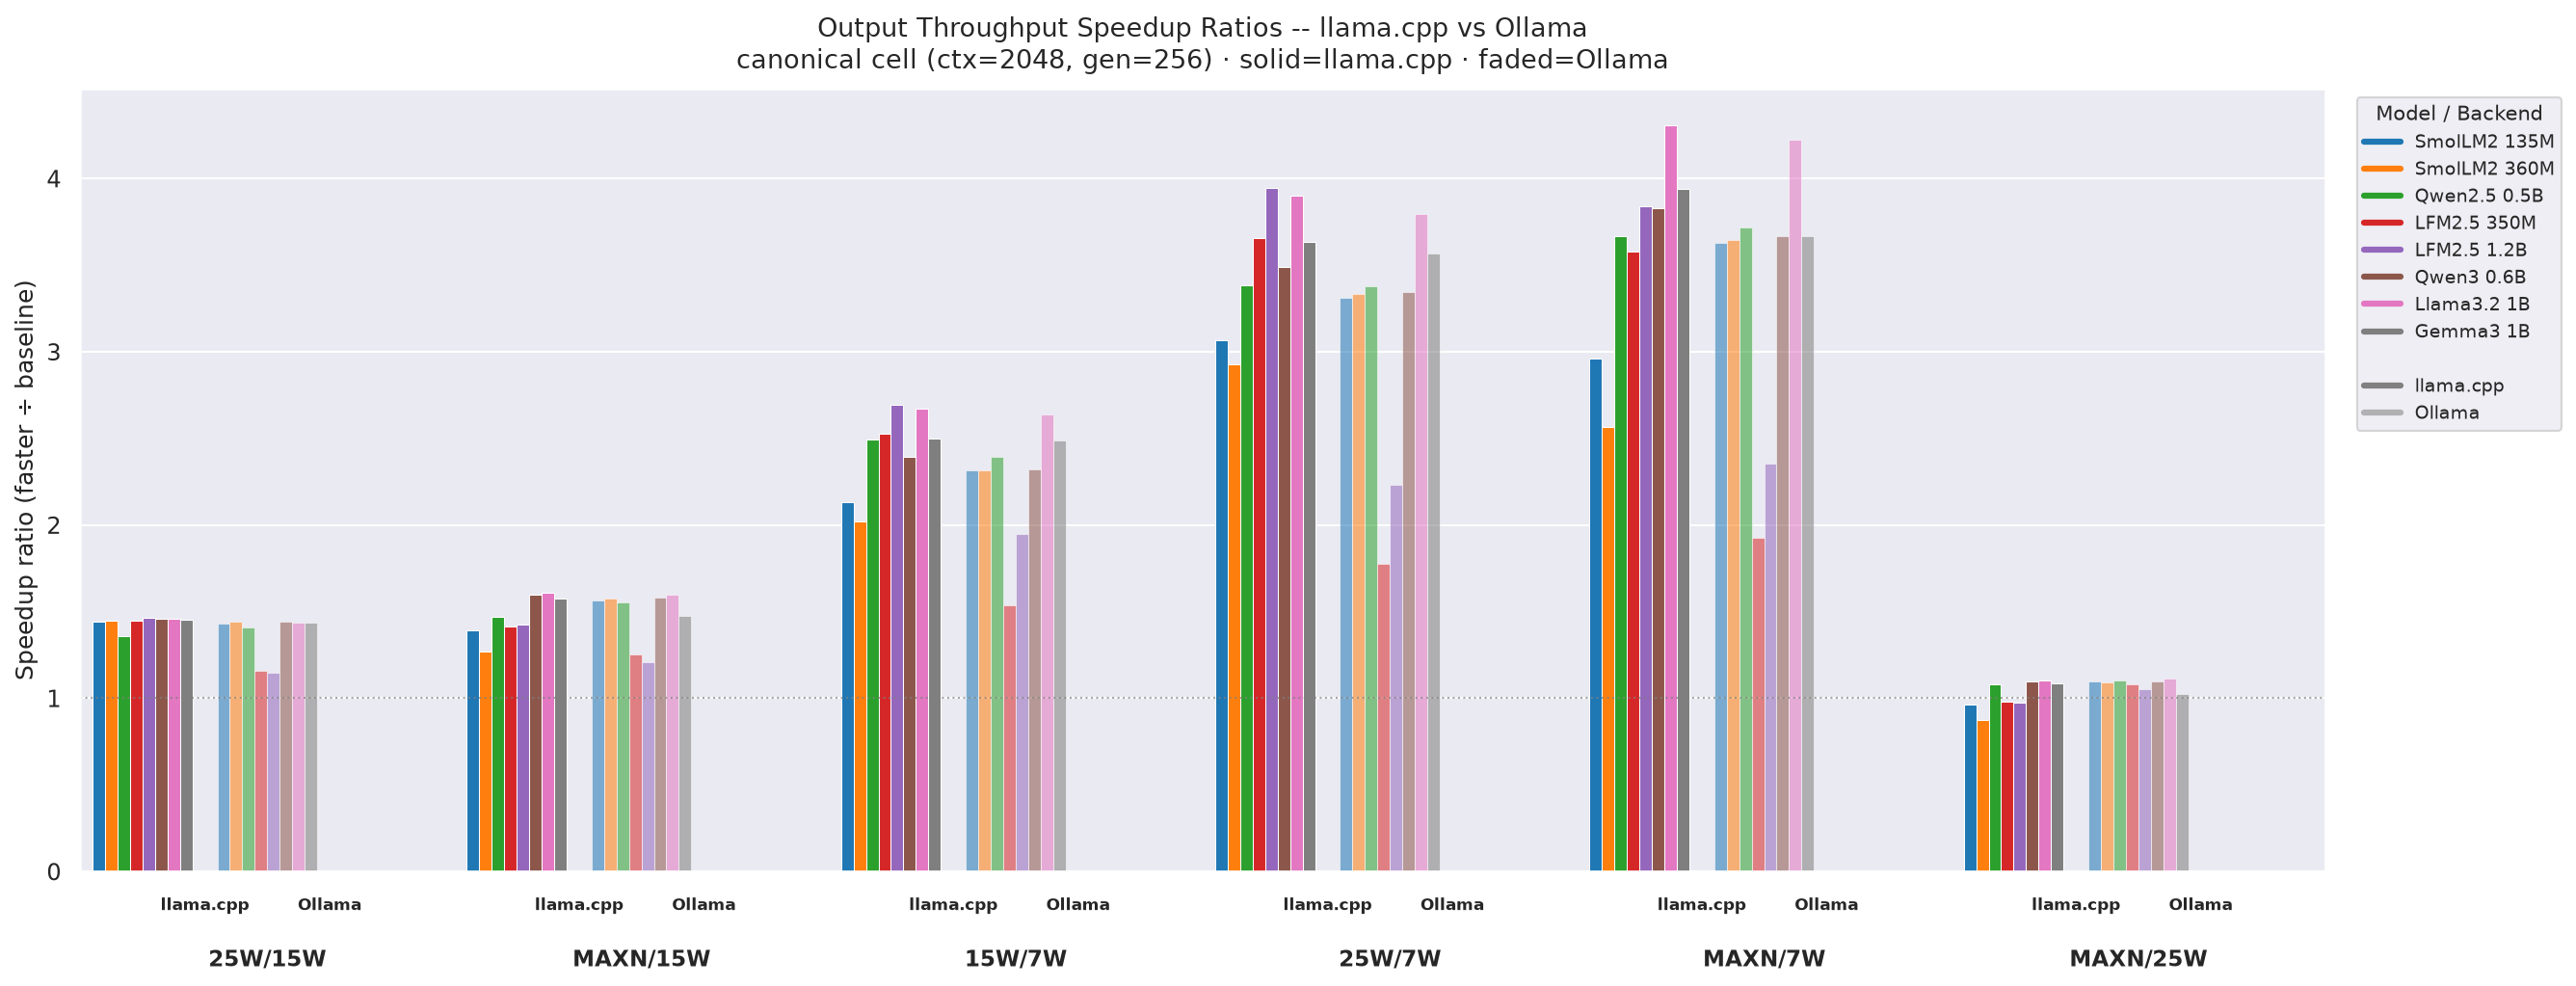
llama.cpp ÷ Ollama speed ratio at the canonical cell (ctx=2048, gen=256). Values > 1× mean llamacpp is faster:
Table 6: llama.cpp vs Ollama - tok/s ratios (llama.cpp ÷ Ollama) at each power mode - canonical cell (ctx=2048, gen=256)
| Model | 7W ratio | 15W ratio | 25W ratio | MAXN ratio |
|---|---|---|---|---|
| SmolLM2 135M | 1.48× | 1.36× | 1.37× | 1.21× |
| SmolLM2 360M | 1.67× | 1.45× | 1.46× | 1.17× |
| Qwen2.5 0.5B | 1.67× | 1.74× | 1.67× | 1.64× |
| LFM2.5 350M | 2.04× | 3.35× | 4.20× | 3.79× |
| LFM2.5 1.2B | 1.40× | 1.94× | 2.48× | 2.29× |
| Qwen3 0.6B | 1.01× | 1.04× | 1.06× | 1.06× |
| Llama3.2 1B | 1.02× | 1.03× | 1.05× | 1.04× |
| Gemma3 1B | 1.15× | 1.16× | 1.17× | 1.24× |
Table 7: llama.cpp vs Ollama - tok/J ratios (llama.cpp ÷ Ollama) at each power mode - canonical cell (ctx=2048, gen=256)
| Model | 7W ratio | 15W ratio | 25W ratio | MAXN ratio |
|---|---|---|---|---|
| SmolLM2 135M | 1.41× | 1.37× | 1.39× | 1.33× |
| SmolLM2 360M | 1.54× | 1.41× | 1.46× | 1.34× |
| Qwen2.5 0.5B | 1.59× | 1.51× | 1.49× | 1.50× |
| LFM2.5 350M | 1.67× | 2.44× | 2.68× | 2.65× |
| LFM2.5 1.2B | 1.23× | 1.51× | 1.62× | 1.56× |
| Qwen3 0.6B | 1.74× | 1.01× | 1.04× | 1.10× |
| Llama3.2 1B | 1.05× | 0.99× | 1.02× | 1.03× |
| Gemma3 1B | 1.20× | 1.11× | 1.14× | 1.16× |
Full ratio tables with
TTFT,ITL, and power are in Appendix C.
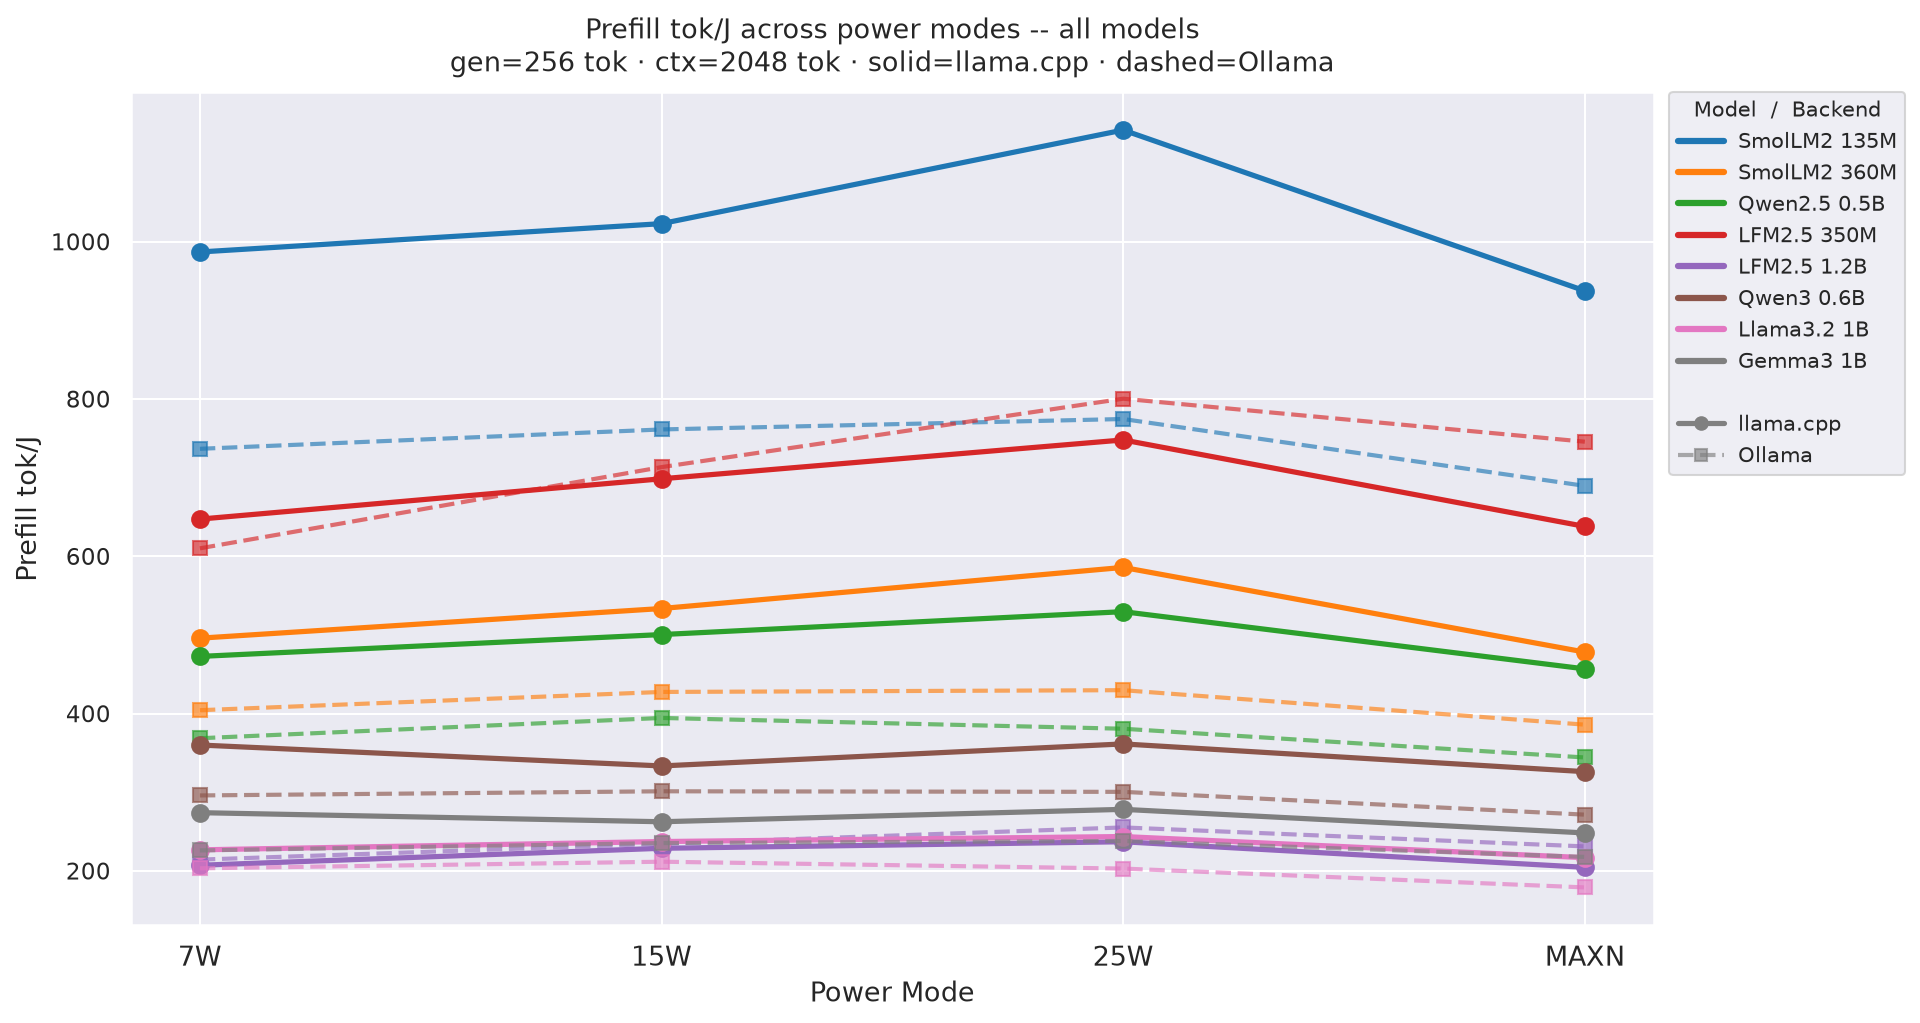
Prefill tok/J (input tokens per joule of prefill energy) by power mode at gen=256, ctx=2048; how each model’s prefill efficiency varies with GPU clock:Figure 4: Prefill tok/J by power mode - all models (gen=256, ctx=2048)
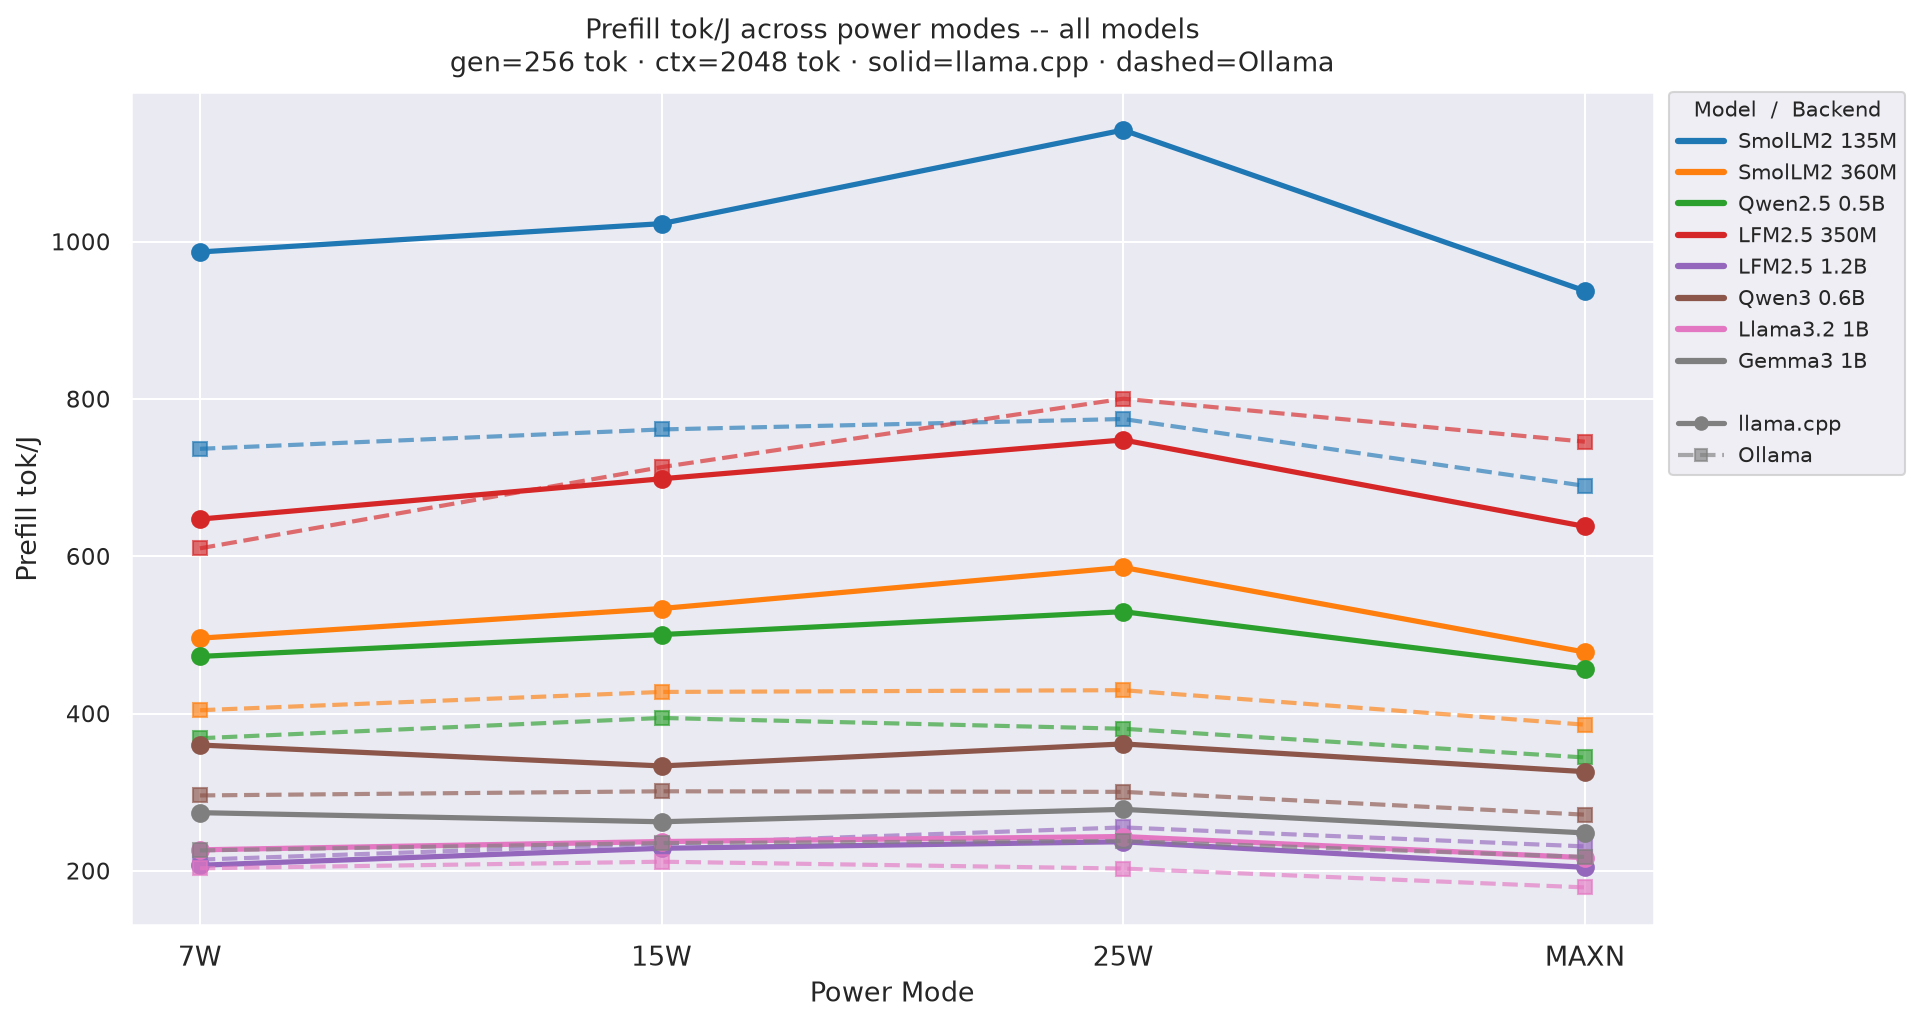
⚠ Prefill tok/J is approximate when
TTFT< 500 ms (no tegrastats sample in prefill window): 63 % of llama.cpp cells, 48 % of Ollama cells. Decode tok/J and total tok/J are not affected.
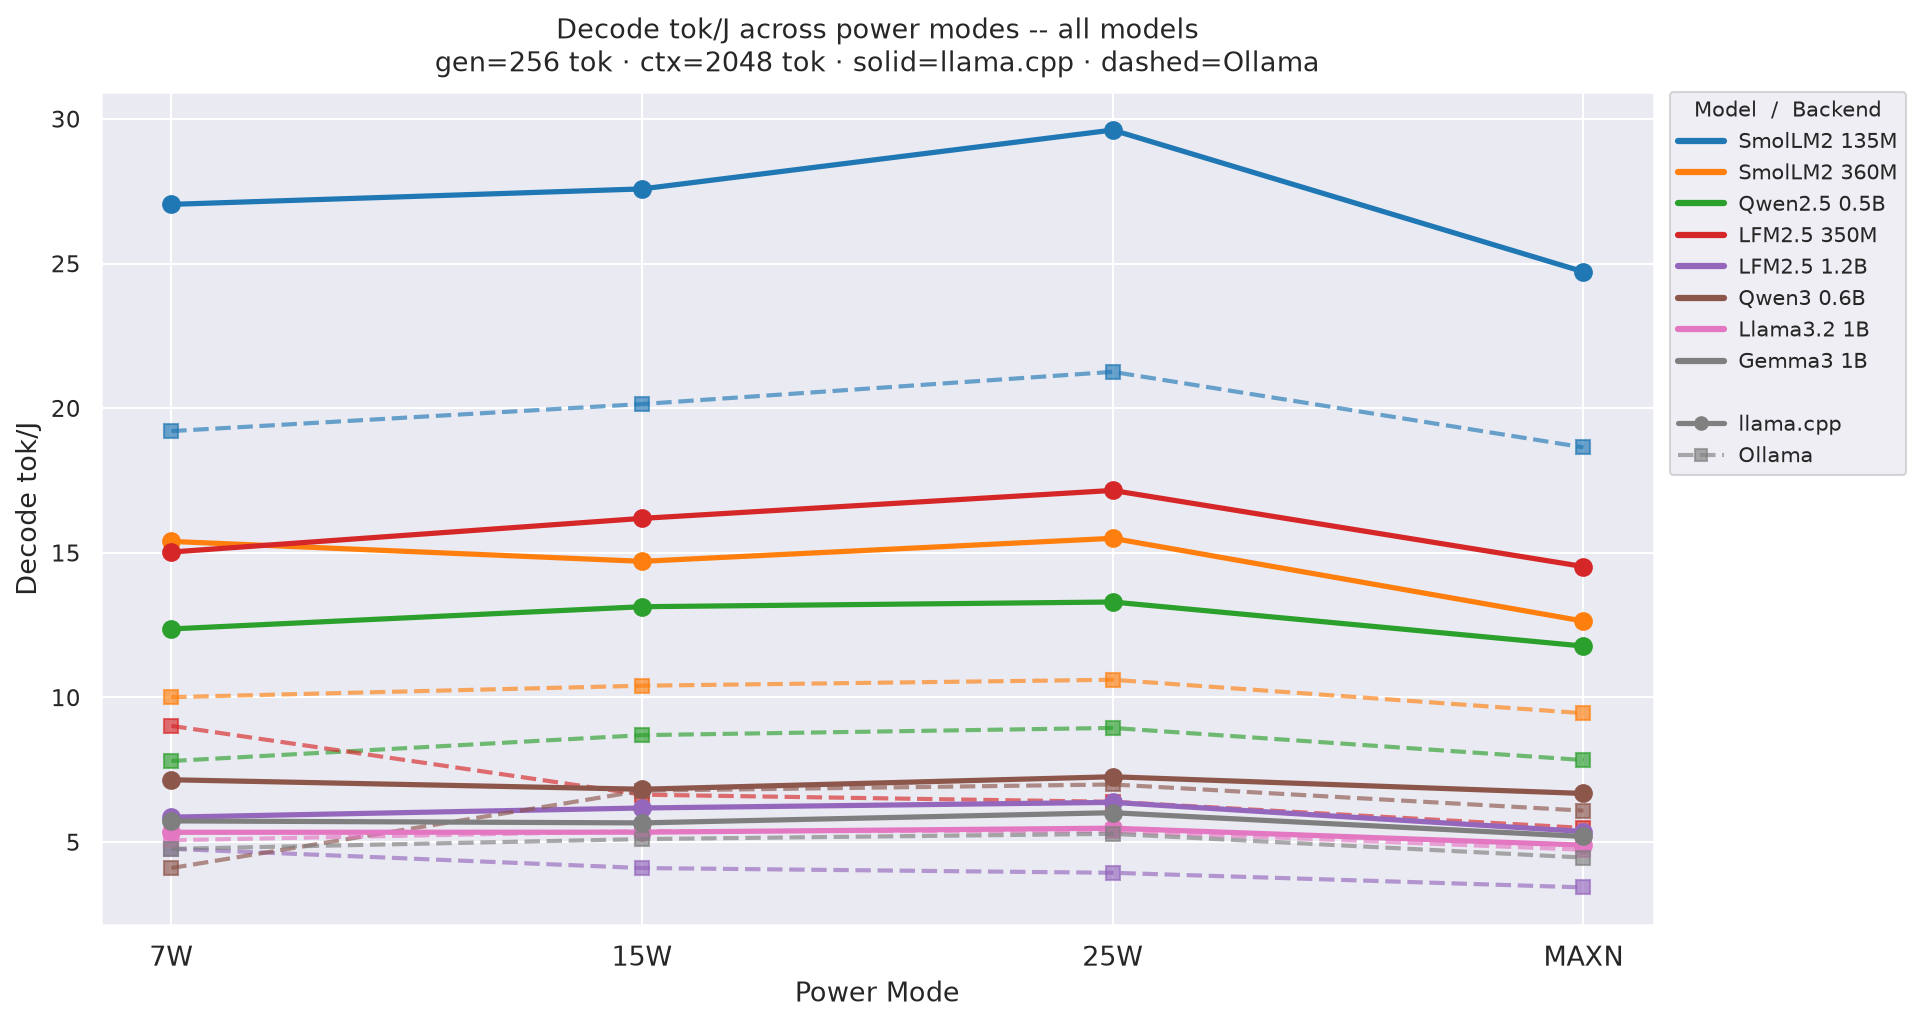
Decode tok/J (output tokens per joule of decode energy) by power mode at gen=256, ctx=2048; output generation efficiency - 25W leads across all models:Figure 5: Decode tok/J by power mode - all models (gen=256, ctx=2048)
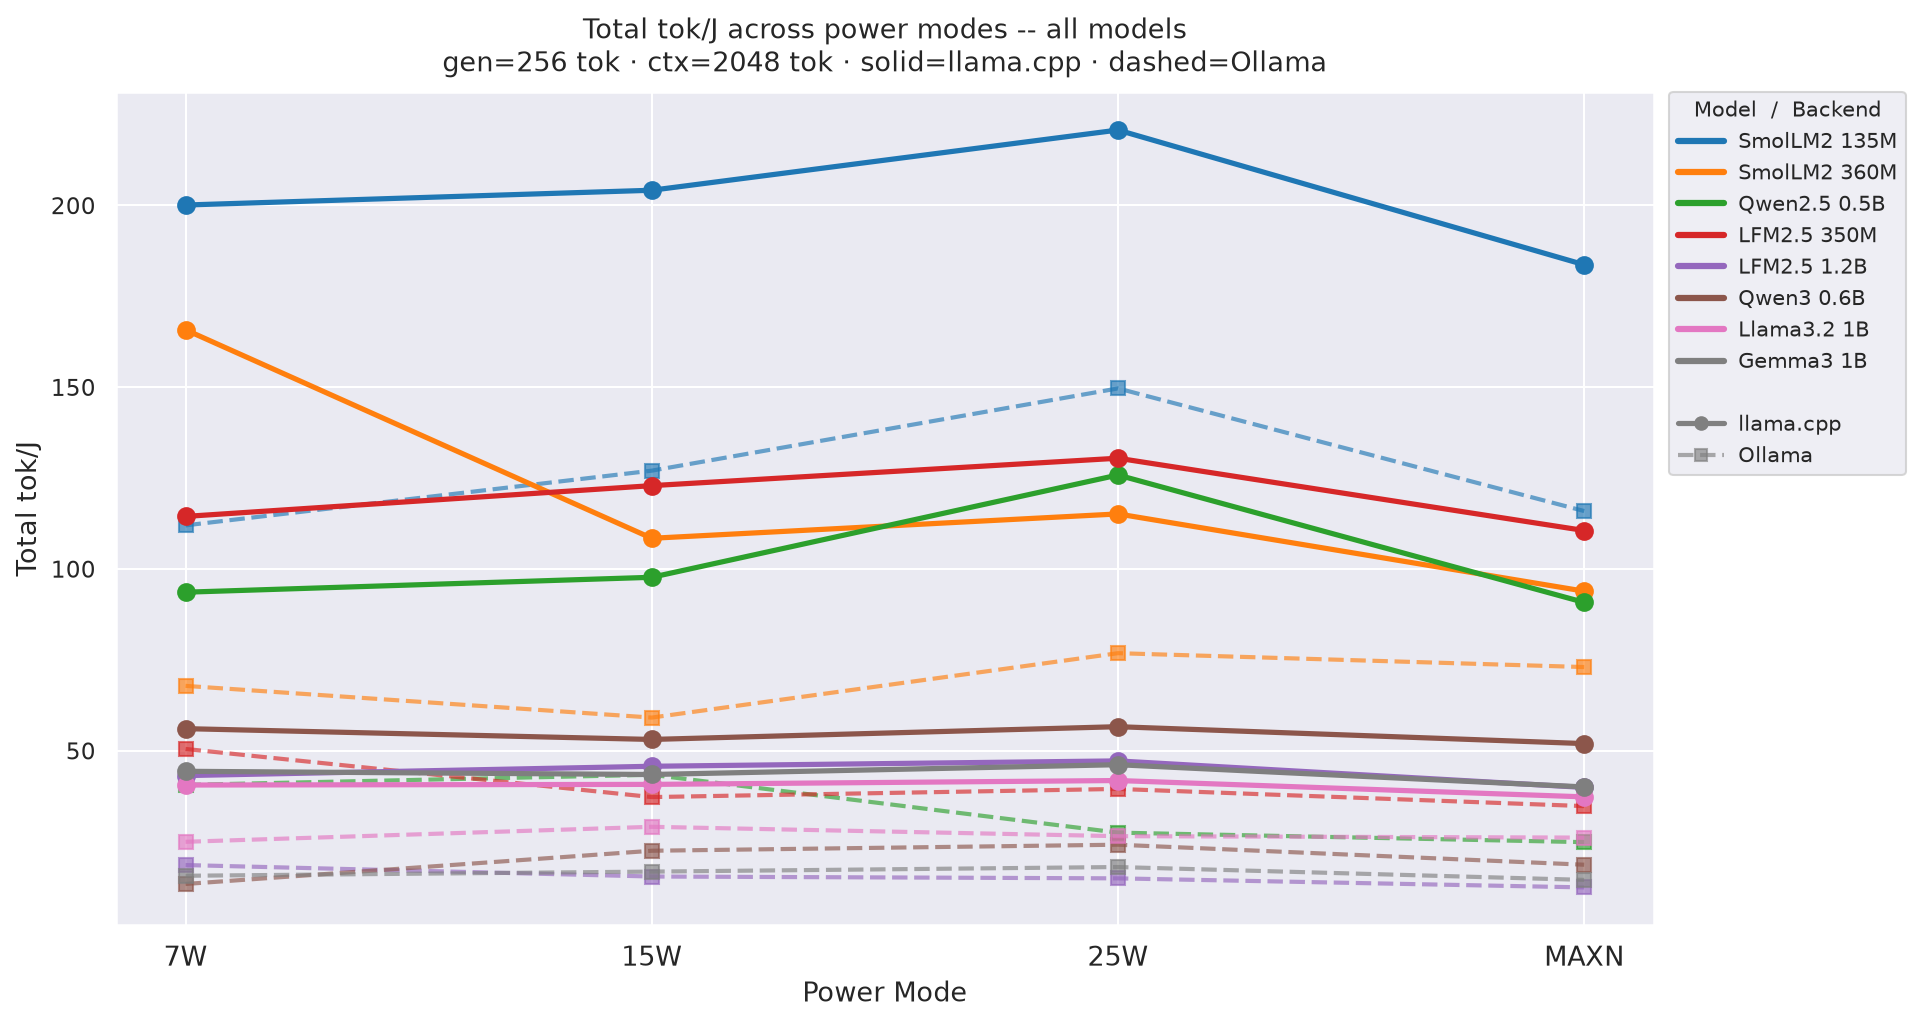
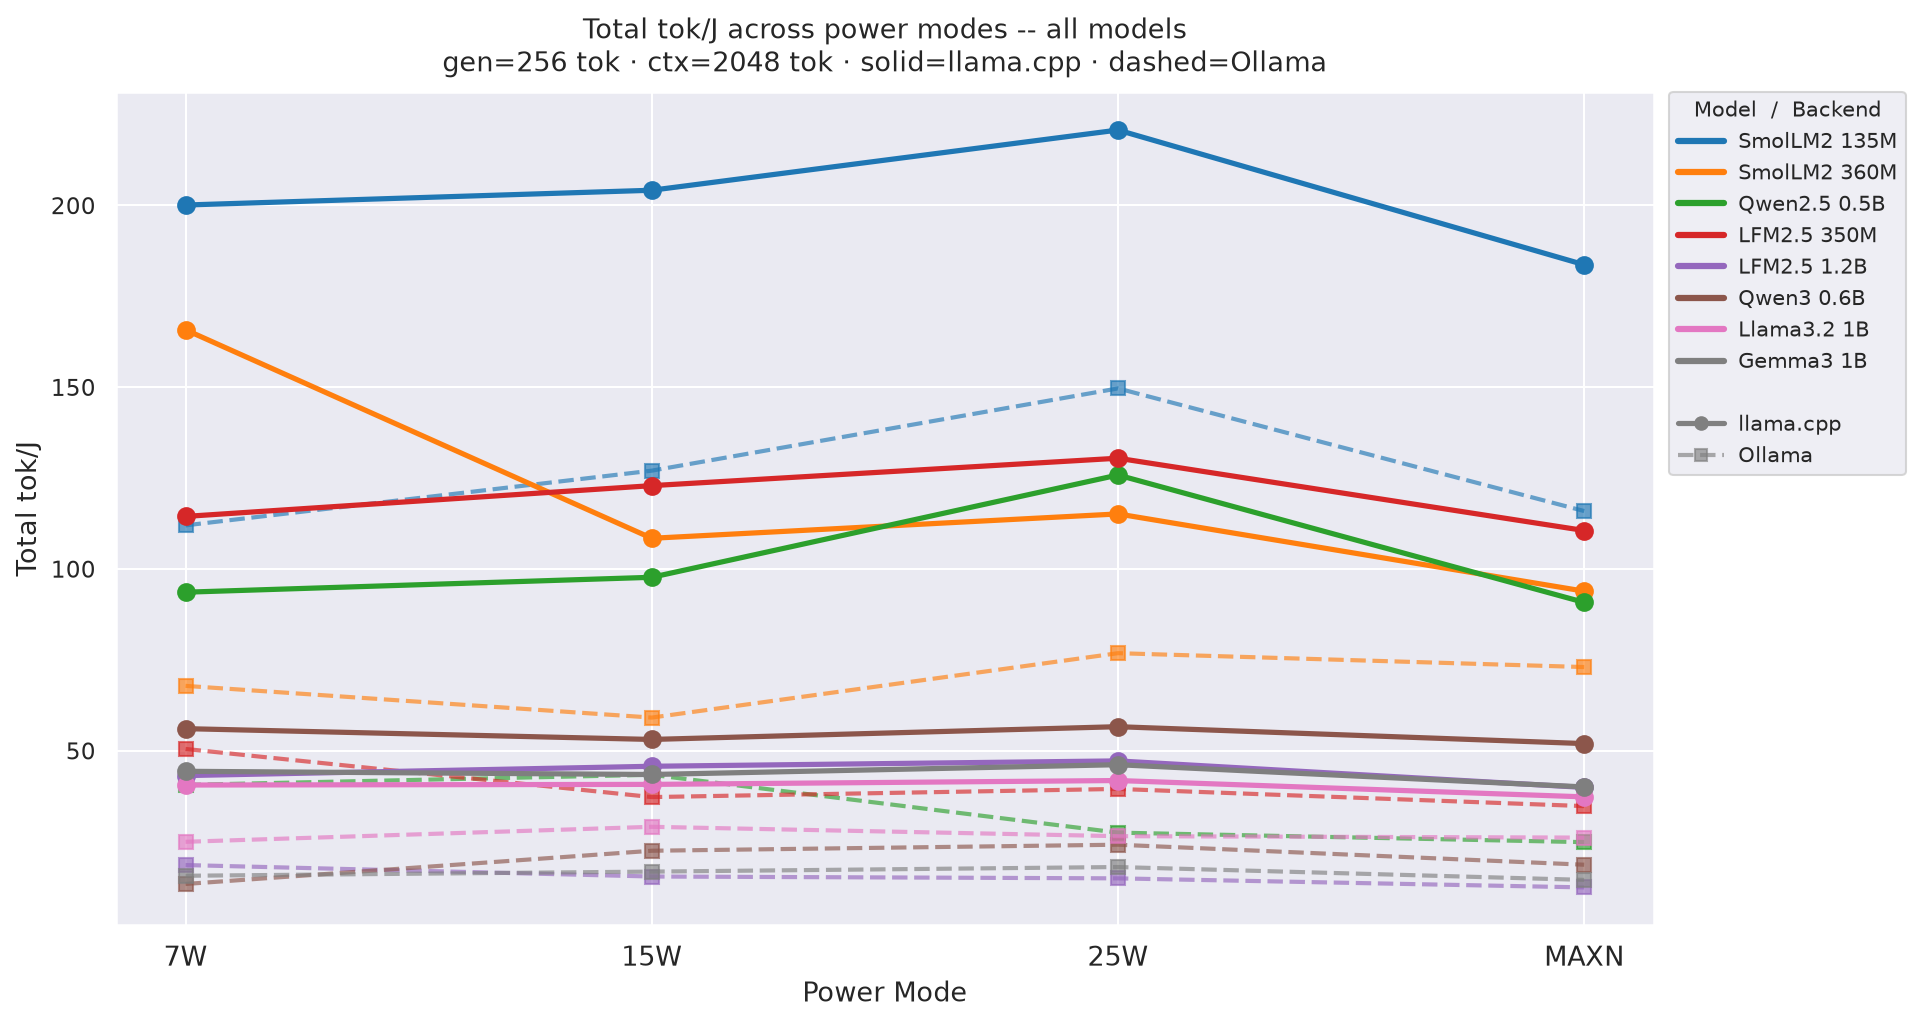
Total tok/J ((input + output) tokens per joule of total request energy) by power mode at gen=256, ctx=2048; overall request efficiency - 25W wins at every model:Figure 6: Total tok/J by power mode - all models (gen=256, ctx=2048)
Full tok/J charts for all ctx/gen combinations: D.1 Prefill · D.2 Decode · D.3 Total.
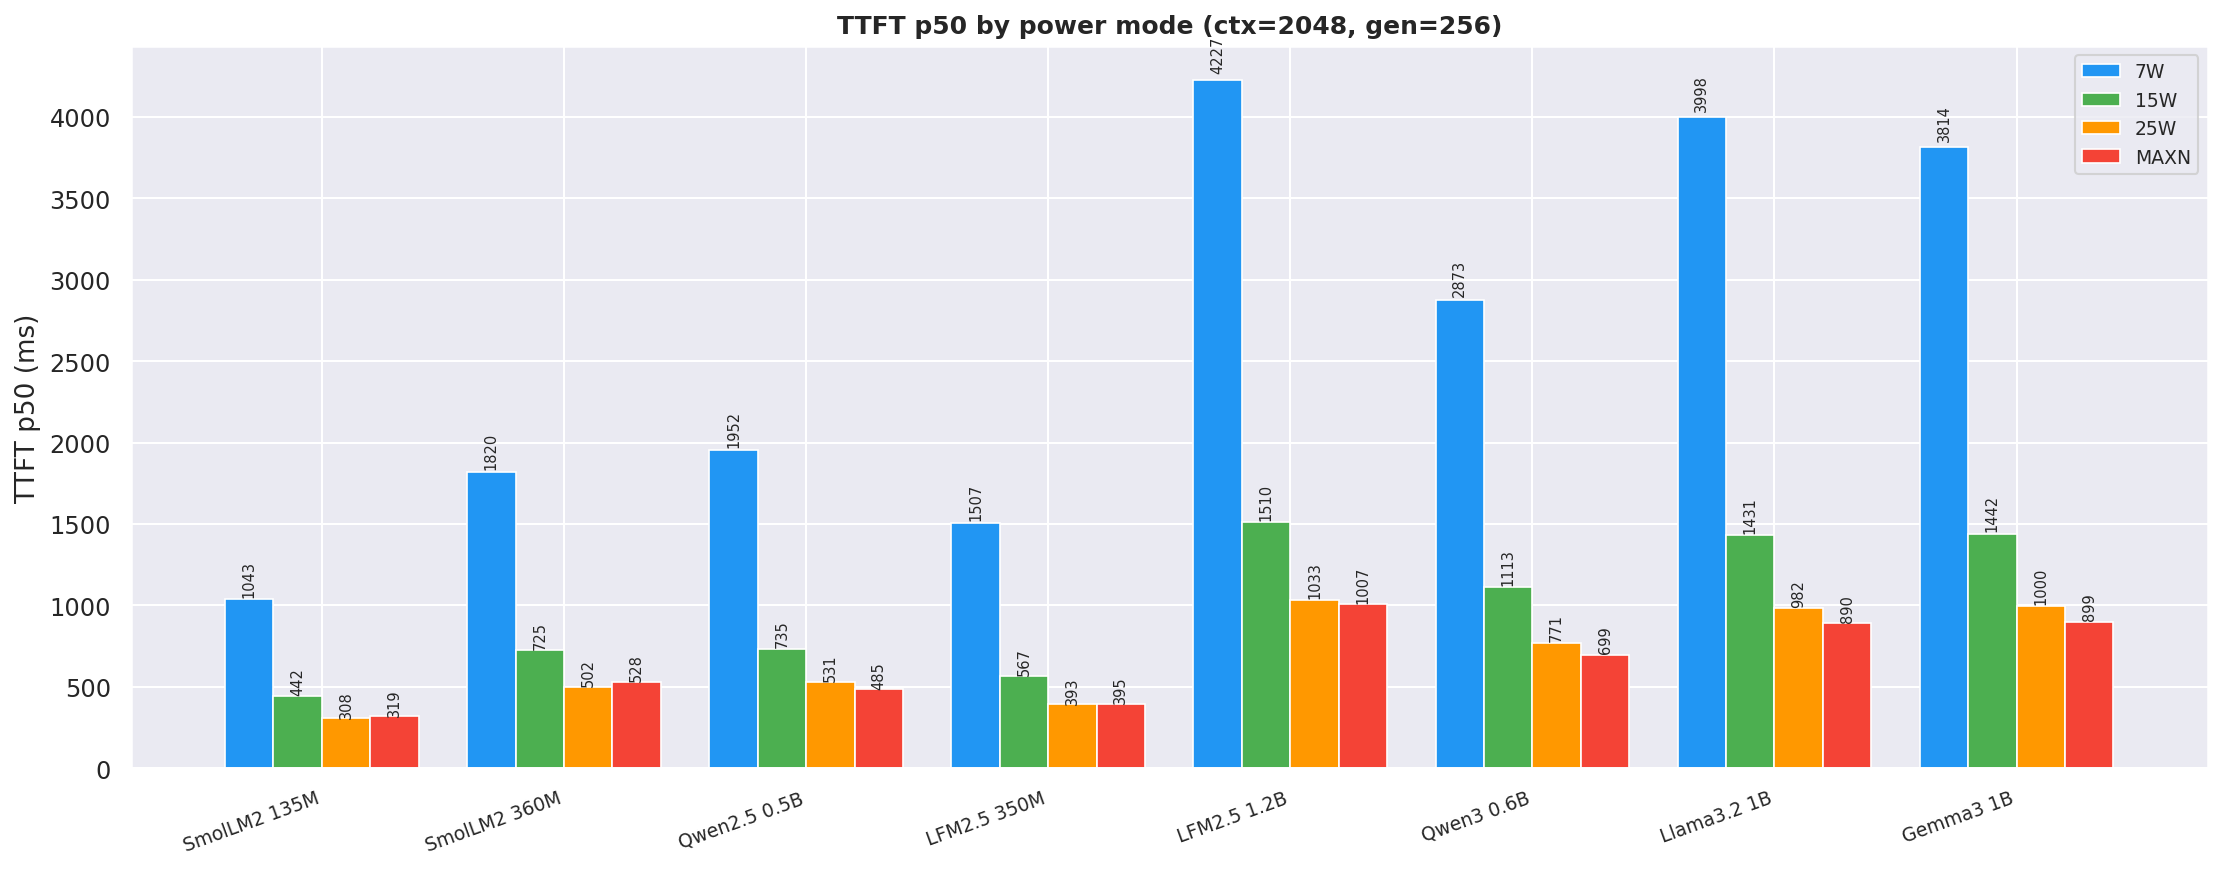
TTFT p50 at ctx=2048, gen=256; 25W and MAXN reduce TTFT by 30-38 % vs 15W:
Figure 7: TTFT p50 by power mode (ctx=2048, gen=256)
ITL (inter-token latency) p50 at ctx=2048, gen=256; lower is better:
Figure 8: ITL p50 by power mode (ctx=2048, gen=256)
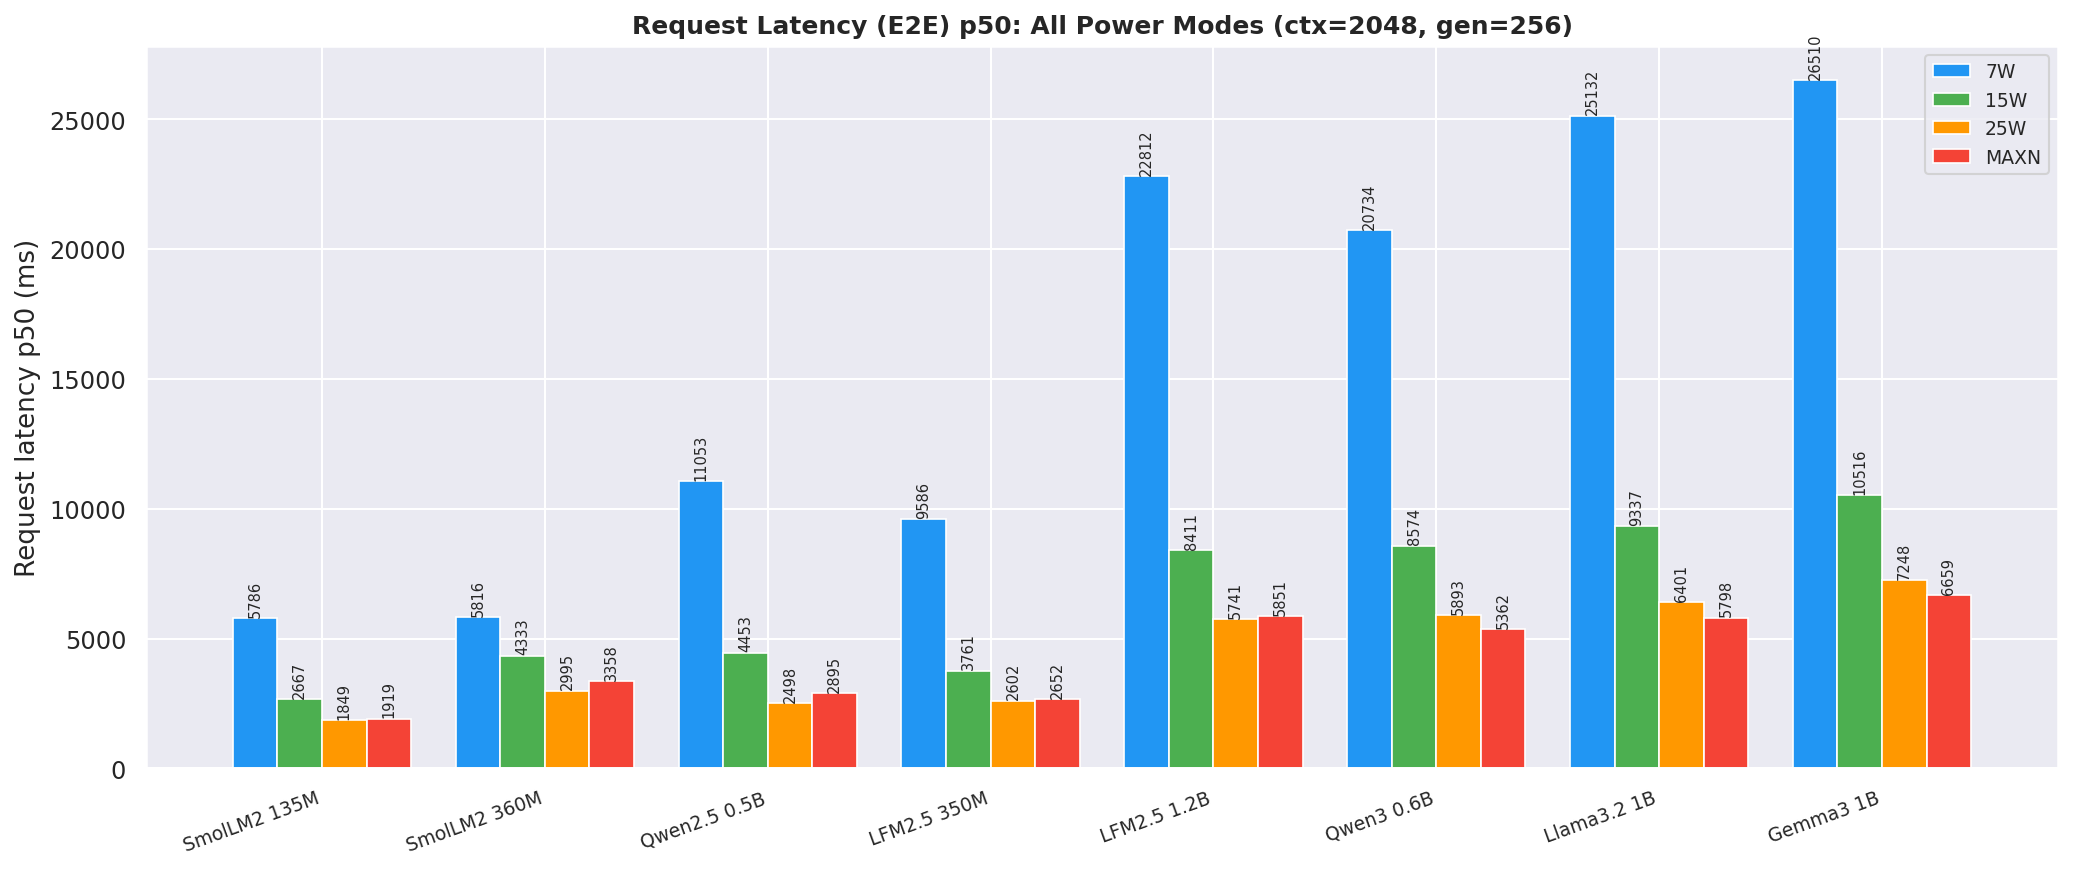
Request latency (E2E) p50 at ctx=2048, gen=256; total time from request start to last token received:
Figure 9: Request latency (E2E) p50 by power mode (ctx=2048, gen=256)
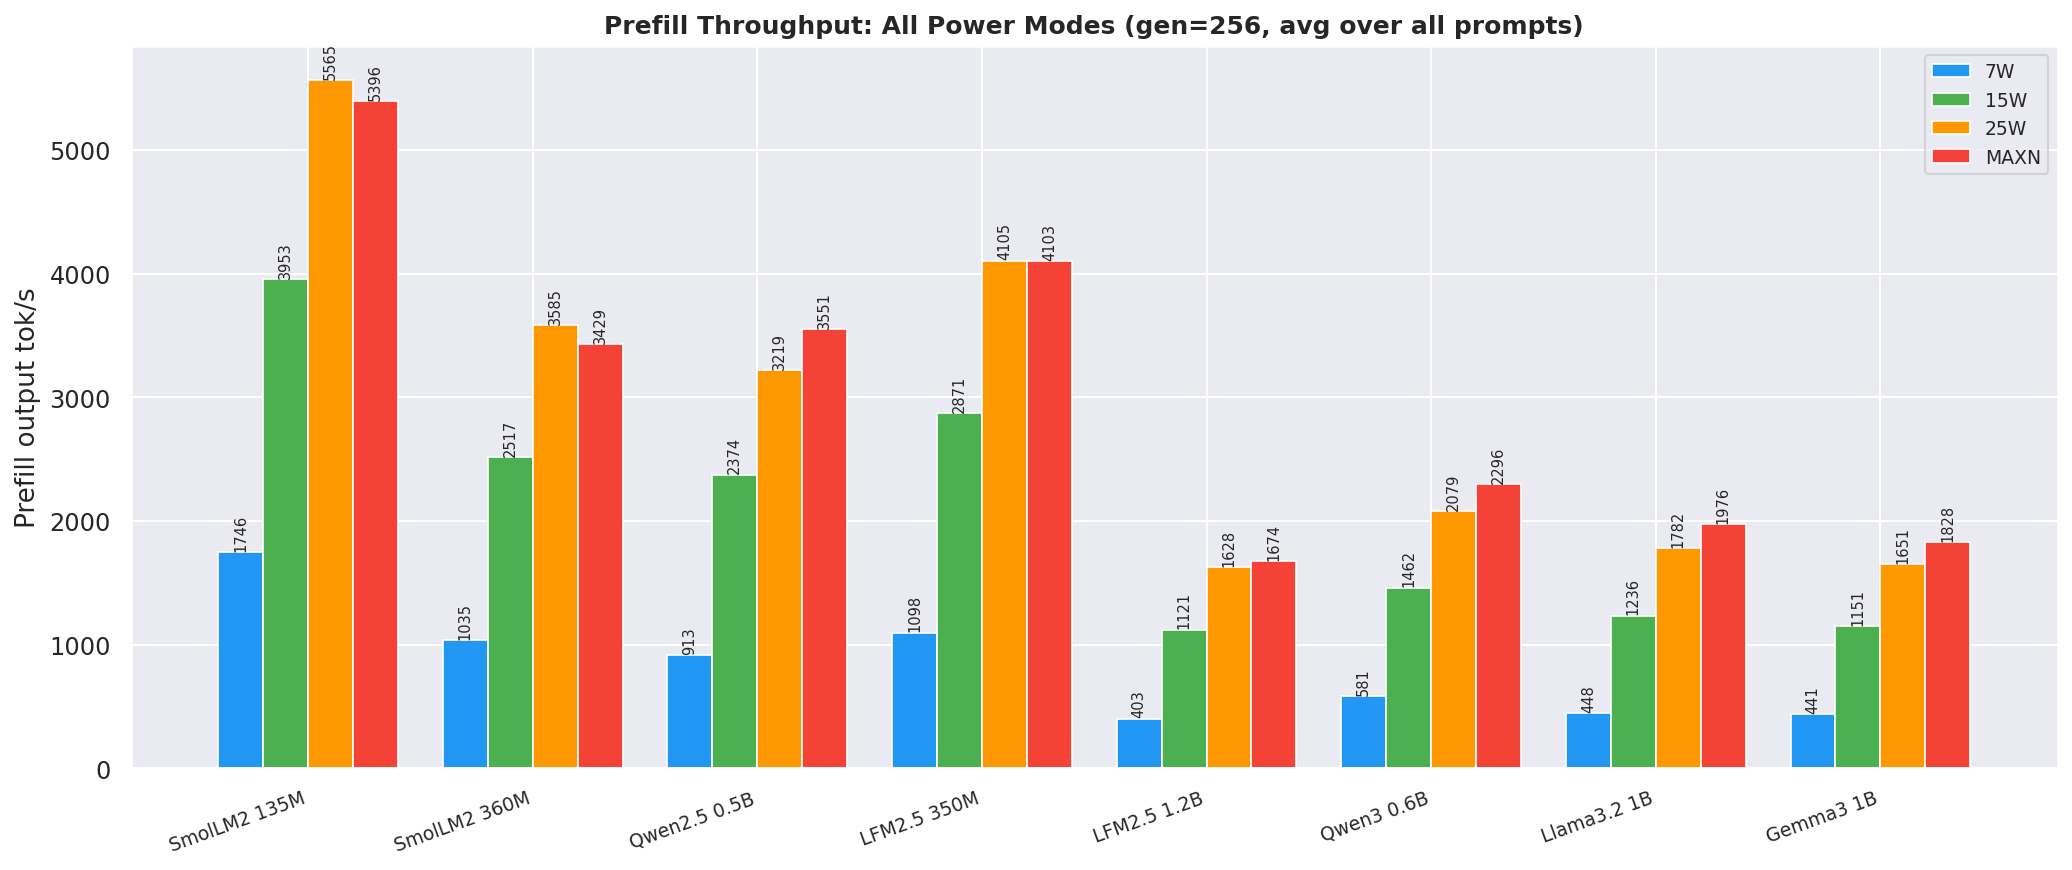
25W and MAXN provide ~35-40 % faster prefill than 15W:
Figure 10: Prefill throughput by power mode (gen=256, avg over all prompt lengths)
Average VDD_CPU_GPU_CV per model at each mode:
Figure 11: Average VDD_CPU_GPU_CV power draw per model at each power mode - canonical cell (ctx=2048, gen=256)
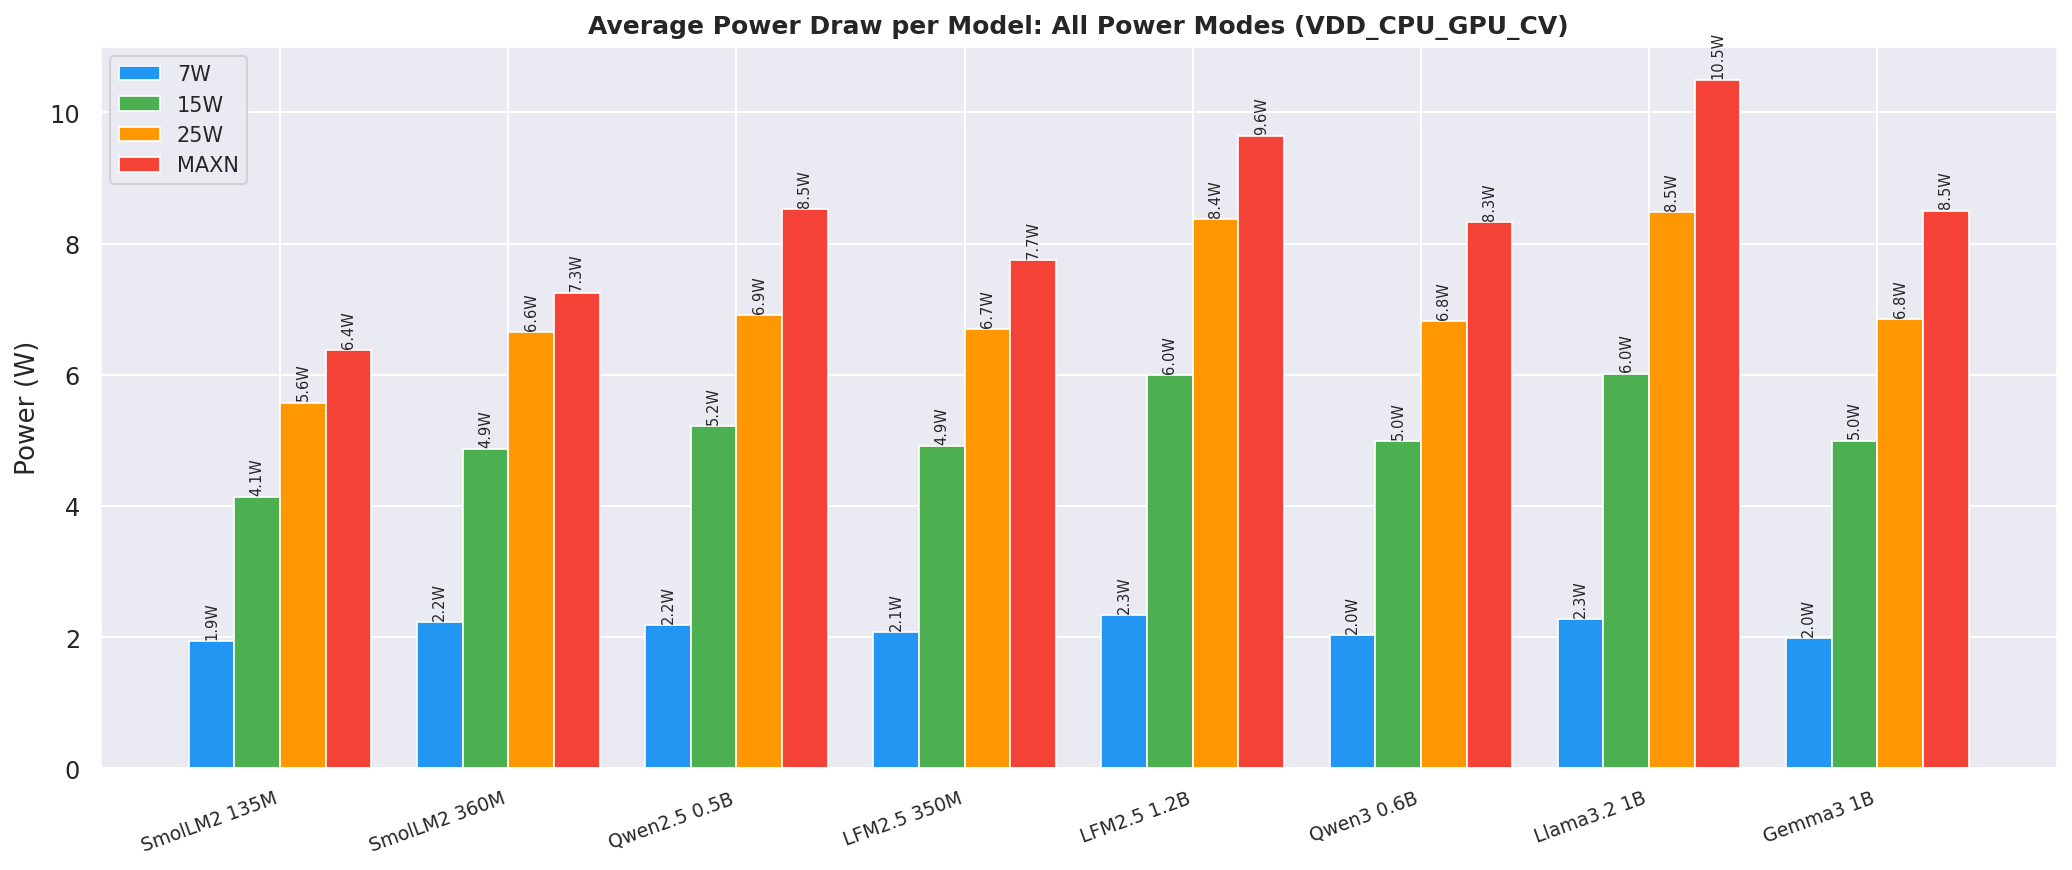
Table 8: Power draw ratio - Ollama ÷ llama.cpp VDD_CPU_GPU_CV (W) at each power mode - canonical cell (ctx=2048, gen=256)
Values < 1.00× mean Ollama draws less power than llama.cpp at that mode. Bold = ratio < 0.85× (Ollama ≥ 15 % lower power).
| Model | 7W ratio | 15W ratio | 25W ratio | MAXN ratio |
|---|---|---|---|---|
| SmolLM2-135M | 0.95× | 0.99× | 1.01× | 1.10× |
| SmolLM2-360M | 0.93× | 0.95× | 0.98× | 1.12× |
| Qwen2.5-0.5B | 0.91× | 0.86× | 0.88× | 0.90× |
| LFM2.5-350M | 0.85× | 0.76× | 0.65× | 0.71× |
| LFM2.5-1.2B | 0.88× | 0.78× | 0.65× | 0.70× |
| Qwen3-0.6B | 1.06× | 0.97× | 0.99× | 1.03× |
| Llama3.2-1B | 1.03× | 0.96× | 0.97× | 0.99× |
| Gemma3-1B | 1.05× | 0.95× | 0.96× | 0.93× |
As one can concur from the above table, >7W power mode - llama.cpp draws in less power than Ollama backend for all models except Qwen3-0.6B, Llama3.2-1B, and Gemma3-1B.
The average power draw of each mode increases with model size, but the relative increase from 7W → 15W → 25W → MAXN is consistent across models: ~2-3x from 7W to 15W, ~1.3-1.5x from 15W to 25W, and ~1.2-1.4x from 25W to MAXN.
In terms of Appendix B (Thermal) temperature, the average is 56.8 °C for models <= 0.5B and about 61.1 °C for models > 0.5B, ~4.3 °C cooler for the smaller models across all power modes. See Appendix B.1 for the full thermal data.
As one can see, the power draw across all the four modes, when locked at the maximum possible GPU and CPU clocks, is not the maximum one could receive. This is possibly because we do not fully utilize the GPU with our current settings, small batch-size, single user-single requests mode as the GPU is mostly occupied during the prefill stage and during decode its memory bandwidth bound, not compute bound.
Tok/s and tok/J side by side - see Figure 2. A faster mode does not always mean a more efficient one.
Corrected tok/J method (15W/25W/MAXN llama.cpp and all ollama):
output_tok_J=OSL÷ (decode_power_W×p50_decode_s) - decode-phase energy only, using per-request ns timestamps fromprofile_export.jsonl.
‡ 7W llama.cpp: approximated astok_s/VDD_CPU_GPU_CV(W) - no tegrastats in the HF 7W dataset.
Table 9: Canonical cell comparison - llama.cpp (ctx=2048, gen=256)
| Model | 7W tok/s |
15W tok/s |
25W tok/s |
MAXN tok/s |
7W tok/J‡ |
15W tok/J |
25W tok/J |
MAXN tok/J |
Peak tok/J |
|---|---|---|---|---|---|---|---|---|---|
| SmolLM2-135M | 53.8 | 114.7 | 165.2 | 159.5 | 27.0‡ | 27.58 | 29.62 | 24.72 | 25W |
| SmolLM2-360M | 34.9 | 70.6 | 102.2 | 89.6 | 15.4‡ | 14.71 | 15.50 | 12.64 | 25W |
| Qwen2.5-0.5B | 27.5 | 68.5 | 92.9 | 100.6 | 12.4‡ | 13.14 | 13.30 | 11.78 | 25W |
| LFM2.5-350M | 31.6 | 79.8 | 115.4 | 112.9 | 15.0‡ | 16.19 | 17.16 | 14.53 | 25W |
| LFM2.5-1.2B | 13.7 | 36.9 | 54.1 | 52.7 | 5.9‡ | 6.18 | 6.37 | 5.37 | 25W |
| Qwen3-0.6B | 14.2 | 33.9 | 49.4 | 54.3 | 7.2‡ | 6.83 | 7.26 | 6.68 | 25W |
| Llama3.2-1B | 12.1 | 32.3 | 47.1 | 51.9 | 5.4‡ | 5.34 | 5.48 | 4.89 | 25W |
| Gemma3-1B | 11.2 | 28.1 | 40.8 | 44.3 | 5.7‡ | 5.66 | 6.02 | 5.19 | 25W |
Table 10: Canonical cell comparison - Ollama (ctx=2048, gen=256)
| Model | 7W tok/s |
15W tok/s |
25W tok/s |
MAXN tok/s |
7W tok/J |
15W tok/J |
25W tok/J |
MAXN tok/J |
Peak tok/J |
|---|---|---|---|---|---|---|---|---|---|
| SmolLM2-135M | 36.4 | 84.4 | 120.6 | 132.2 | 19.21 | 20.14 | 21.26 | 18.65 | 25W |
| SmolLM2-360M | 21.0 | 48.5 | 69.9 | 76.4 | 10.01 | 10.41 | 10.61 | 9.46 | 25W |
| Qwen2.5-0.5B | 16.5 | 39.4 | 55.6 | 61.2 | 7.80 | 8.70 | 8.95 | 7.84 | 25W |
| LFM2.5-350M | 15.5 | 23.8 | 27.5 | 29.8 | 9.02 | 6.64 | 6.39 | 5.49 | 7W |
| LFM2.5-1.2B | 9.8 | 19.1 | 21.8 | 23.0 | 4.77 | 4.10 | 3.94 | 3.43 | 7W |
| Qwen3-0.6B | 14.0 | 32.5 | 46.7 | 51.3 | 4.10 | 6.78 | 6.99 | 6.09 | 25W |
| Llama3.2-1B | 11.8 | 31.2 | 44.8 | 49.9 | 5.06 | 5.38 | 5.38 | 4.73 | 15W/25W |
| Gemma3-1B | 9.8 | 24.3 | 34.9 | 35.8 | 4.08 | 5.10 | 5.28 | 4.47 | MAXN |
Table 11: Recommended power mode by use case
| Use case | Recommended mode |
|---|---|
| Always-on inference | 25W: overall best low TTFT, output tok/J, tok/sec and latency, 45 % faster than 15W |
| real-time response, streaming | MAXN: ~35 % faster prefill than 15W, ~31–38 % lower TTFT, ~29–38 % lower total request time (prefill + decode), and ~6–11 % lower decode time than 25W |
| Power-constrained / thermally limited | 15W: 30-40 % less power draw than MAXN |
| Edge AI / Smartphone deployment | 7W: all 8 models fit (reboot per run required); useful for efficiency research at minimum power |
Per combo (20 requests): tok/s uses aiperf avg (p50 unavailable for throughput); all latency metrics use p50.
Figure 12: Output throughput speedup ratios - llama.cpp vs Ollama, canonical cell (ctx=2048, gen=256)
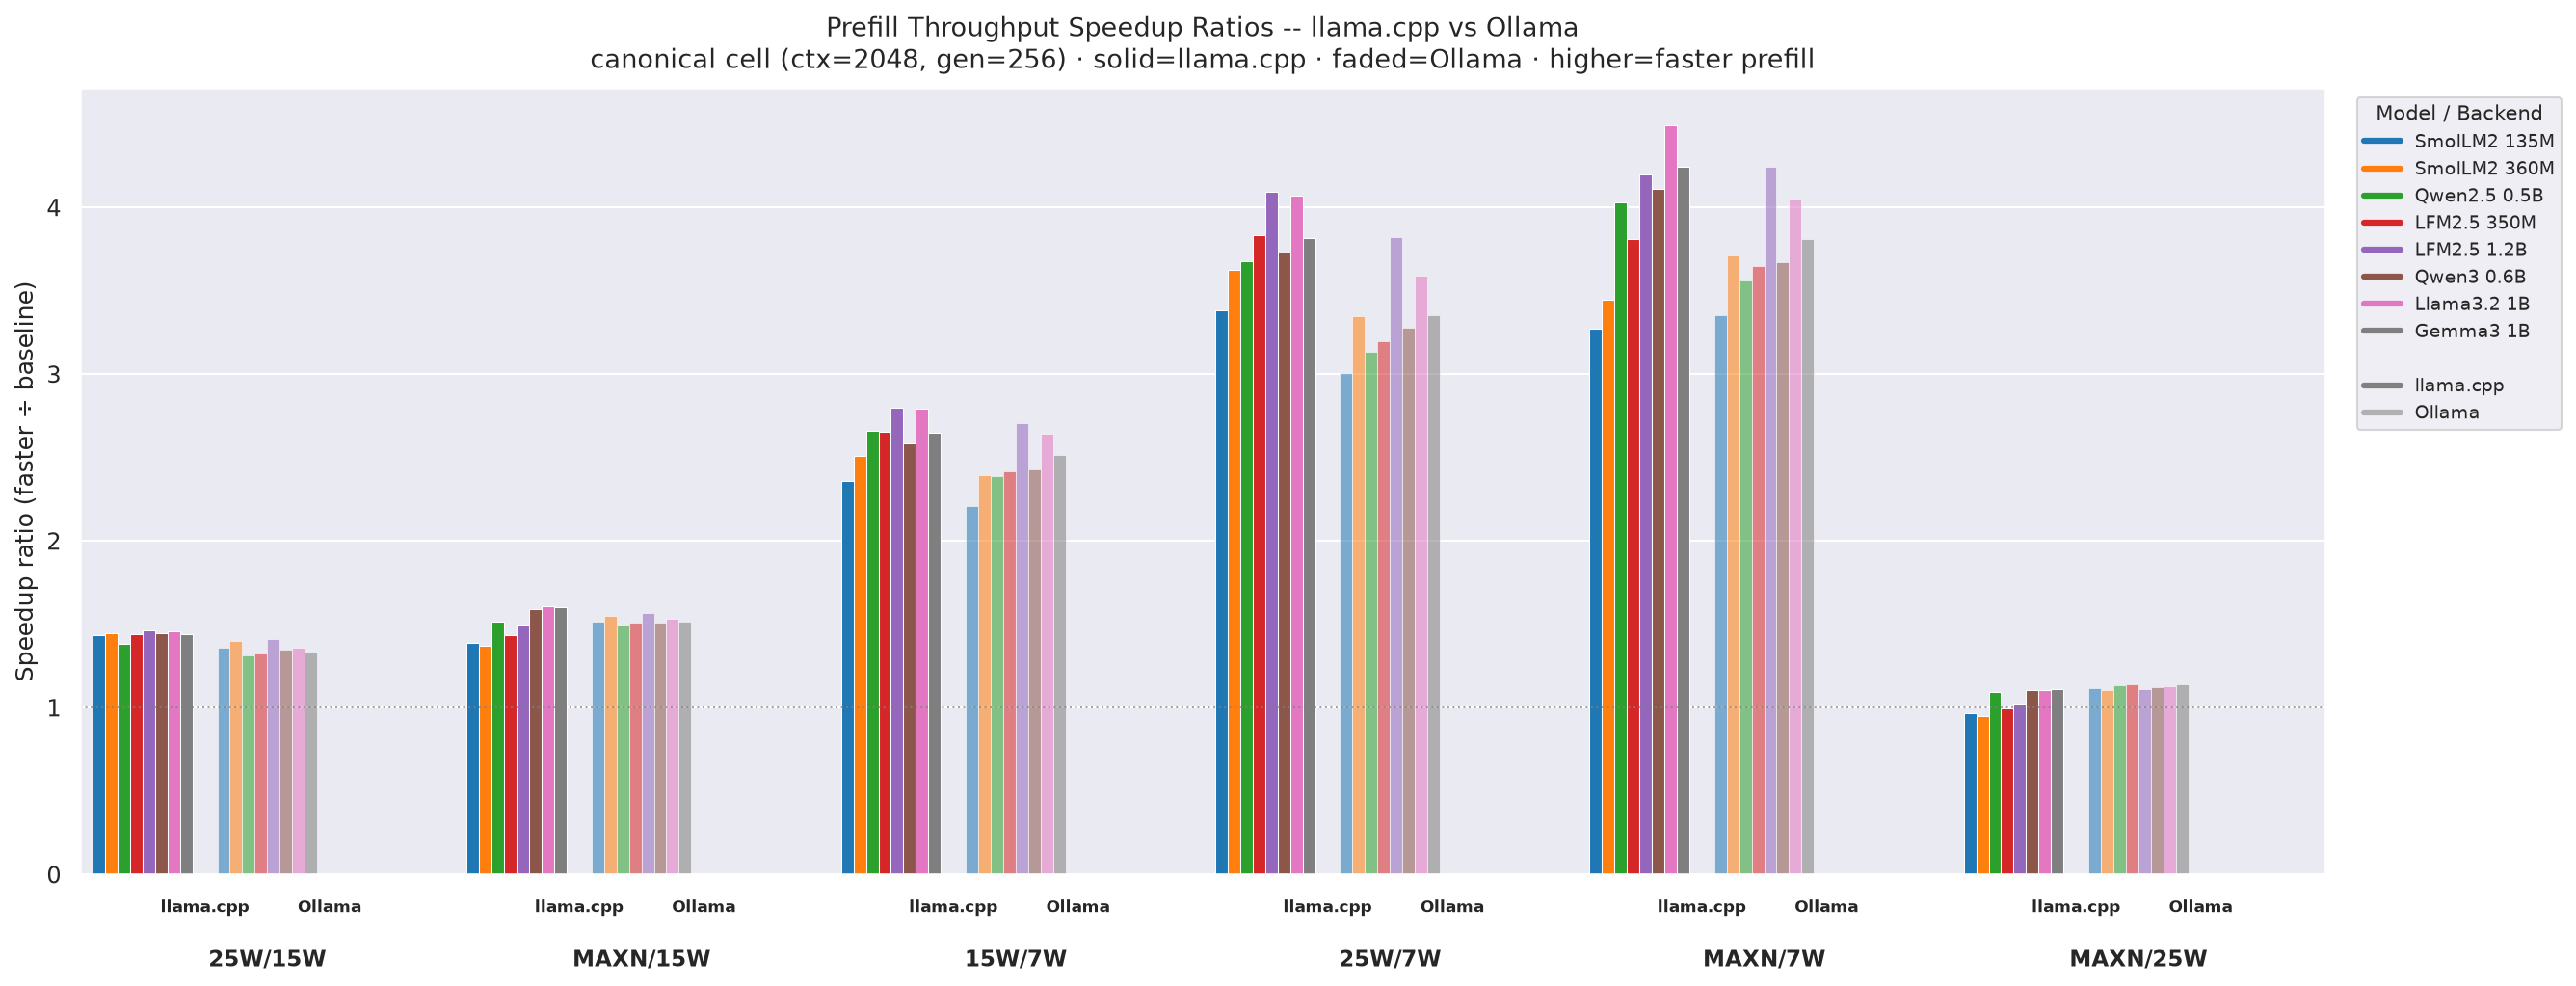
Figure 13: Prefill throughput speedup ratios - llama.cpp vs Ollama, canonical cell (ctx=2048, gen=256)
The highest leverage from both the speedup ratio could be achieve only going from 7W to 25W or MAXN, as the 15W mode is not fully utilizing the GPU and CPU clocks. The 7W mode is a low-power mode that is not suitable for high-throughput workloads, but it can be used for low-power deployments where energy efficiency is more important than throughput.
TTFT scales near-linearly with prompt across all modes. At ctx=128 a model like LFM2.5-350M prefills in ~80 ms (25W); at ctx=2048 that grows to ~820 ms. The 25W / MAXN modes reduce TTFT proportionally to their clock ratio vs 15W.
Inter-token latency (ITL) p50 is the median per-token decode cost. Full ITL vs prompt/gen line charts are in Appendix G. At the canonical ctx=2048, gen=256 - by power mode:
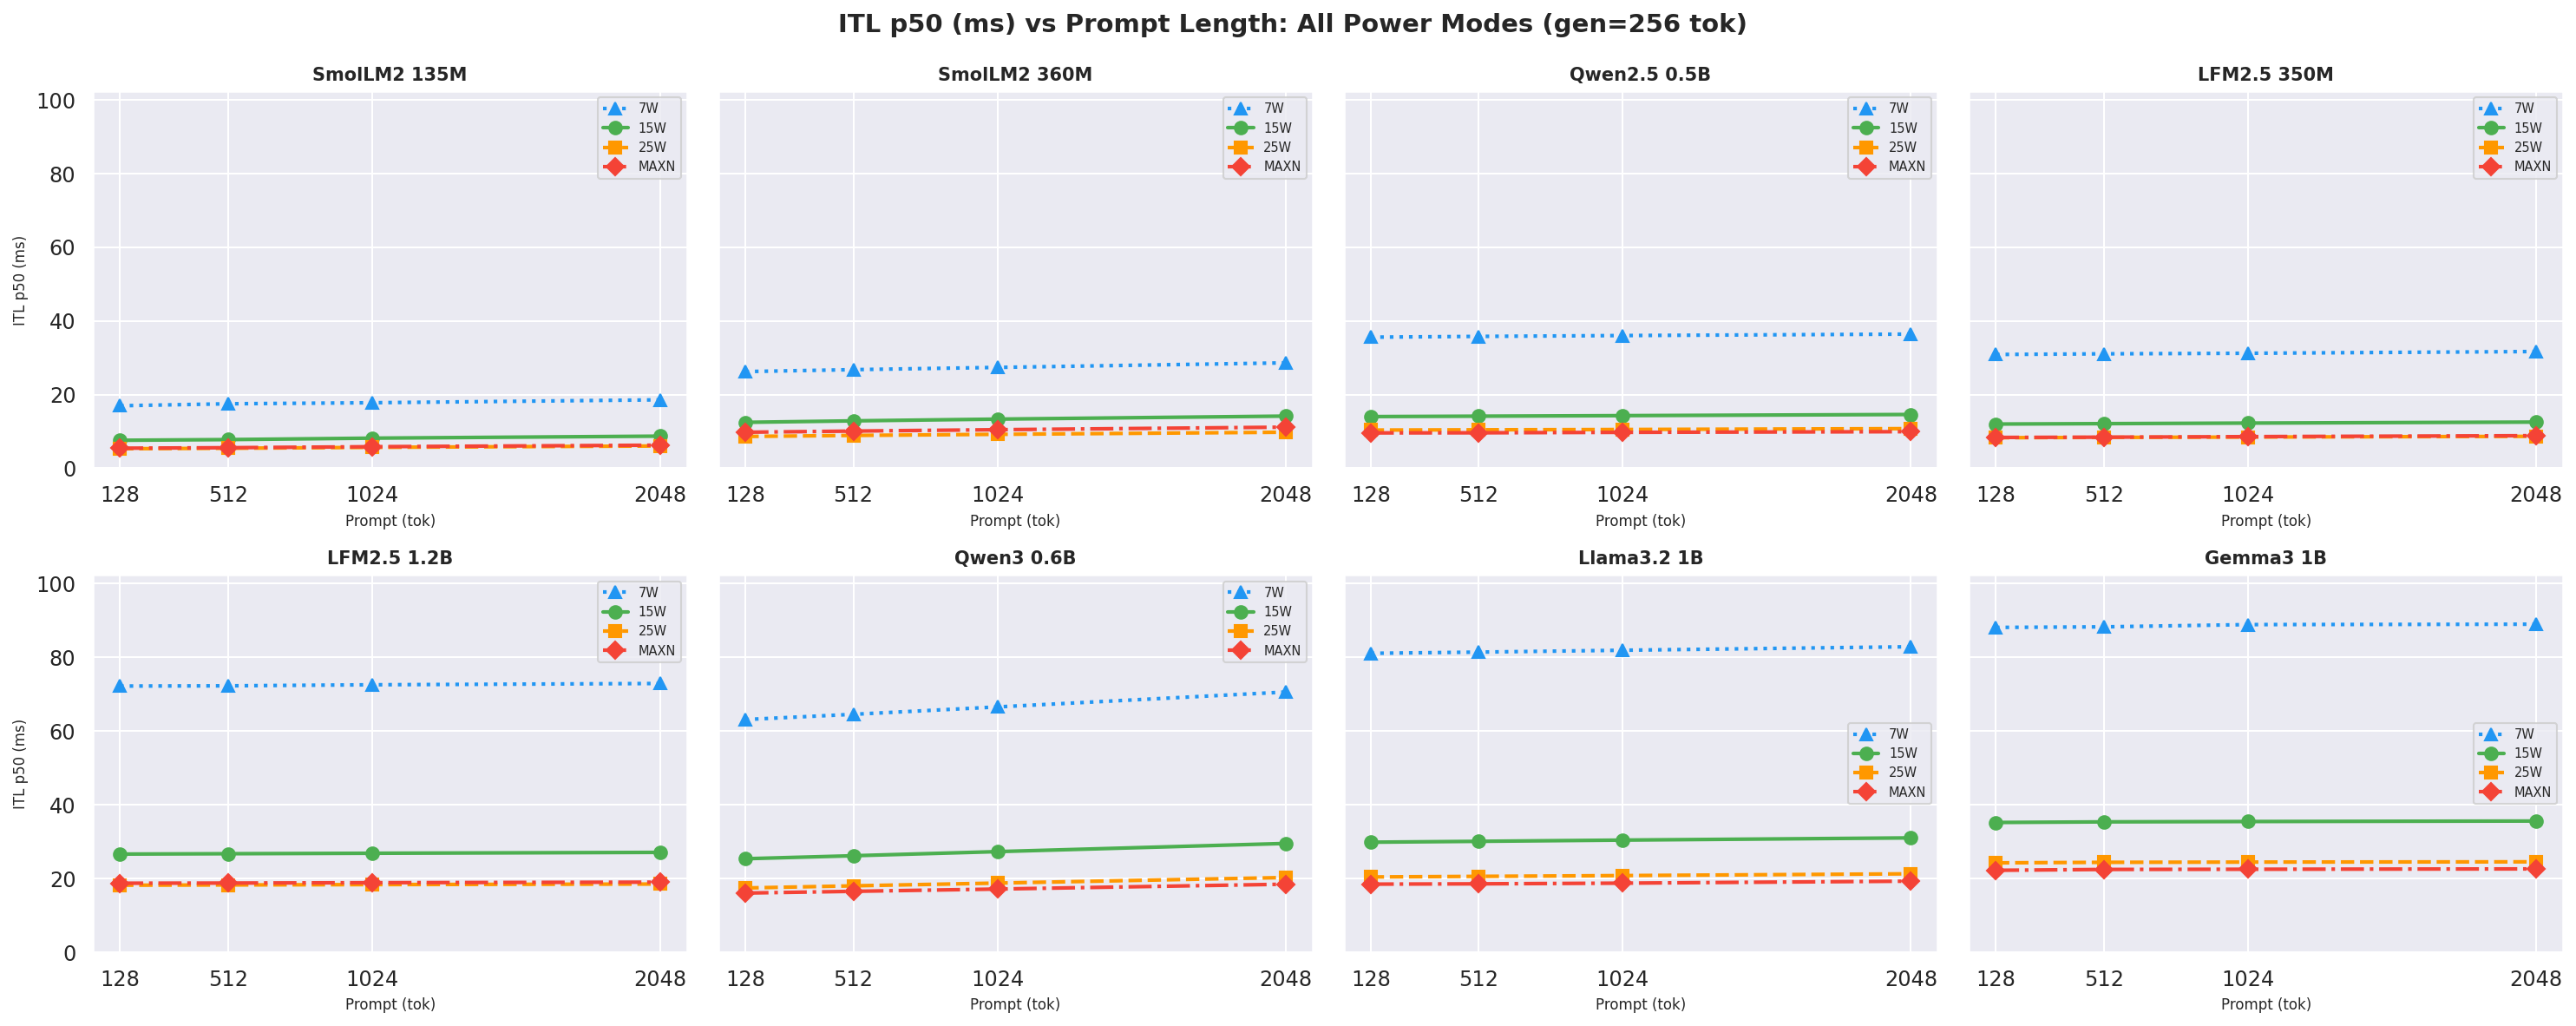
Figure 14: ITL p50 by power mode - all models (gen=256, ctx=2048)
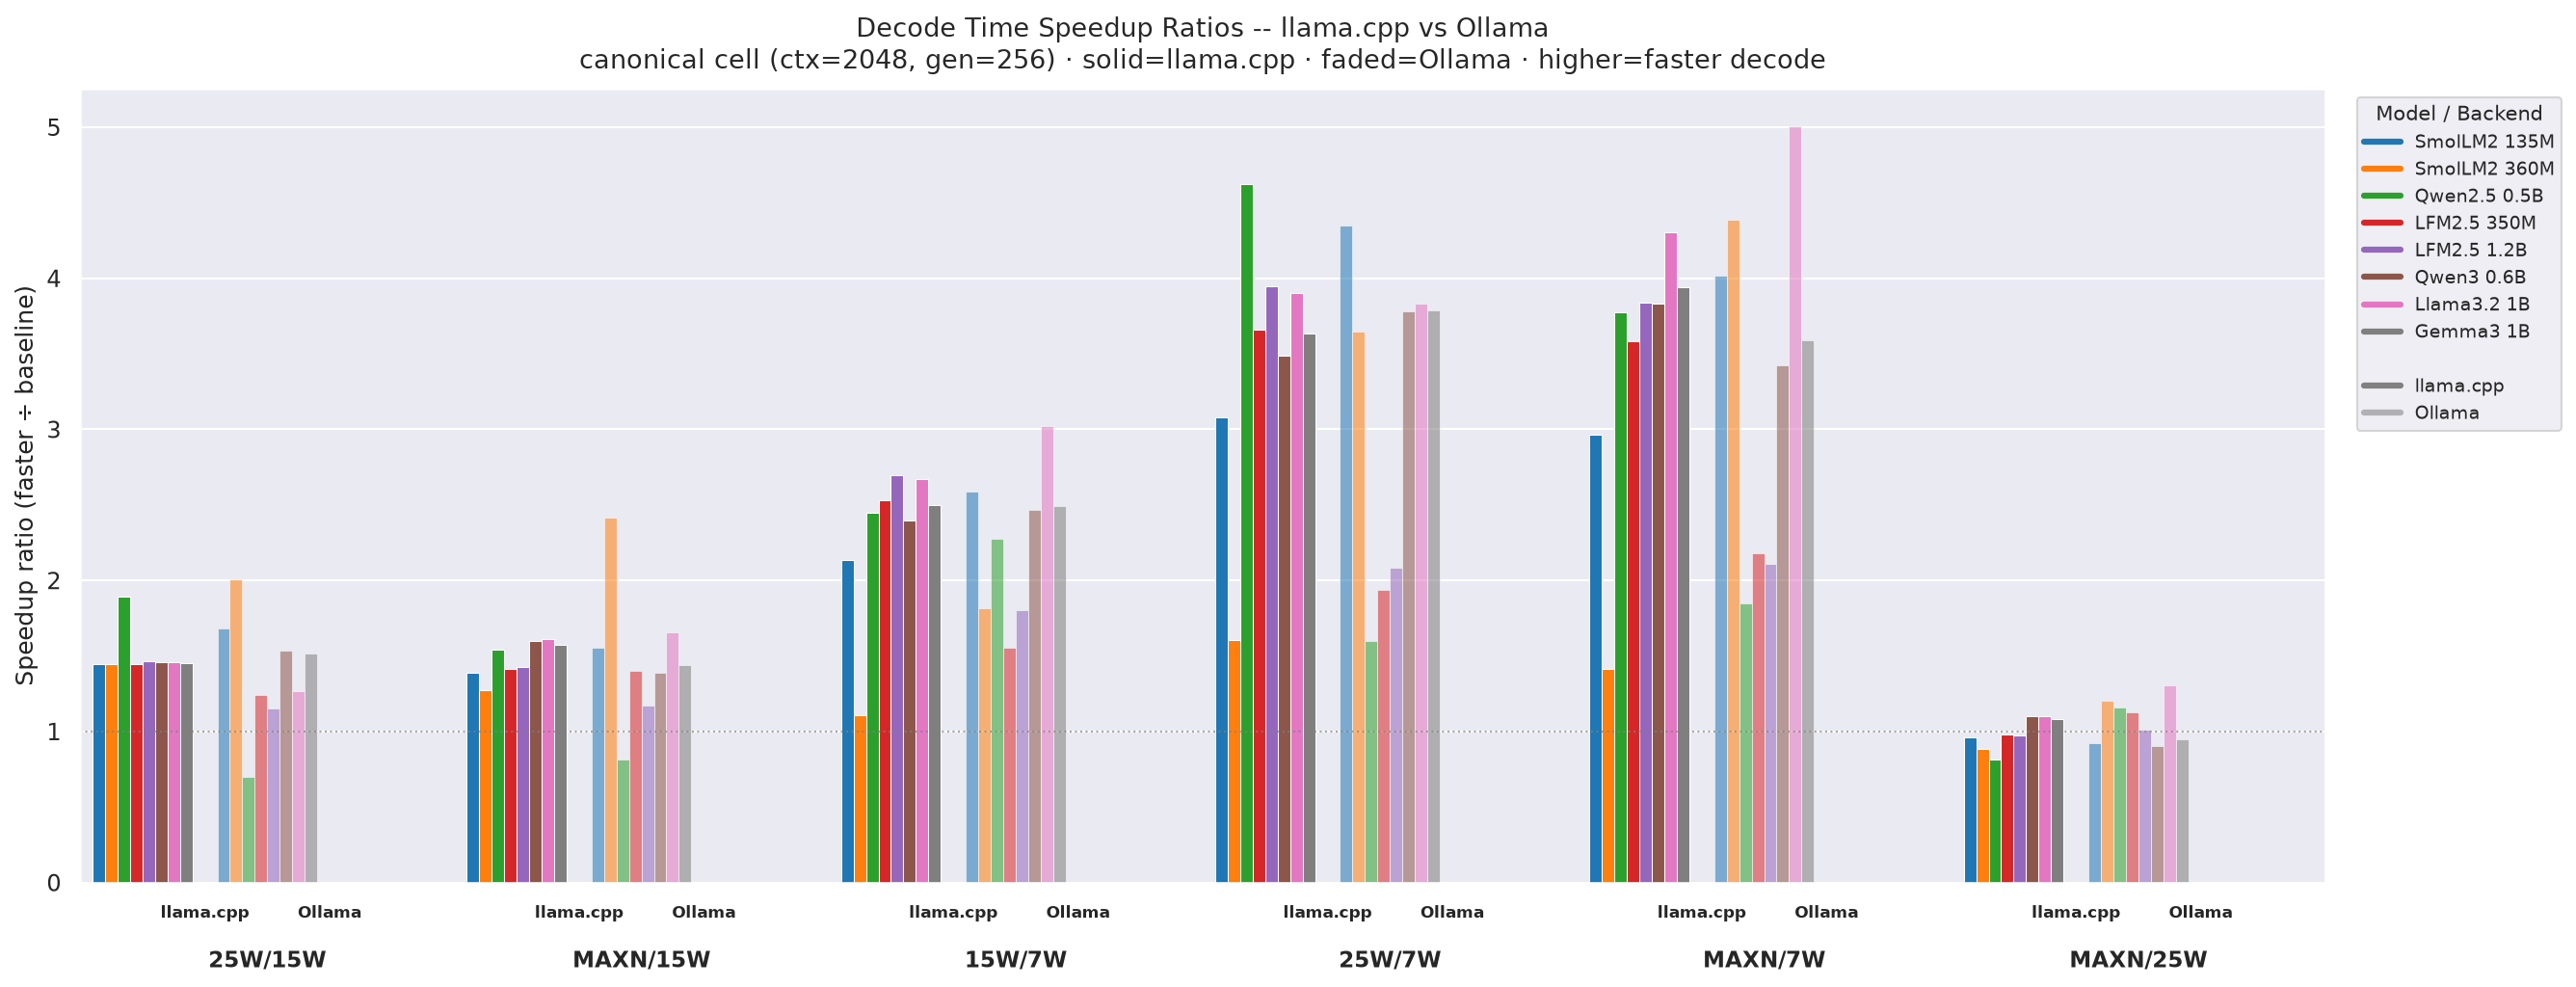
ITL depends on gen-length (64, 128, 256) and to some extent reflects the memory-bandwidth bound.ITL than ~1B models, possibly because the KV-cache stays small enough to avoid refills.Decode time (s) p50 is the time spent generating output tokens: decode_time = request_latency - TTFT (see p50_decode_s definition). At ctx=2048, gen=256 - speedup = p50(decode_time_baseline) / p50(decode_time_mode):
Figure 15: Decode time speedup ratios - llama.cpp vs Ollama, canonical cell (ctx=2048, gen=256)
tok_s once TTFT is subtracted.| Model | Params | GGUF | Best total tok/J | At mode / ctx / gen |
|---|---|---|---|---|
| SmolLM2-135M | 135M | 101 MB | 487.3 | 25W / 2048 / 64 |
| LFM2.5-350M | 350M | 219 MB | 330.7 | 25W / 2048 / 64 |
| SmolLM2-360M | 360M | 369 MB | 262.3 | 25W / 2048 / 64 |
| Qwen2.5-0.5B | 500M | 469 MB | 237.7 | 25W / 2048 / 64 |
| Qwen3-0.6B | 600M | 610 MB | 149.0 | 25W / 2048 / 64 |
| Gemma3-1B | 1.0B | 769 MB | 118.5 | 25W / 2048 / 64 |
| LFM2.5-1.2B | 1.2B | 698 MB | 116.2 | 25W / 2048 / 64 |
| Llama3.2-1B | 1.0B | 771 MB | 108.9 | 25W / 2048 / 64 |
Total tok/J = (
ISL+OSL) / (avg_power_W ×RL_p50_s) - see Appendix I.6 for the full formula. Peaks at ctx=2048, gen=64 for every model because the long prompt dominates the numerator while 25W minimises energy per token. All 48 mode × ctx × gen combinations were searched under llama.cpp.
SmolLM2-135M at 25W under llama.cpp achieves 487 total tok/J, nearly 4.5× more efficient than Llama3.2-1B across the full request.
Two complementary tok/J lenses on energy efficiency - see I.6 for formulas:
OSL / decode_J - output tokens generated per joule of decode energy only (TTFT excluded). Measures how efficiently the GPU runs the autoregressive generation loop.ISL + OSL) / total_J - all tokens processed per joule of the full request. Accounts for both prompt processing and generation; favours models that handle long prompts cheaply.See Figure 5 (decode tok/J vs prompt length) and Figure 6 (total tok/J vs prompt length) in section 2.2 - 25W leads at every model and prompt length.
Figure 16: Total energy per request vs output length at 25W, ctx=2048
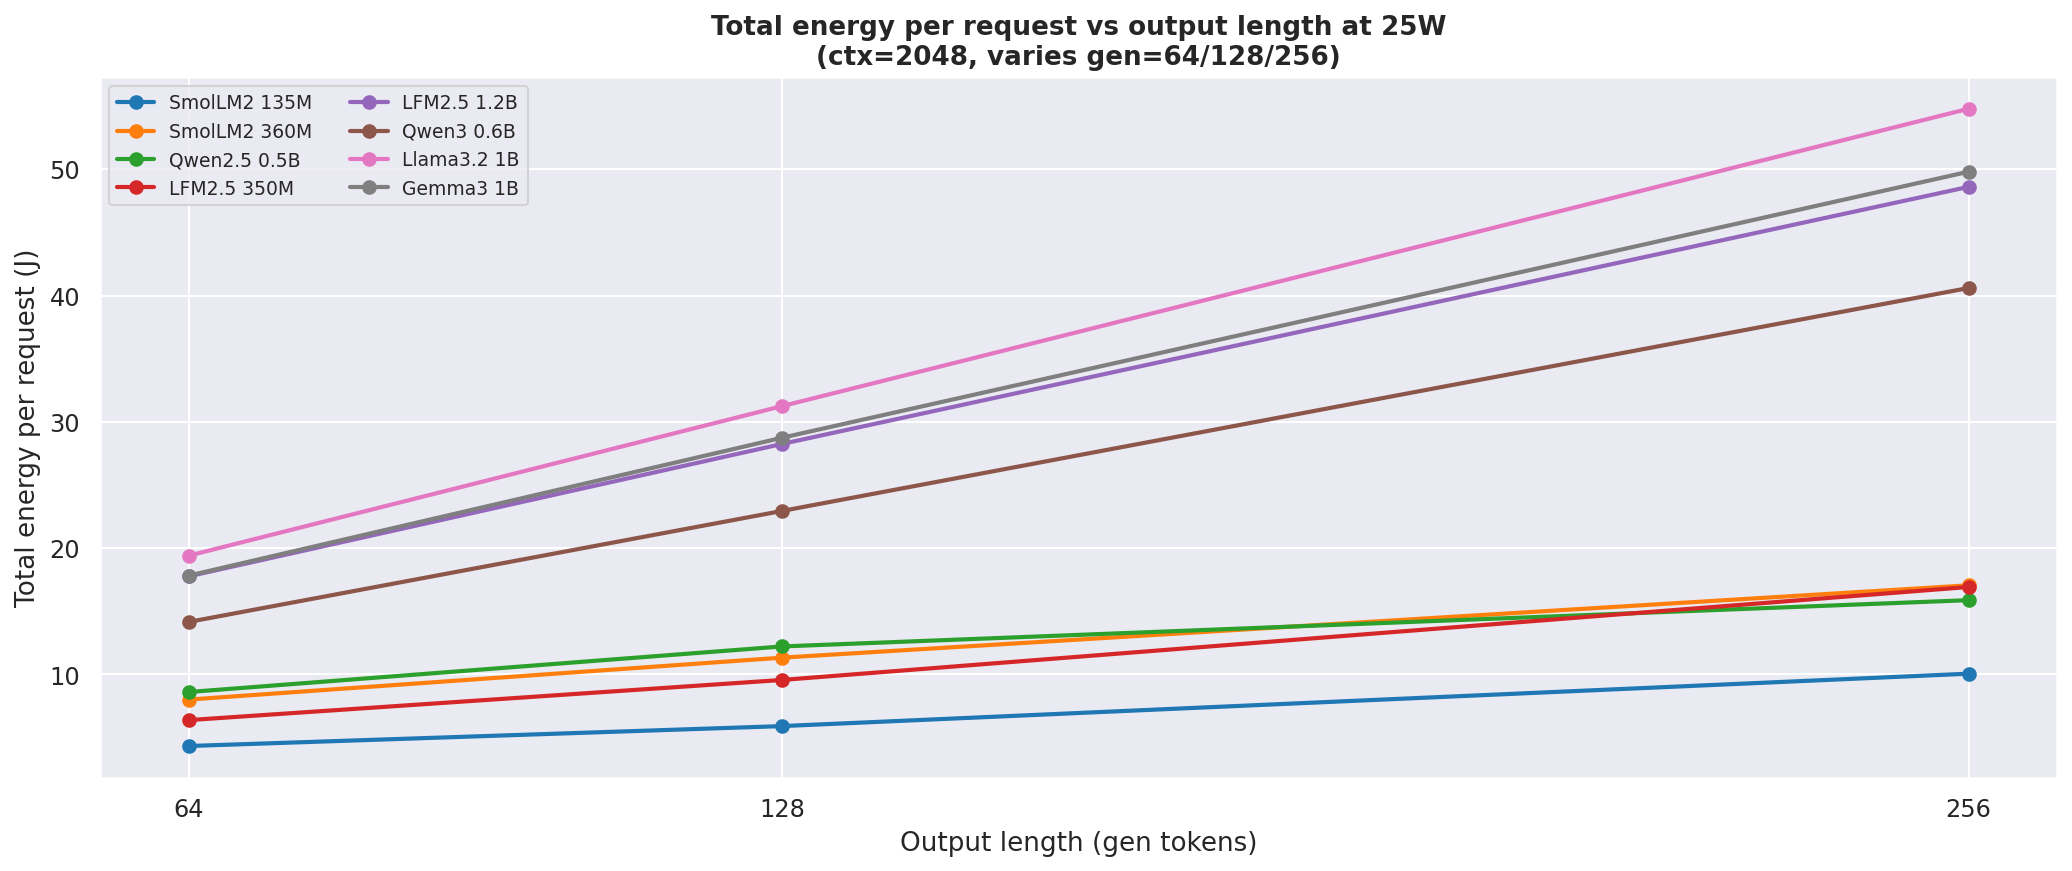
Figure 17: Decode energy per output token in mJ (ctx=2048, gen=256)
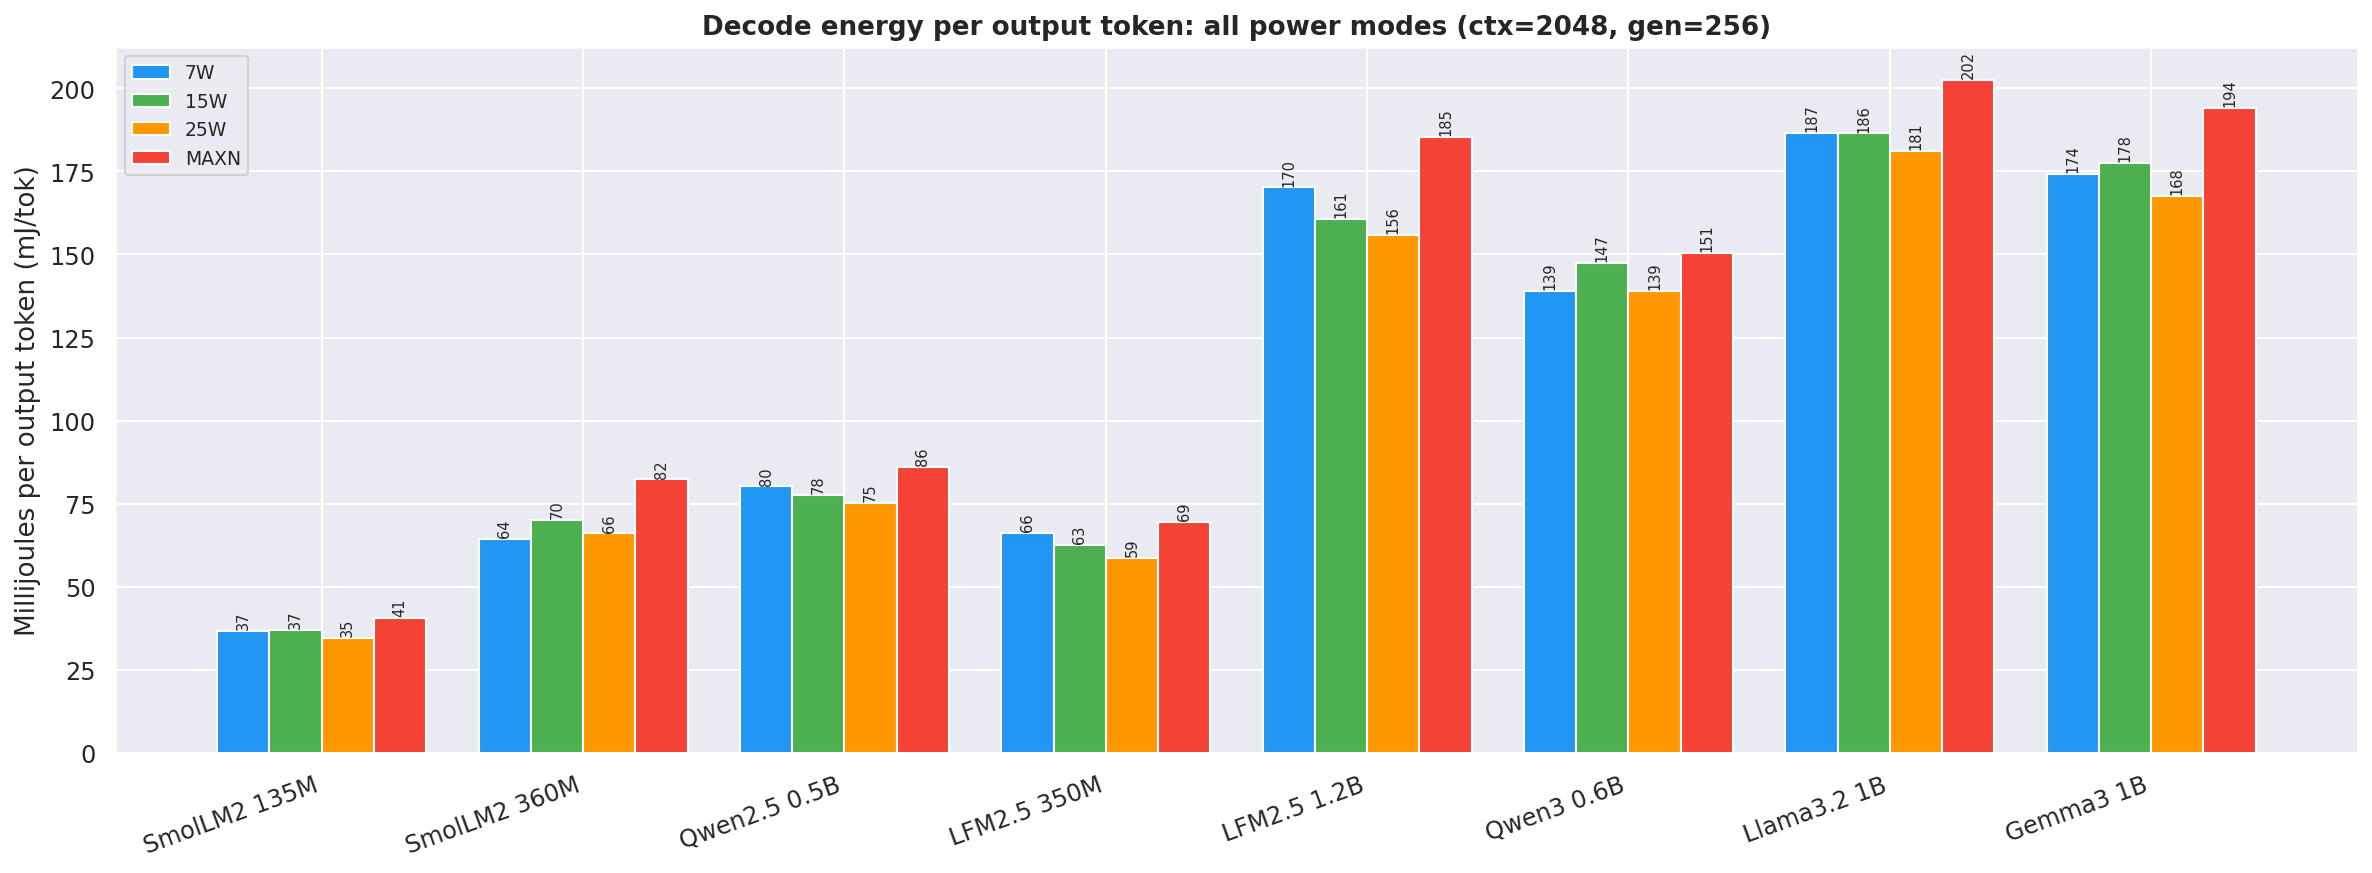
25W wins on both metrics for every model under llama.cpp (corrected decode-phase tok/J). 25W decode tok/J (15.50 for SmolLM2-360M) consistently beats both 15W (14.71) and MAXN (12.64) across all models — see Figure 5 (decode tok/J) and Figure 6 (total tok/J).
~1B models top at ~5-8 tok/J (decode) whereas sub-1B models reach 14-35 tok/J. Size is the dominant factor for output generation efficiency.
Charts in D.2 show that ~1B models are roughly flat across prompt lengths in decode tok/J - decode is purely output-length bound and ignores prompt length once TTFT is excluded.
ISL dominates (ISL+OSL) as ctx increases while total_J grows more slowly (decode time is constant), see D.3.25W is unambiguously the best mode for output tok/J and tok/sec across every model under llama.cpp. The reason is arithmetic:
On latency: 25W also delivers strong TTFT speedups (1.38–1.46× vs 15W) and decode-time speedups (1.35–1.46× vs 15W), making it competitive for interactive use. MAXN improves TTFT further (1.37–1.61× vs 15W), but the decode-time gain over 25W is marginal for sub-360M models (< 1.0×) — see Figure 15. Total request time (prefill + decode) at 25W is 28–32 % lower than 15W at the canonical cell, while MAXN shaves only another 2–8 % off total time, confirming diminishing returns from the extra clock.
The GPU clock ceiling at 15W (612 MHz) leaves significant decode throughput on the table. Raising it to 820 MHz at 25W captures most of the available throughput improvement with modest additional power. The final jump to 1020 MHz at MAXN costs disproportionate power for marginal gains.
Practical recommendation: Run at 25W for the best balance of speed and efficiency. Use MAXN only when minimising latency (
TTFT) matters more than energy (e.g. interactive chat with long prompts).
Both backends ran identical quantized models (Q4_K_M / Q8_0 to match Ollama’s pull defaults) at single-user concurrency on the same hardware. Ollama data covers all four power modes (7W, 15W, 25W, MAXN) - 8 models at all four modes.
At 15W (the fairest comparison - both have complete data):
| Model | llama.cpp tok/s |
Ollama tok/s |
LC ÷ OL | llama.cpp tok/J |
Ollama tok/J |
LC ÷ OL tok/J |
|---|---|---|---|---|---|---|
| SmolLM2-135M | 114.7 | 84.4 | 1.36× | 27.58 | 20.14 | 1.37× |
| SmolLM2-360M | 70.6 | 48.5 | 1.45× | 14.71 | 10.41 | 1.41× |
| Qwen2.5-0.5B | 68.5 | 39.4 | 1.74× | 13.14 | 8.70 | 1.51× |
| LFM2.5-350M | 79.8 | 23.8 | 3.35× | 16.19 | 6.64 | 2.44× |
| LFM2.5-1.2B | 36.9 | 19.1 | 1.94× | 6.18 | 4.10 | 1.51× |
| Qwen3-0.6B | 33.9 | 32.5 | 1.04× | 6.83 | 6.78 | 1.01× |
| Llama3.2-1B | 32.3 | 31.2 | 1.04× | 5.34 | 5.38 | 0.99× |
| Gemma3-1B | 28.1 | 24.3 | 1.16× | 5.66 | 5.10 | 1.11× |
1. Architecture matters more than backend for large-enough models.
Qwen3-0.6B and Llama3.2-1B are nearly identical between backends across all four power modes (~1-6 % difference in both tok/s and tok/J). These models are pure memory-bandwidth-bound at single concurrency: their KV-cache access pattern saturates the LPDDR5 bus regardless of server overhead. llama.cpp’s leaner inference path gives no useful advantage here.
2. llama.cpp wins decisively for sub-500M models and LFM2.5.
SmolLM2-135M is 36 % faster under llama.cpp; SmolLM2-360M is 45 % faster. The gap is even wider for Qwen2.5-0.5B (74 %) and - most strikingly - LFM2.5-350M, where llama.cpp is 3.35× faster (79.8 vs 23.8 tok/s at 15W), widening to 4.20× at 25W (115.4 vs 27.5 tok/s). LFM2.5 uses a hybrid SSM/attention architecture; Ollama’s CUDA kernels appear not to be optimised for this op mix, while llama.cpp’s GGML backend handles it efficiently. LFM2.5-1.2B shows the same pattern: 1.94× at 15W, 2.48× at 25W.
3. Power draw is similar but Ollama runs slightly cooler.
At 15W, Ollama draws ~4-15 % less VDD_CPU_GPU_CV than llama.cpp for the same model. The saving is real but small - the GPU is still doing the same matrix-multiply work; the difference is likely overhead in the server processing path reducing effective GPU duty-cycle.
4. Best of both worlds recommendation.
| Use case | Backend | Power mode | Model |
|---|---|---|---|
| Max throughput / efficiency, sub-1B | llama.cpp | 25W | SmolLM2-135M |
| Throughput parity with easier deployment | Ollama | 25W | Qwen3-0.6B / Llama3.2-1B |
| Power-constrained, single model | llama.cpp | 15W | SmolLM2-135M |
Tiny LLM inference on a $250 Jetson Orin Nano Super 8GB is genuinely practical. At SmolLM2-135M Q4_K_M under llama.cpp at 25W:
The LFM2.5 models (Liquid AI) are a notable new entrant under llama.cpp: LFM2.5-350M achieves 115 tok/s at 25W (nearly matching SmolLM2-360M) in 219 MB. Under Ollama, LFM2.5 drops to 23.8 tok/s - a 3.35× gap that points to missing CUDA kernel optimisations in Ollama’s GGML backend for SSM/hybrid ops.
25W (nvpmodel -m 1) is the Pareto-optimal power mode for edge LLM inference on the Jetson Orin Nano Super. It is the right answer for virtually every deployment:
Use MAXN only when raw TTFT matters (live interactive sessions with long prompts). Use 15W or below only when thermally constrained. Never use 7W for production inference: CMA fragmentation will eventually block model loads.
Ollama now has data at all four power modes (7W, 15W, 25W, MAXN). Key findings:
ollama pull model management or need near-parity throughput for Qwen3-0.6B and Llama3.2-1B.cudaMalloc calls requiring > 300 MB contiguous buffers. Qwen3-0.6B, Llama3.2-1B, and Gemma3-1B all hit NvMapMemAllocInternalTagged: error 12 (ENOMEM) when loaded after other models without a reboot. A reboot + --resume run recovered all three. All 8 models produced valid 7W data after this workaround; the full 96-cell 7W dataset is complete.
Figure A.1 - Output Tok/s (top, bold) + TTFT p50 ms (bottom, faded)
tok/s rises left → right; TTFT falls left → right - the two groups form a natural X-pattern and sit in opposite corners, so they stay visually separate throughout.
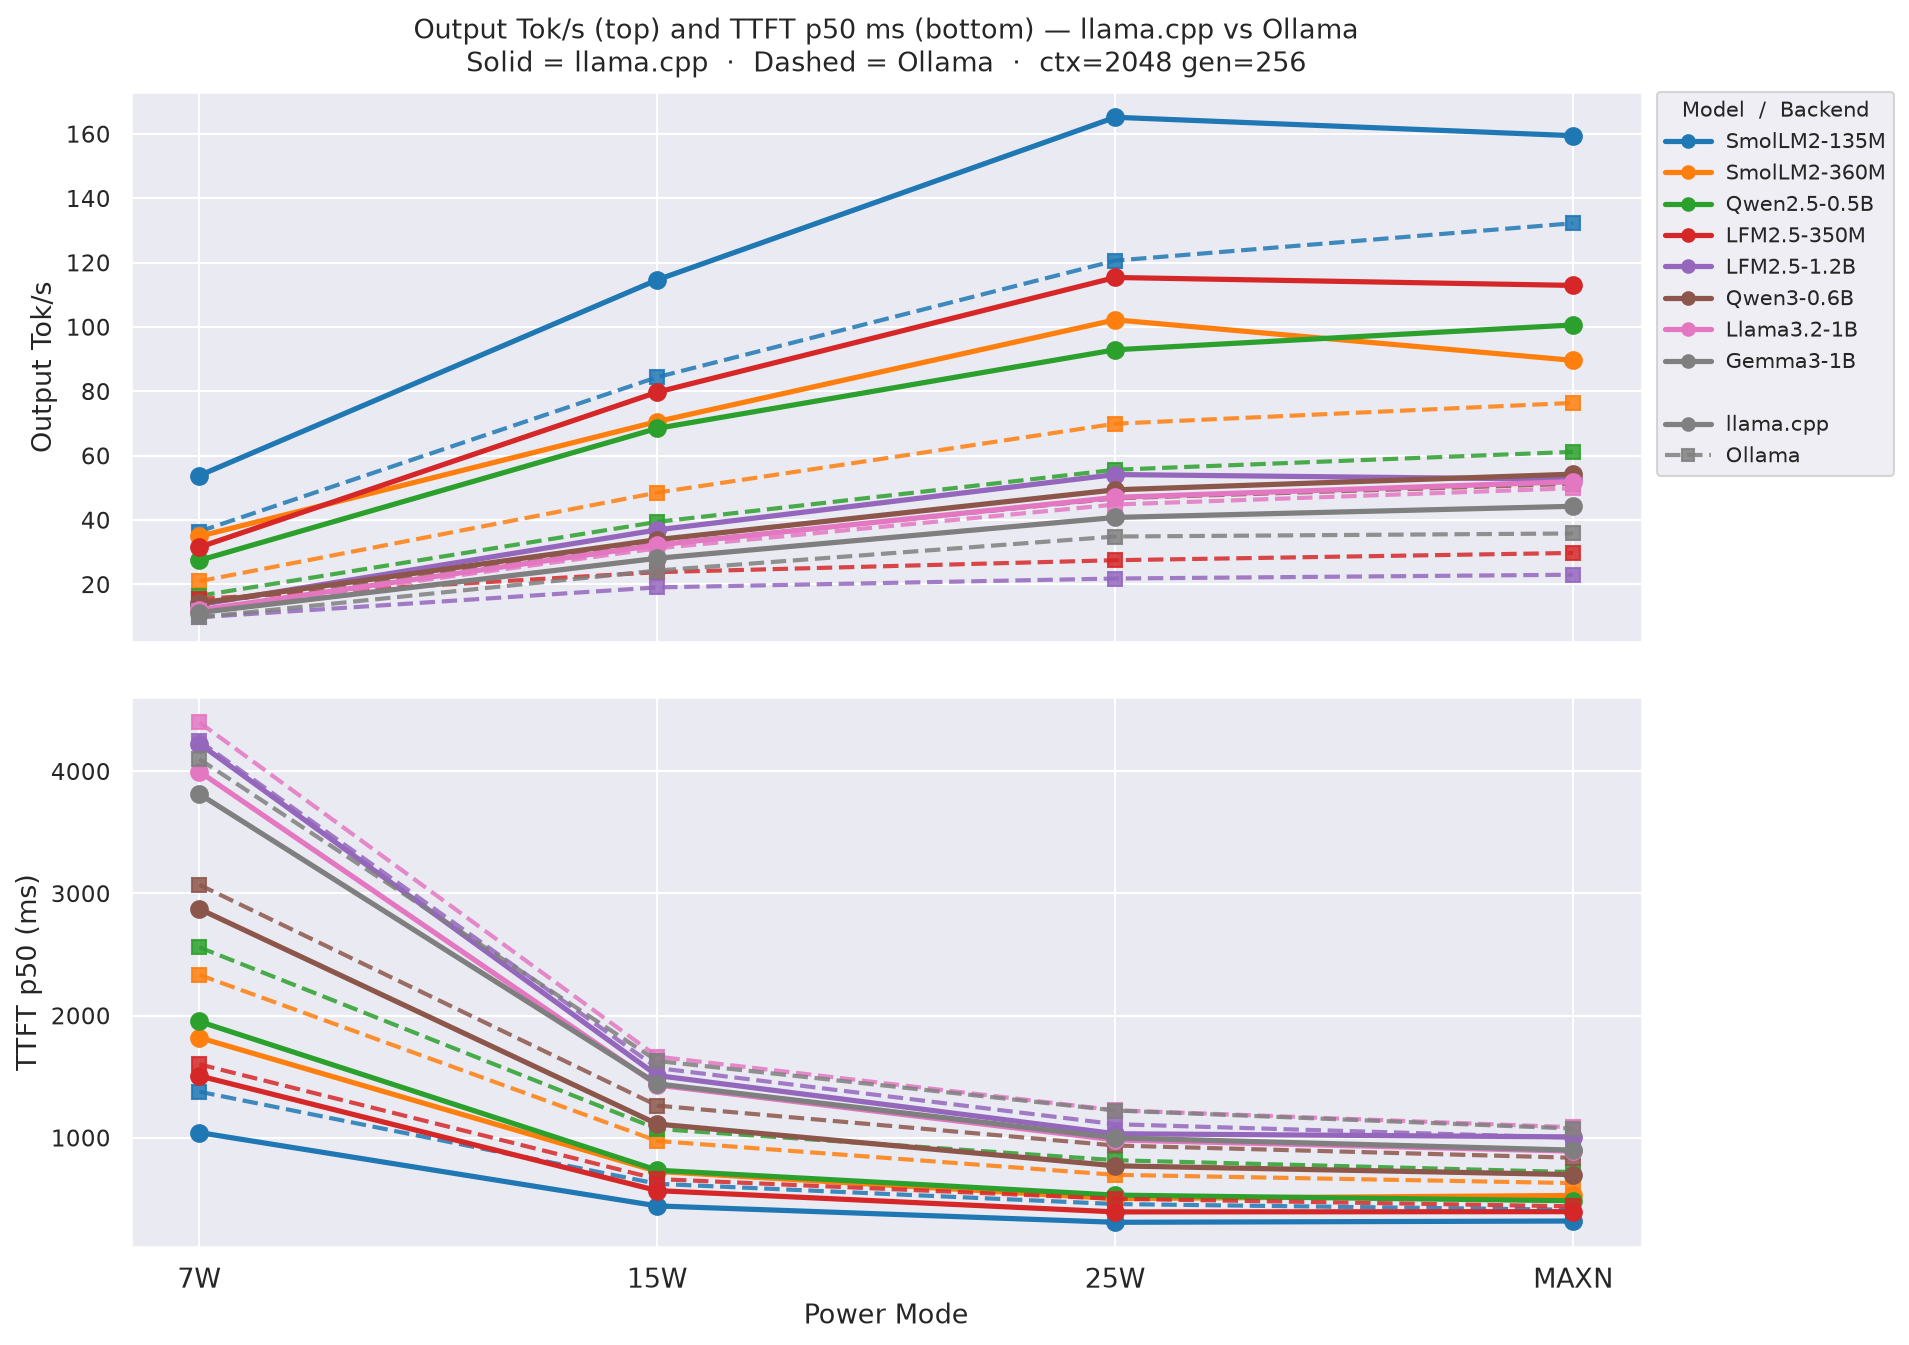
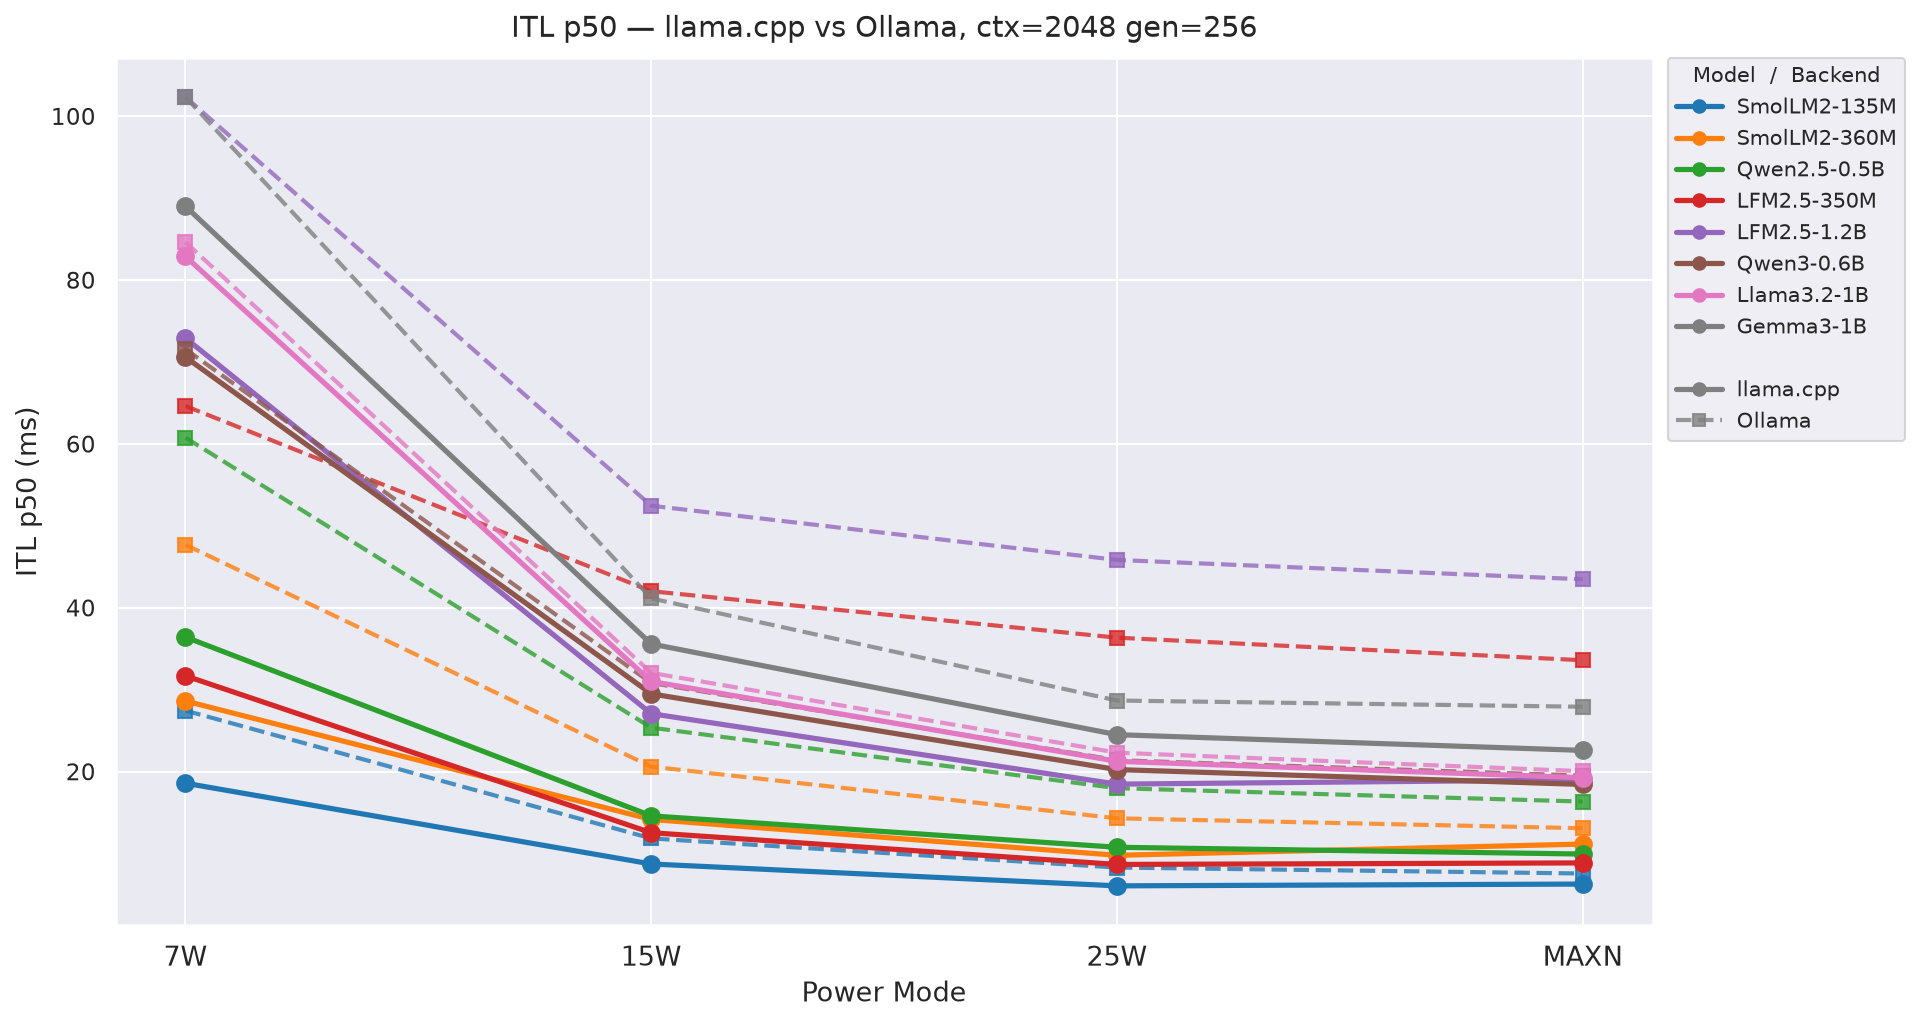
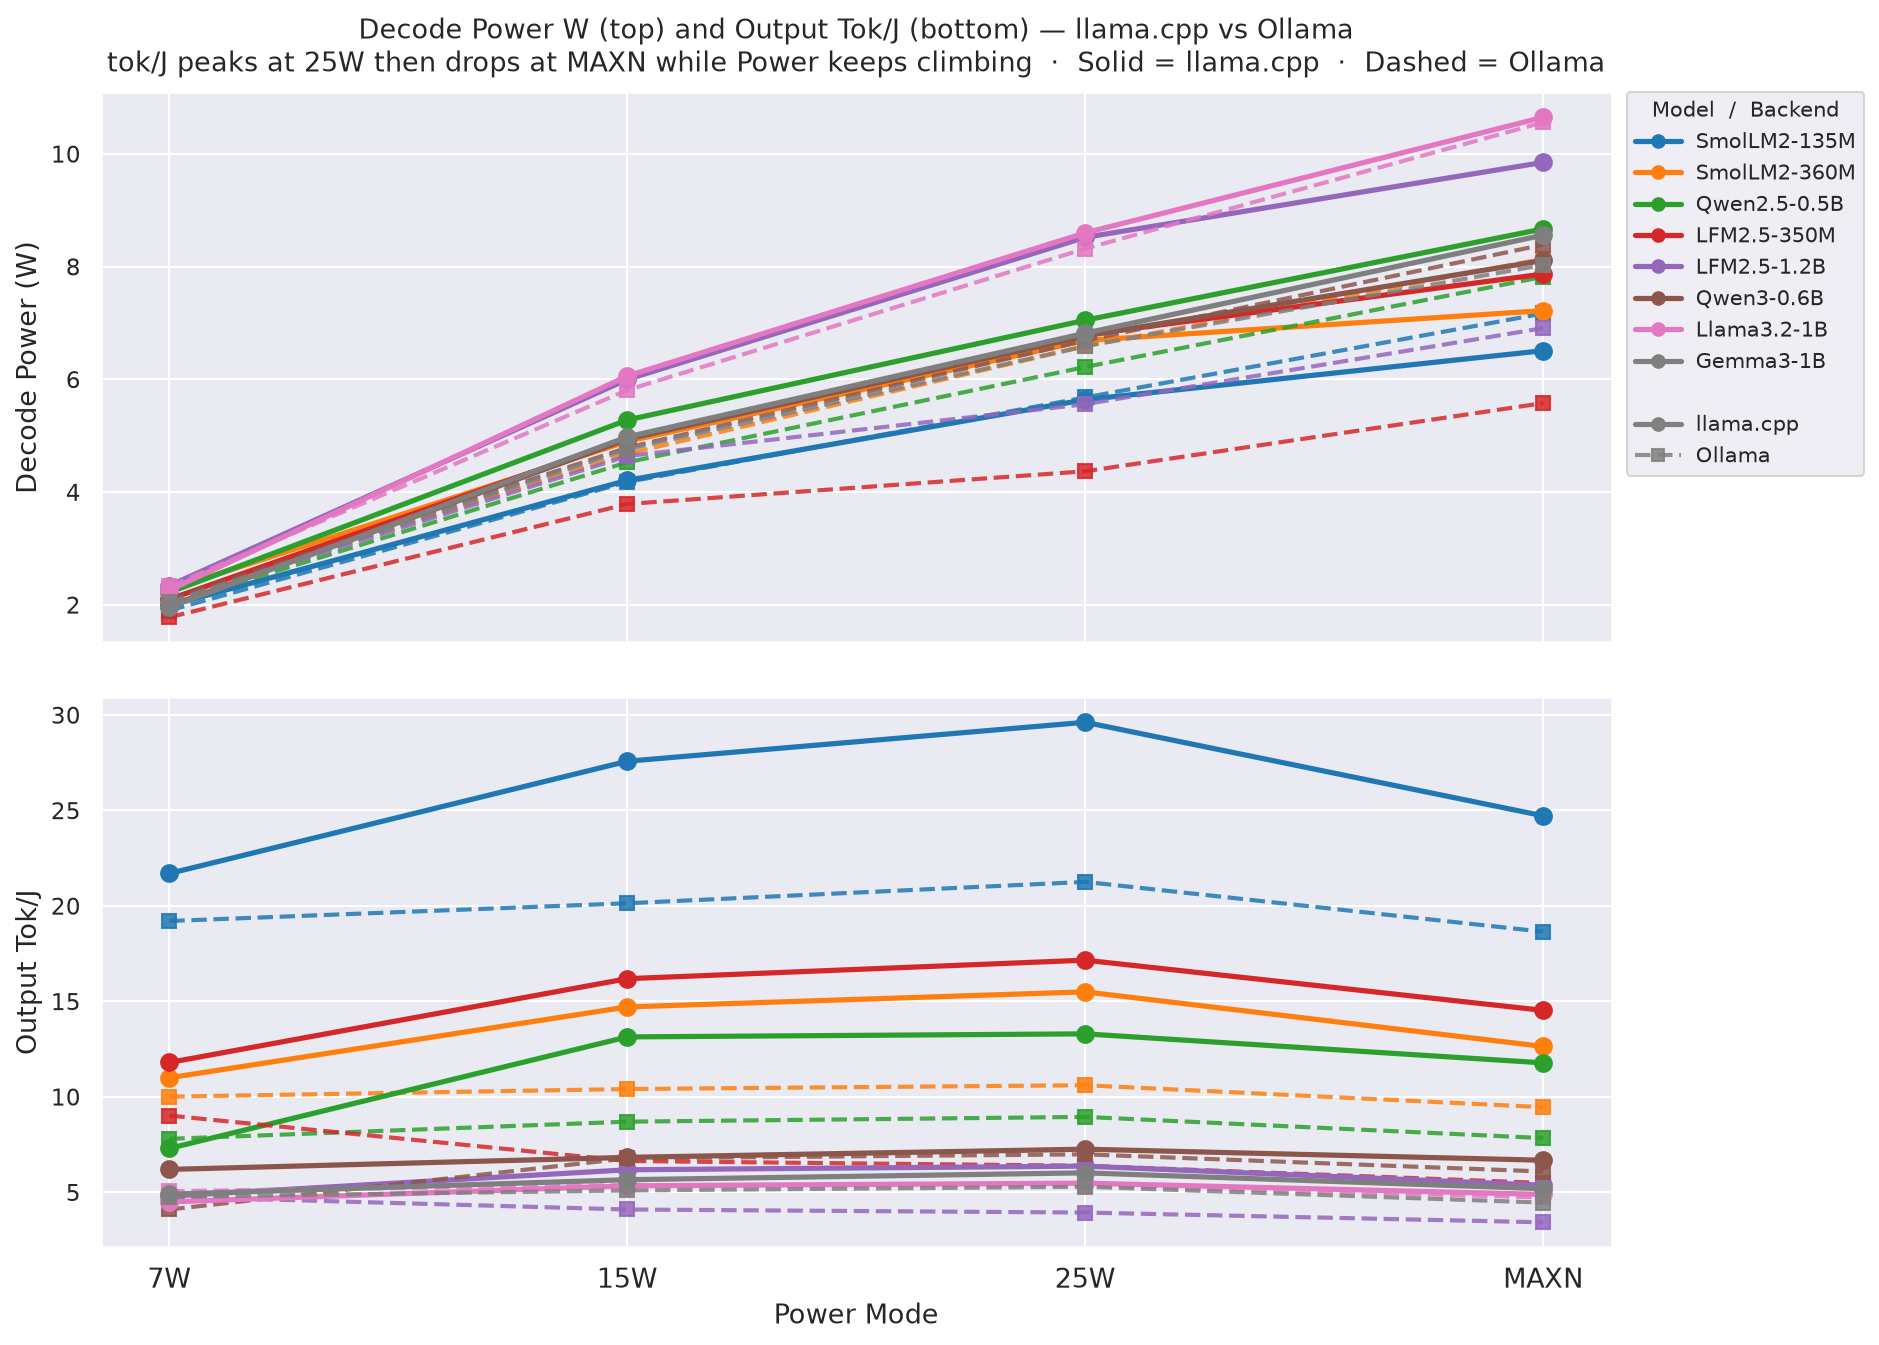
Figure A.3 - Decode Power W (top, bold) + Output Tok/J (bottom, faded)
Power keeps climbing 7W → MAXN. Tok/J peaks at 25W then drops at MAXN - the divergence at MAXN is the key story. llama.cpp 7W power is unavailable (no tegrastats); those lines start at 15W.
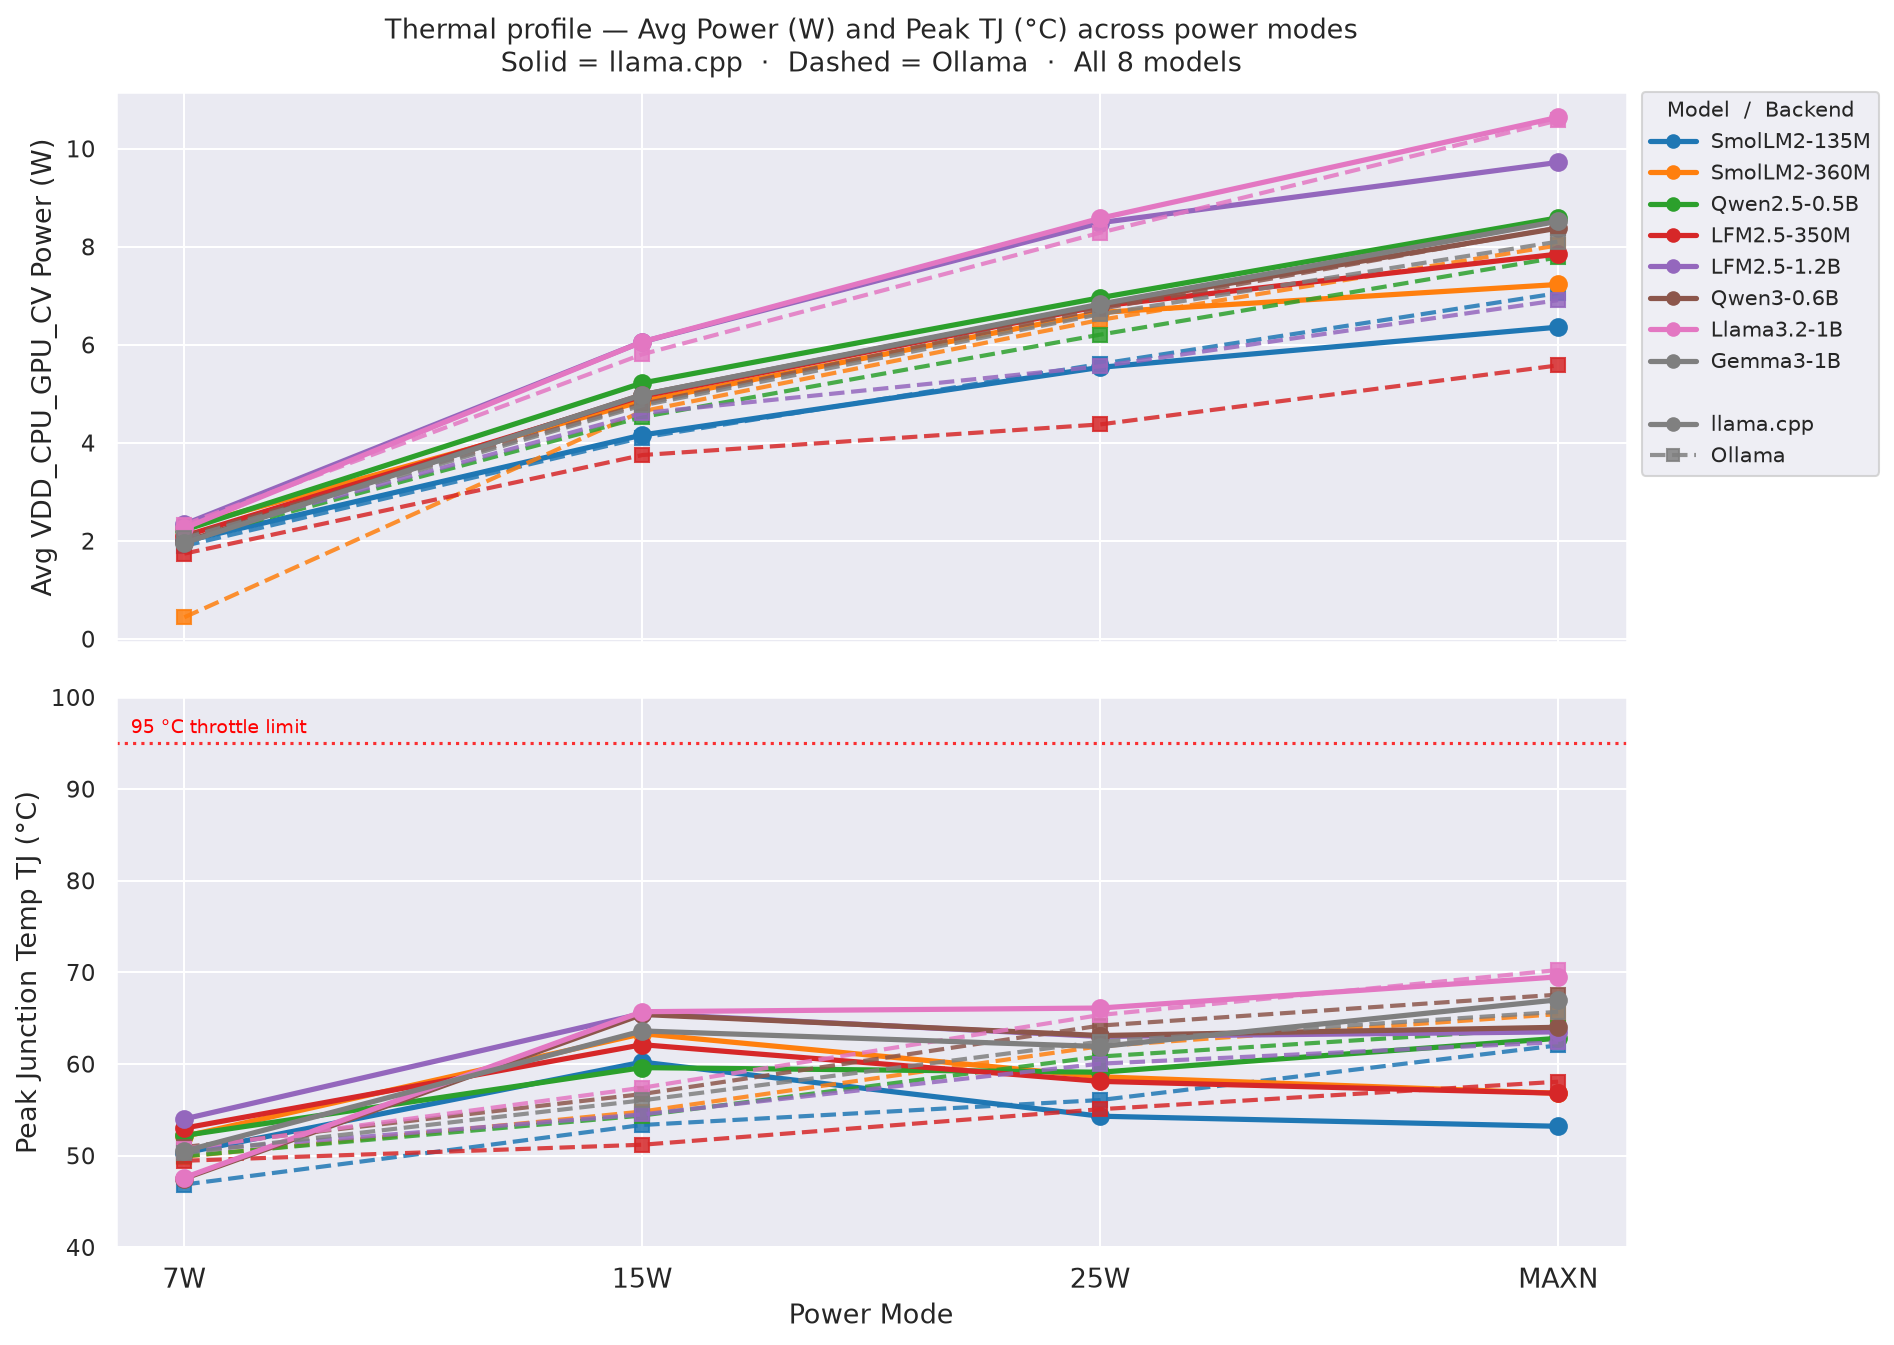
Power and temperature averaged over each model’s full benchmark window (all 12 prompt×gen combos). No model triggered thermal throttling at any power mode (threshold ≈ 95 °C).
Junction temperature (TJ) is the hottest internal die temperature on the Jetson SoC, reported by tegrastats as tj@. If TJ reaches ~95 °C, the hardware automatically throttles clocks to prevent damage. Peak TJ < 70 °C across all runs means thermal headroom is ample.
Colour = power mode. See Power Measurement Methodology Note for details.
Figure B.1 - Avg VDD_CPU_GPU_CV Power (top) and Peak TJ (bottom) across power modes
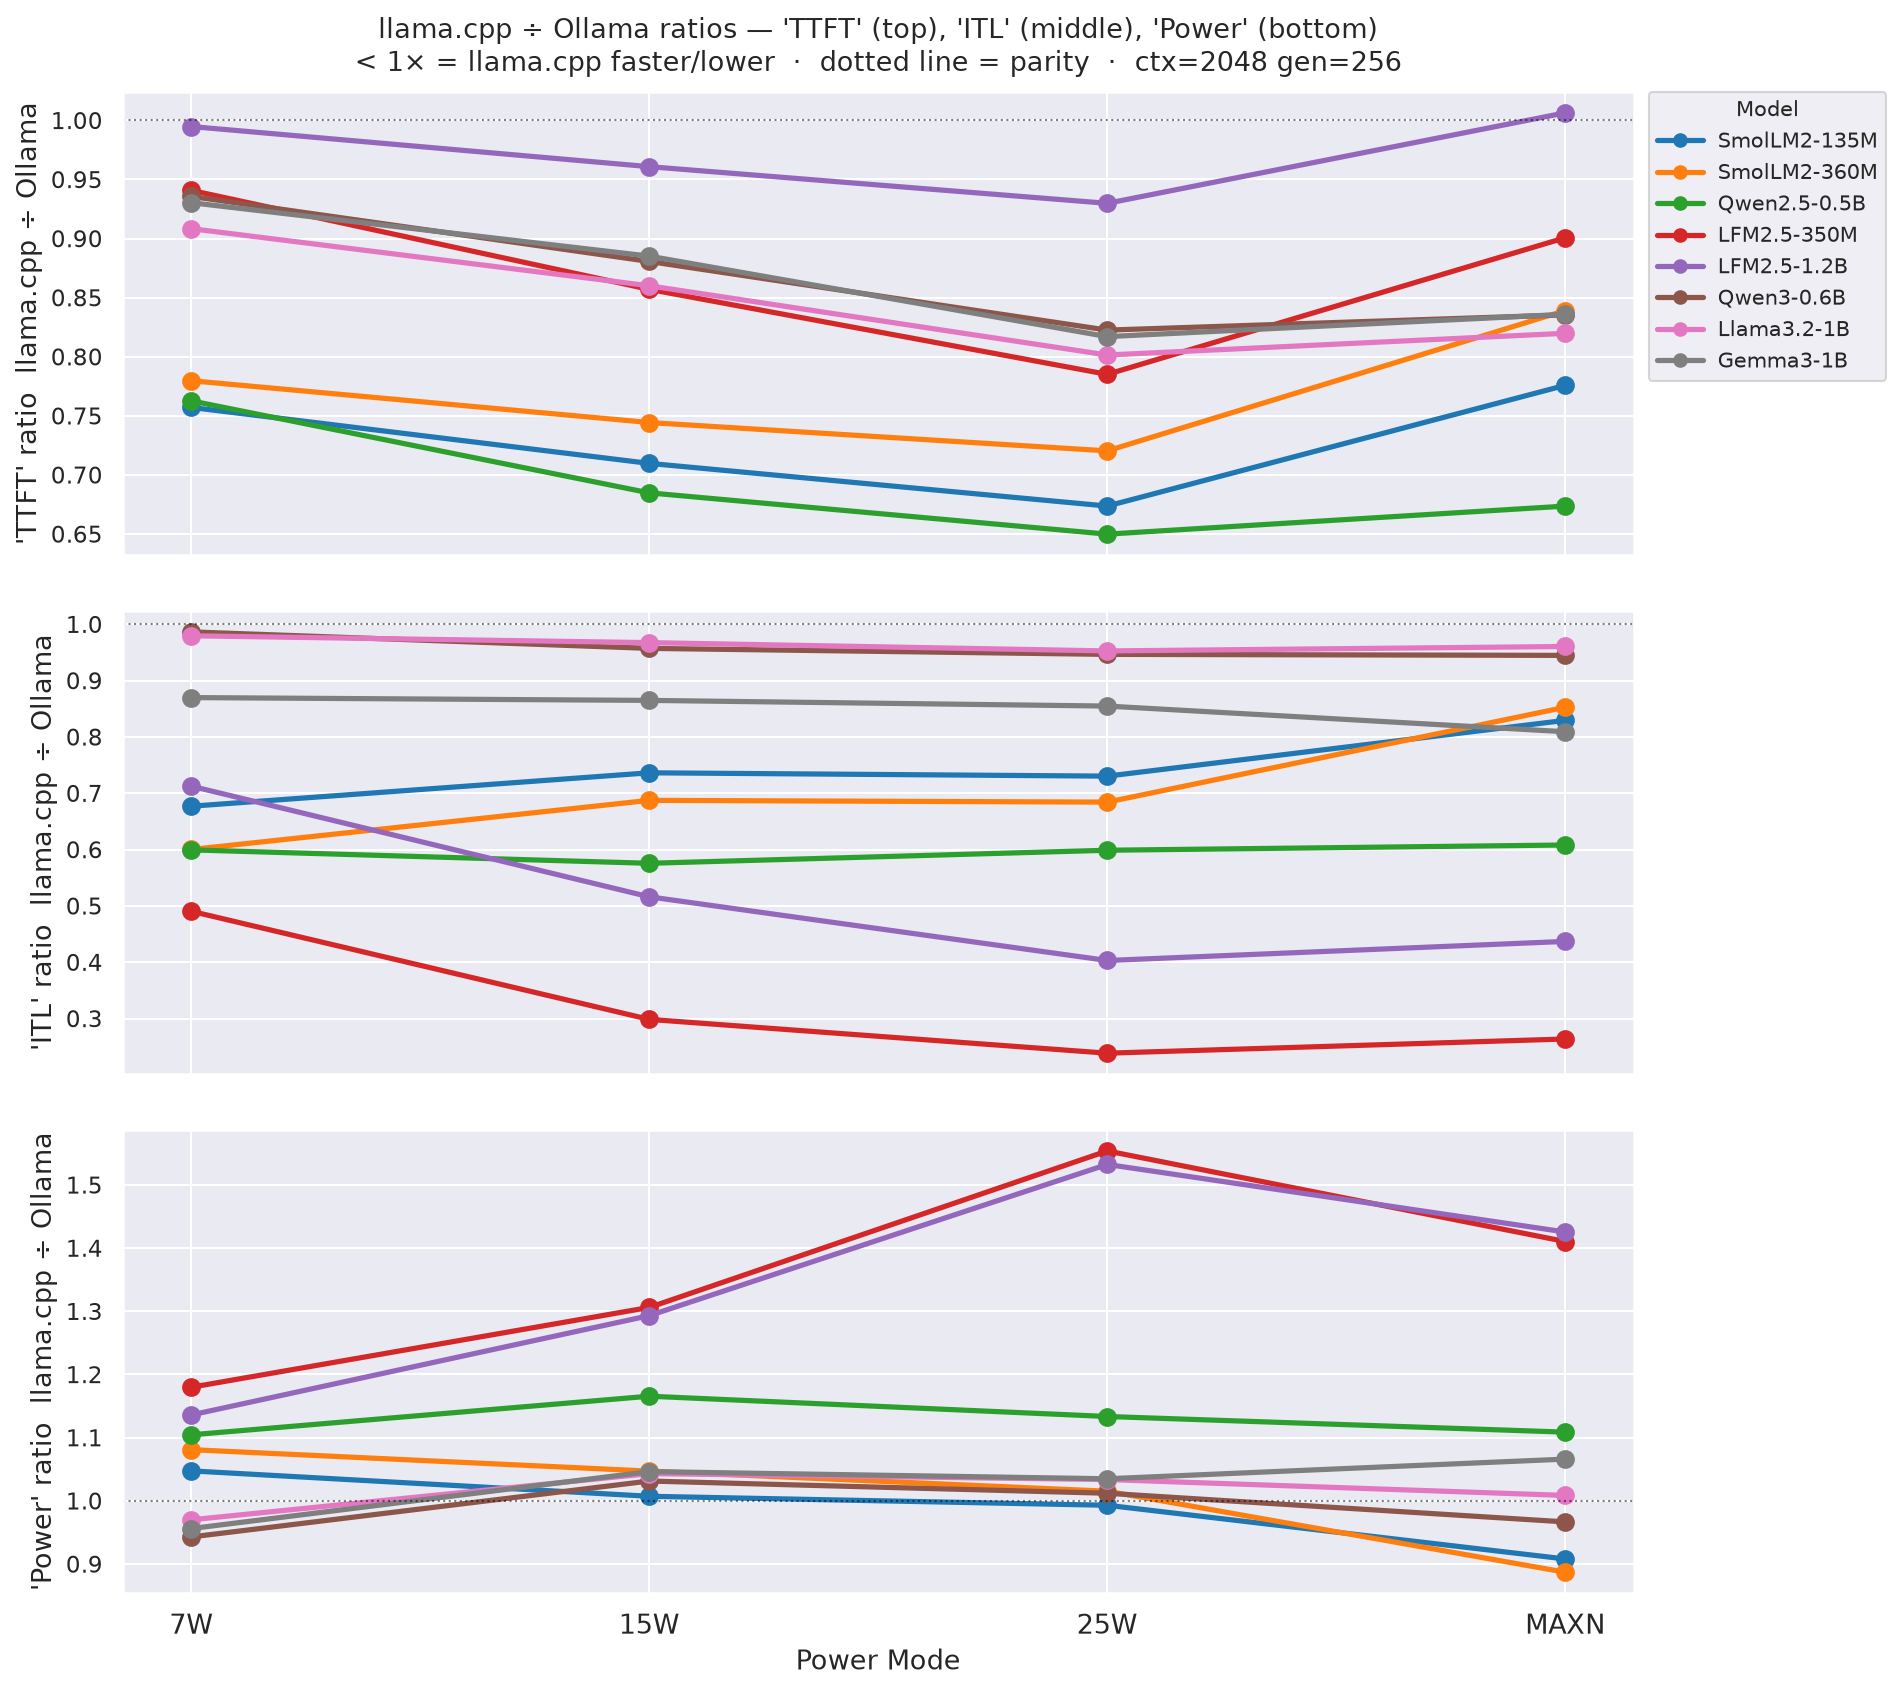
All ratios are llama.cpp ÷ Ollama at the canonical cell (ctx=2048, gen=256). Values > 1× mean llama.cpp is faster / more efficient; < 1× means Ollama leads.
Figure C.0 - Tok/s ratio llama.cpp ÷ Ollama (top, bold) + Tok/J ratio llama.cpp ÷ Ollama (bottom, faded) across all models
8 lines per metric, one per model; x-axis = power mode. Ratio = llama.cpp ÷ Ollama: values > 1× mean llama.cpp leads, < 1× means Ollama leads. Dotted horizontal = 1× parity. LFM2.5-350M is the clear outlier - llama.cpp is 3-4× faster and 2.5× more efficient at that model.
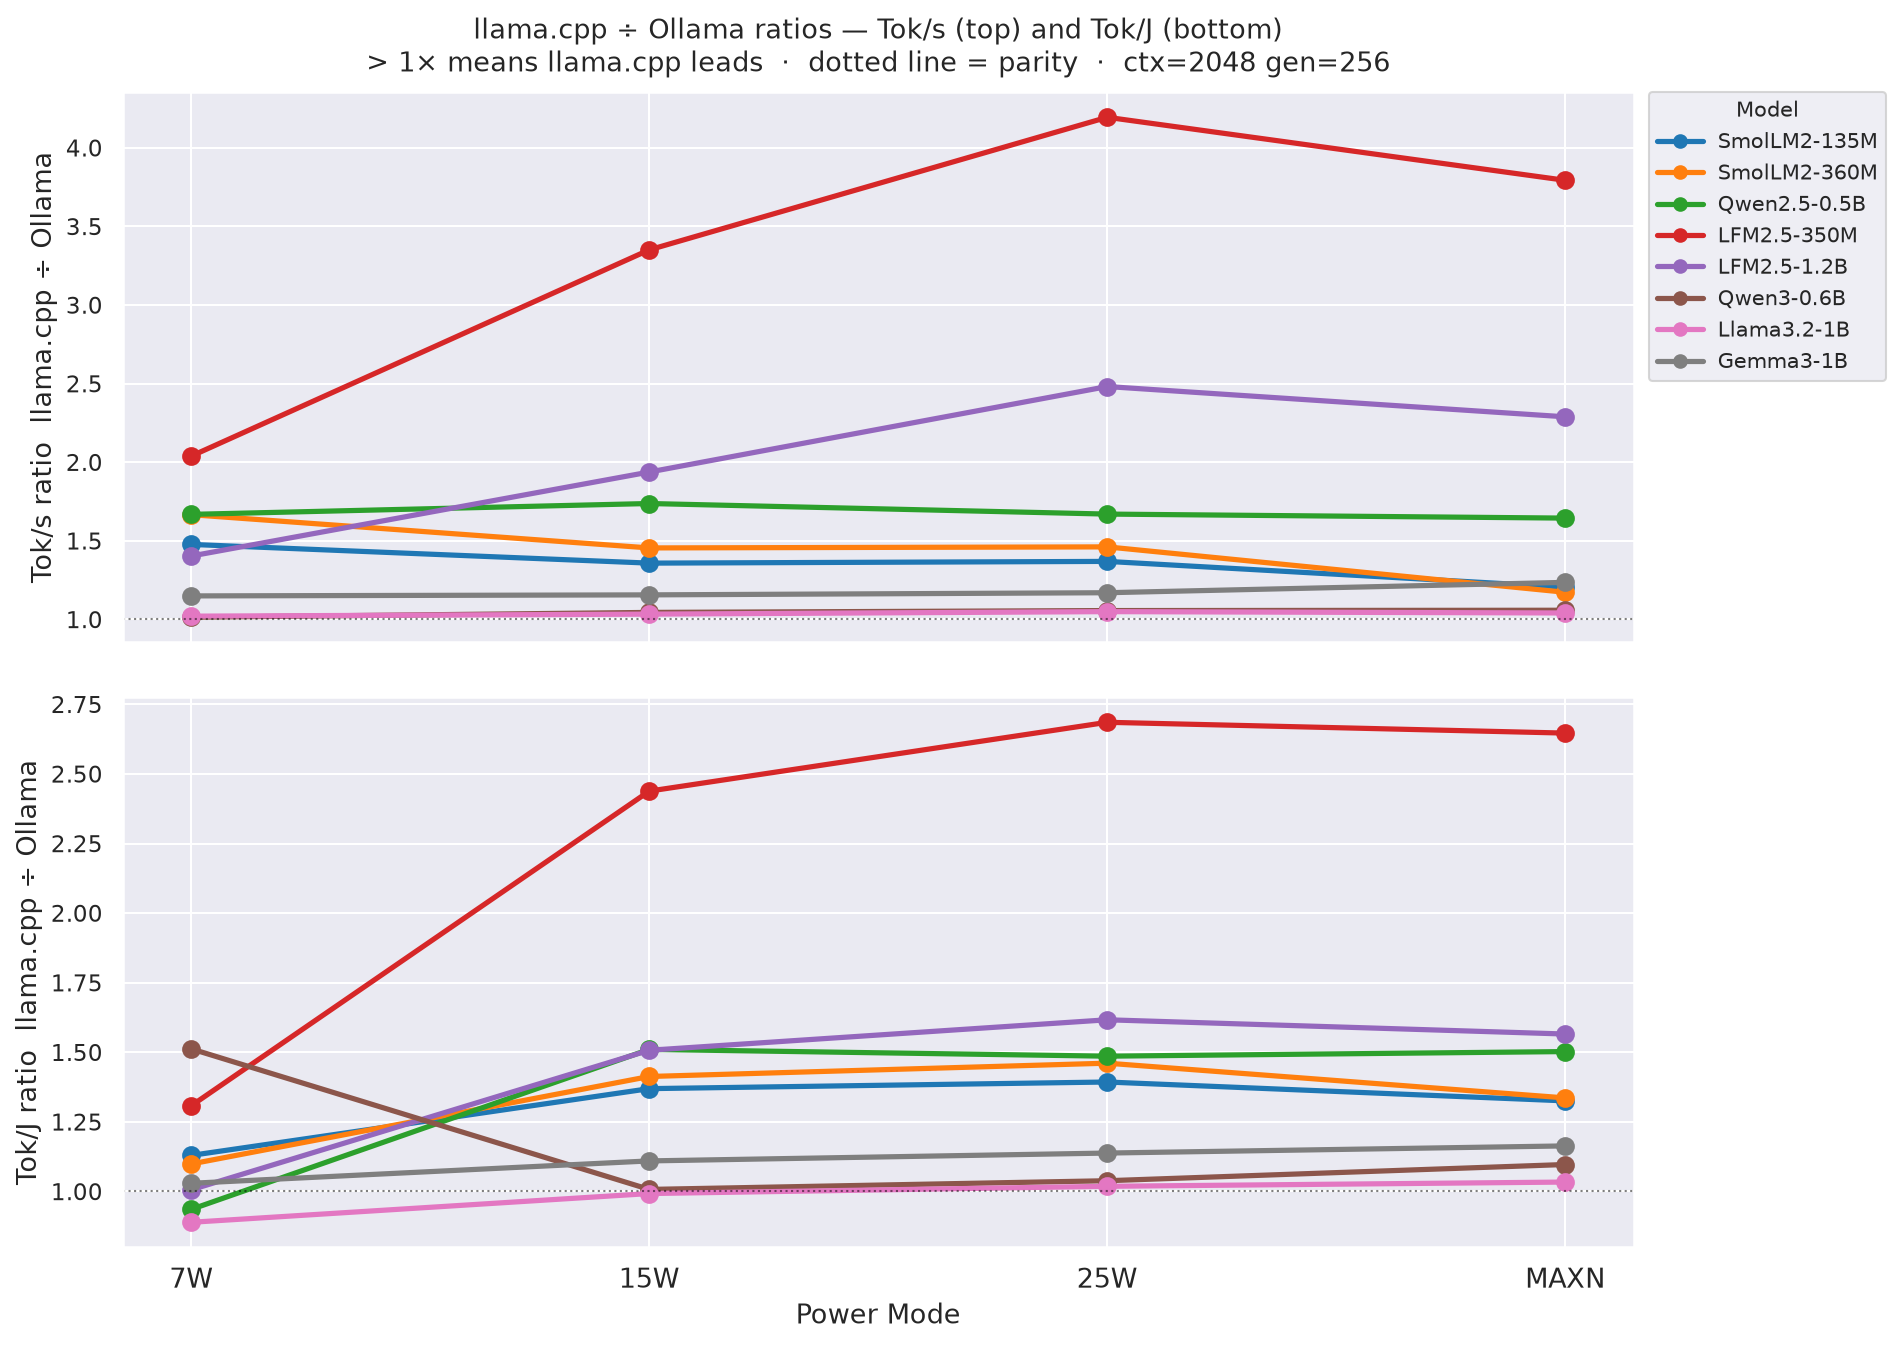
Figure C.1 - Prefill throughput (tok/s) ratio llama.cpp ÷ Ollama across all modes
Prefill throughput (input tok/s processed during the prompt-evaluation phase) - see definition at prefill_tput in Appendix I.1. Per-backend absolute values for each model and power mode are charted in Appendix H (all combinations). Ratio = llama.cpp prefill_tput ÷ Ollama prefill_tput per cell.
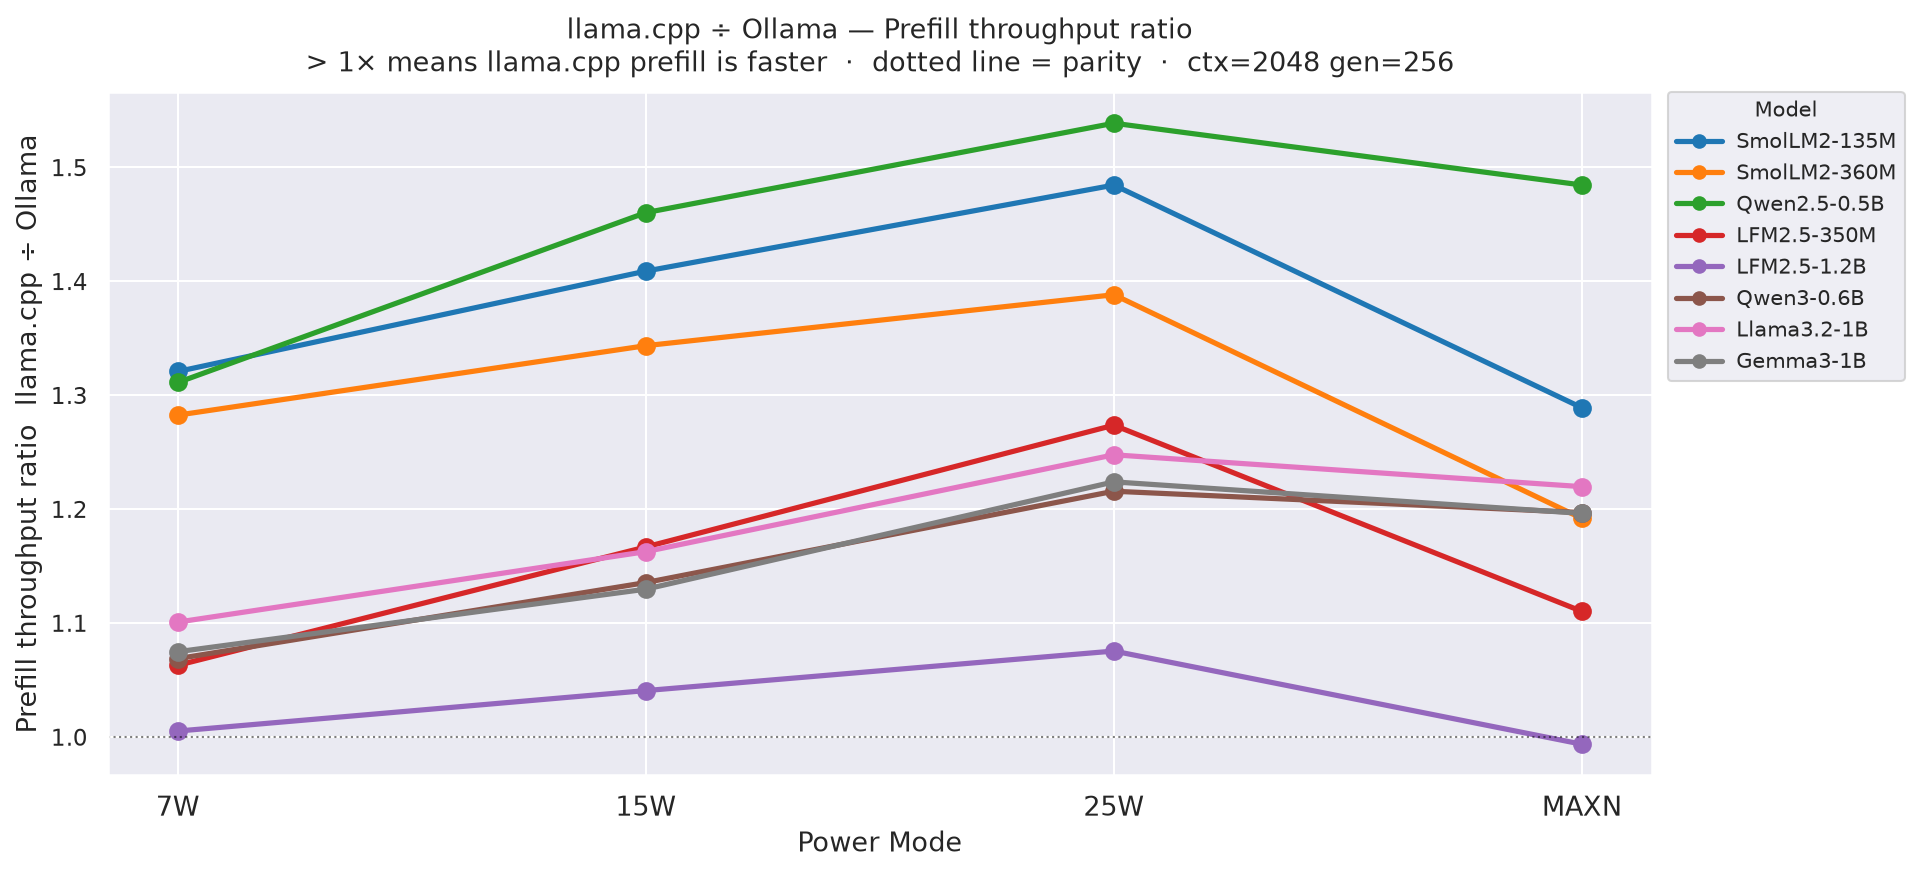
Figure C.2 - TTFT (top) + ITL (middle) + Power (bottom) ratios llama.cpp ÷ Ollama across all models
8 lines per metric, one per model; x-axis = power mode. Ratios = llama.cpp ÷ Ollama. For TTFT and ITL: < 1× means llama.cpp is faster (lower latency). For Power: > 1× means llama.cpp draws more power. Dotted horizontal = 1× parity. ctx=2048 gen=256.
tok/J: All CombinationsAll charts show all models as colored lines across power modes (ctx=2048). Solid = llama.cpp, dashed = Ollama.
tok/J (input tok / J) across power modes⚠ Prefill tok/J is approximate when
TTFT< 500 ms: 63 % of llama.cpp cells, 48 % of Ollama cells.
Figure D.1a: Prefill tok/J across power modes - gen=64
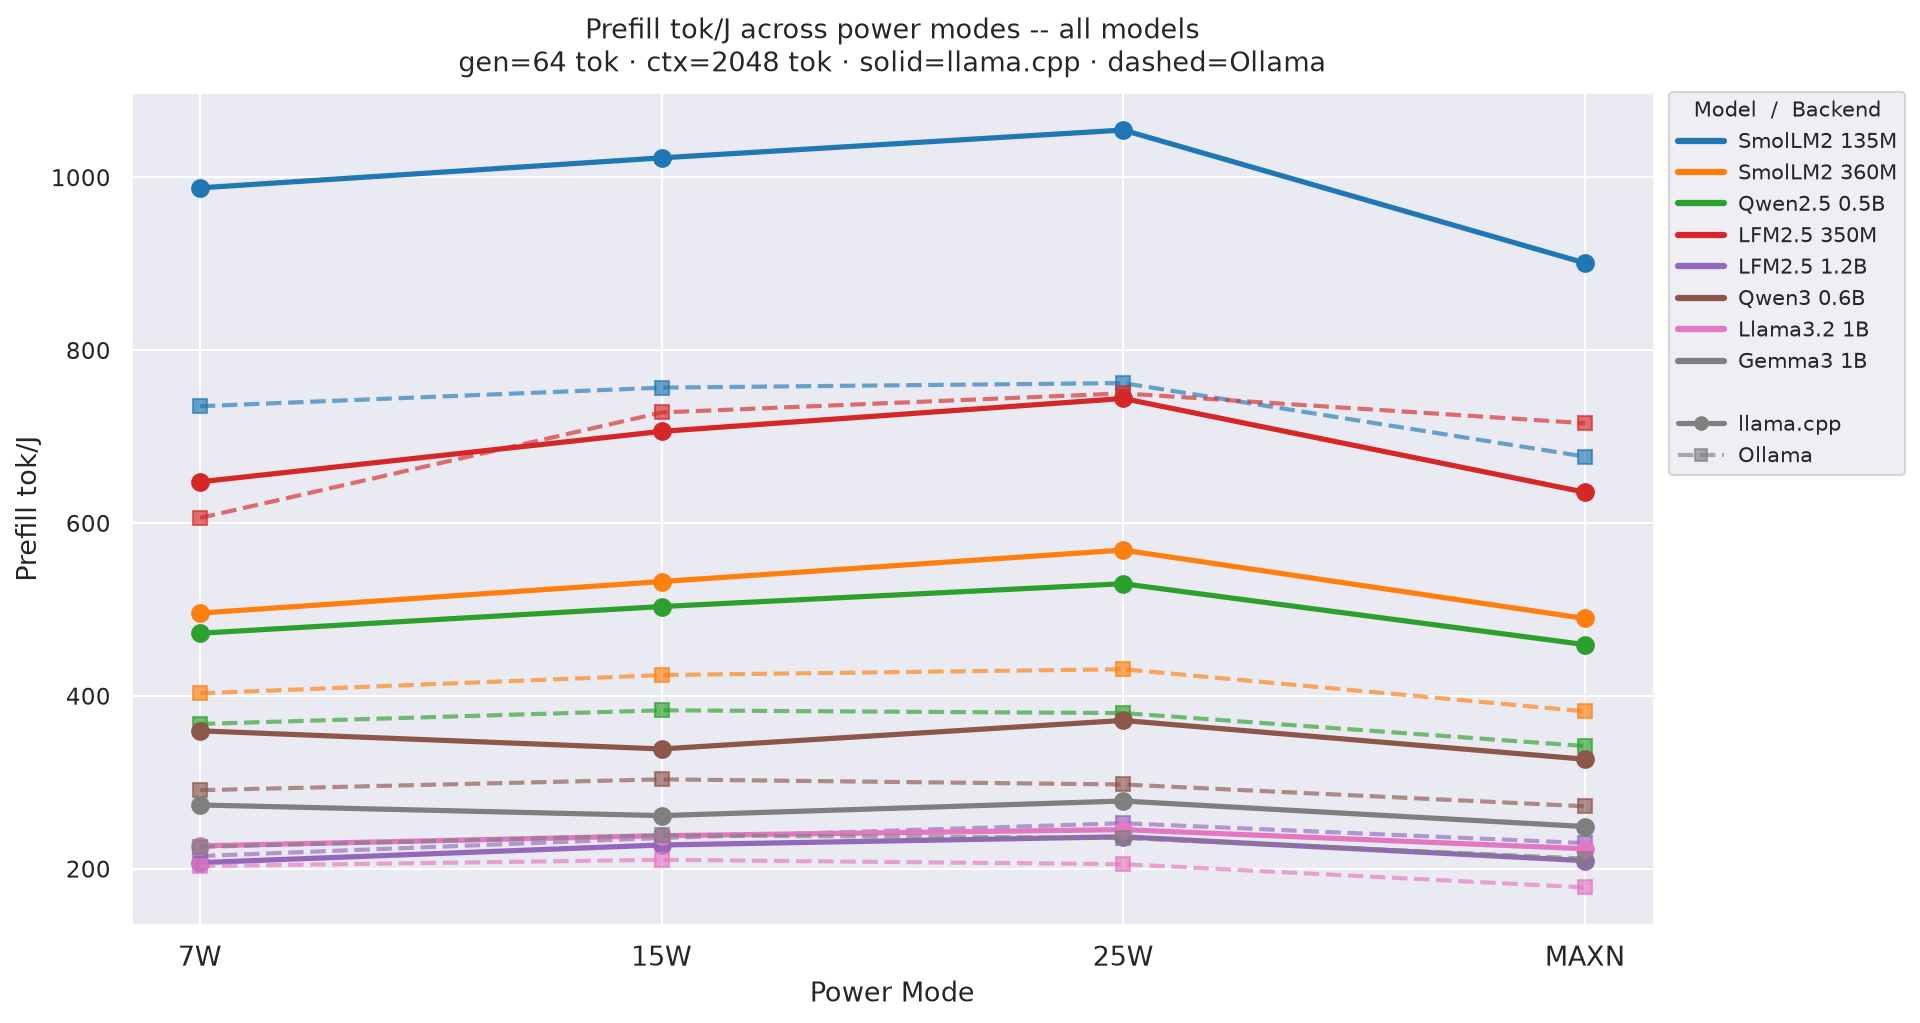
Figure D.1b: Prefill tok/J across power modes - gen=128
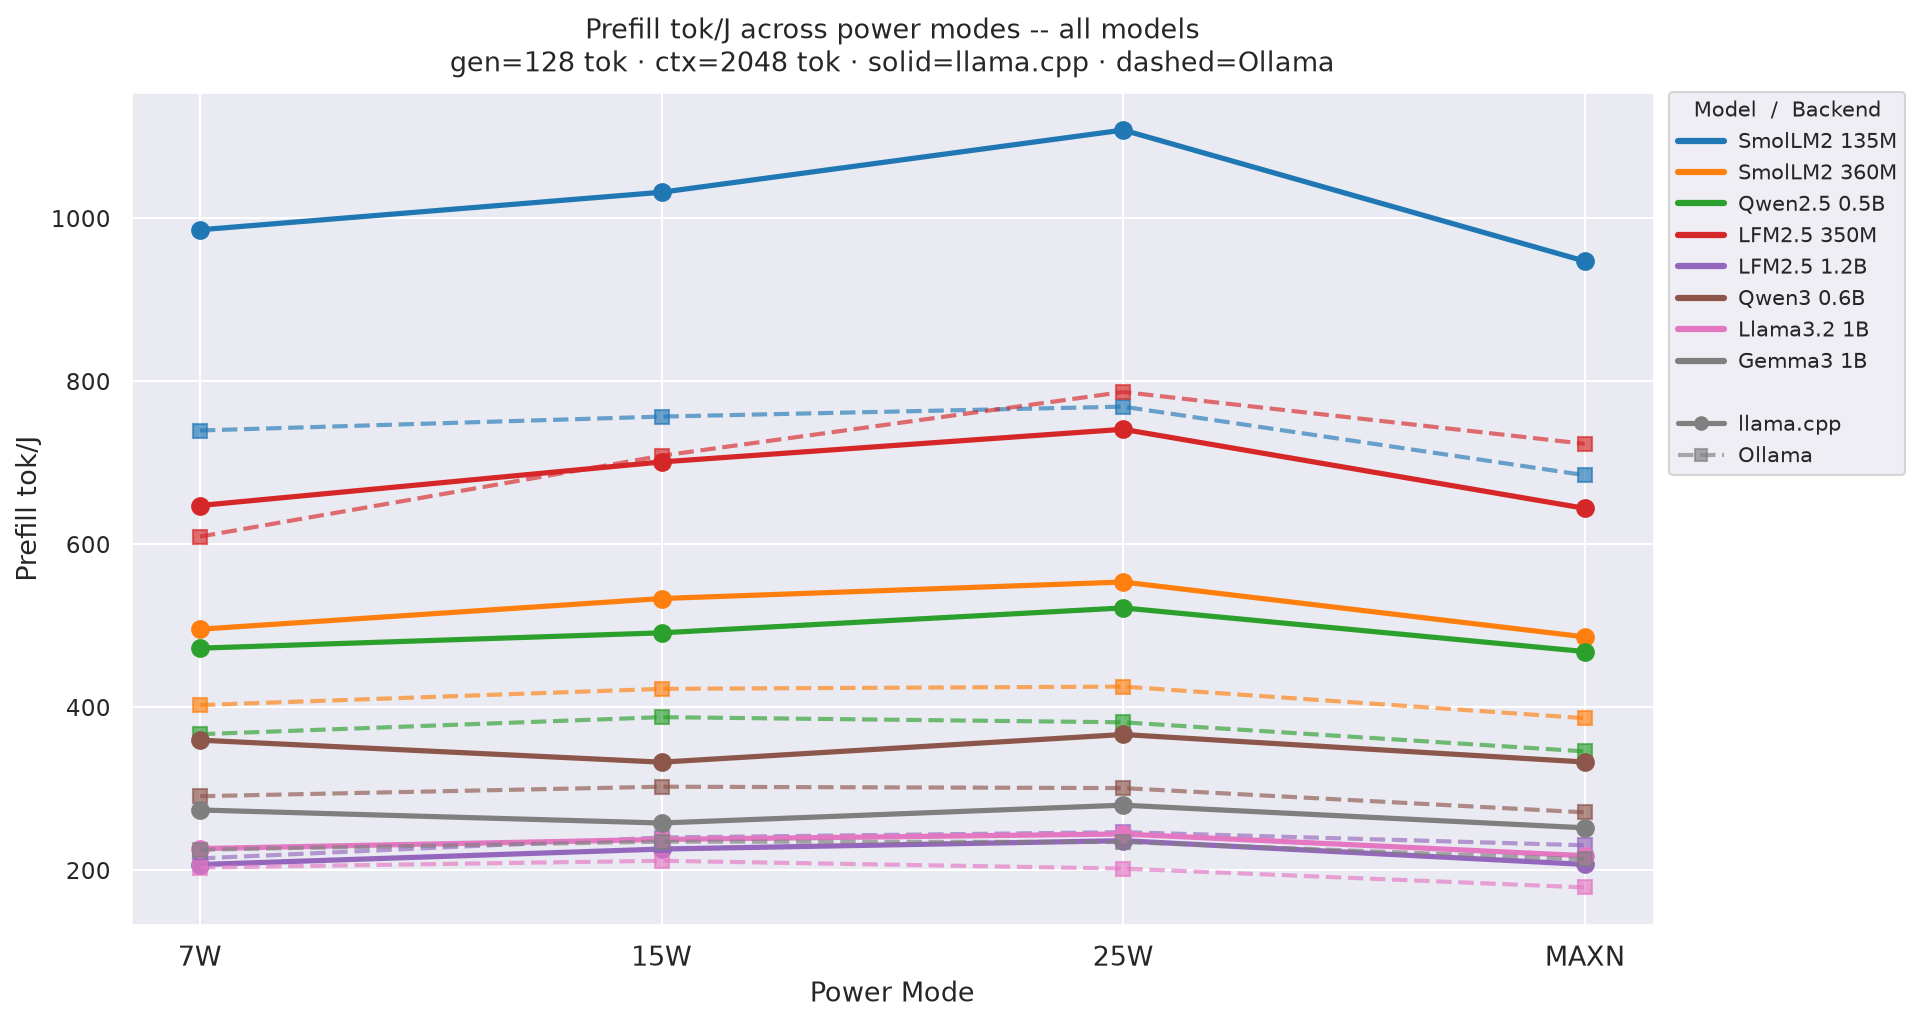
Figure D.1c: Prefill tok/J across power modes - gen=256
tok/J (output tok / J) across power modesFigure D.2a: Decode tok/J across power modes - gen=64
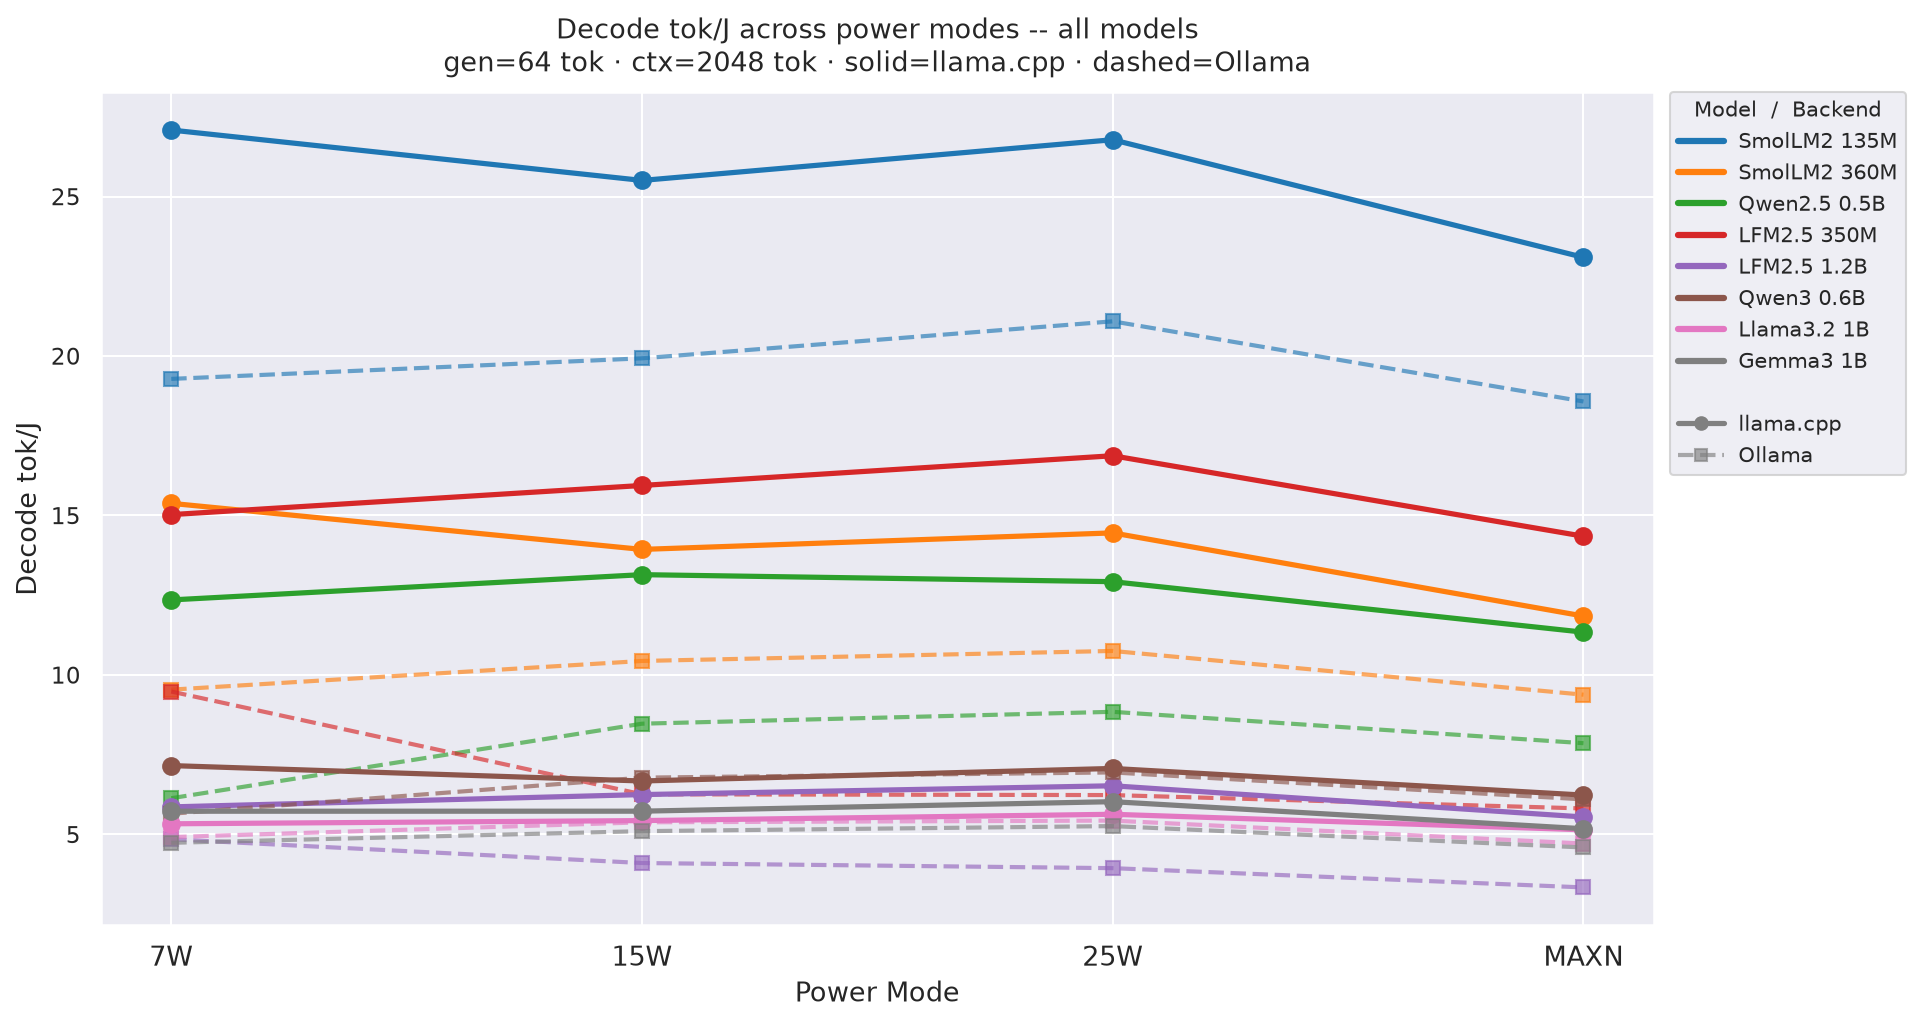
Figure D.2b: Decode tok/J across power modes - gen=128
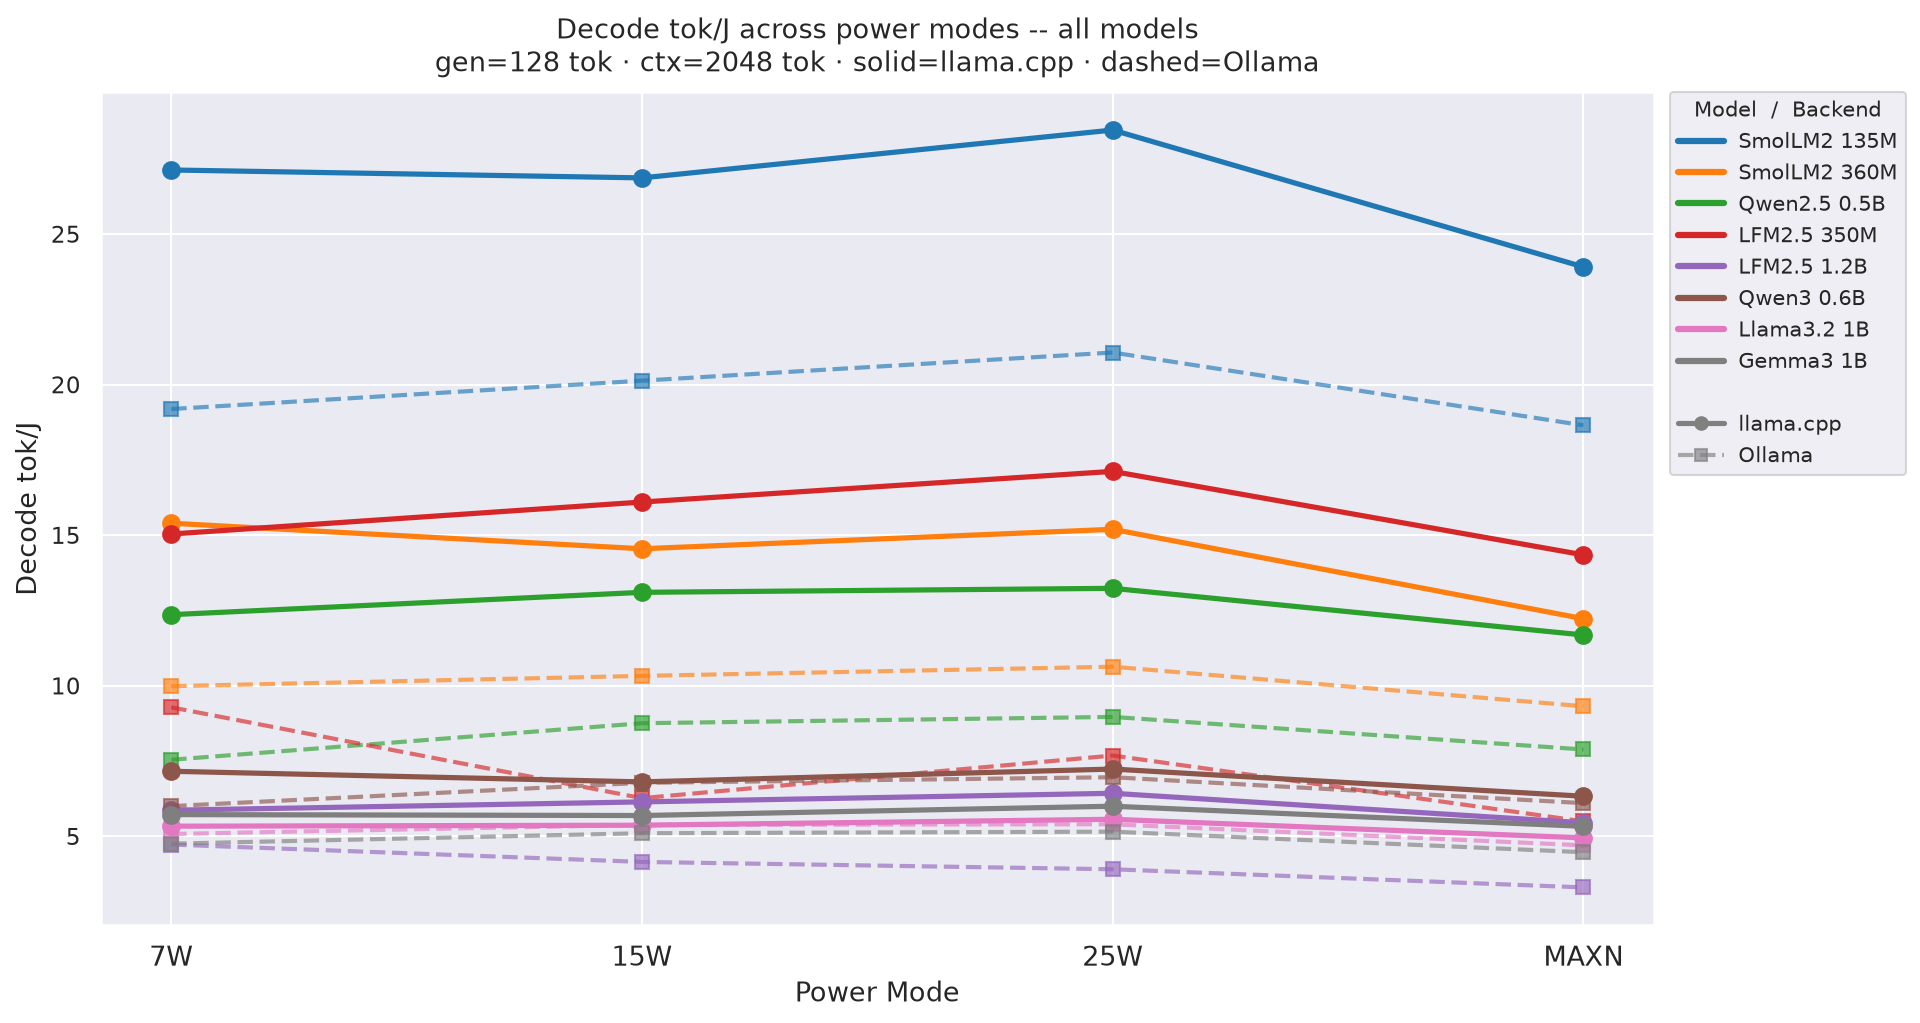
Figure D.2c: Decode tok/J across power modes - gen=256
tok/J ((input+output) tok / J) across power modesFigure D.3a: Total tok/J across power modes - gen=64
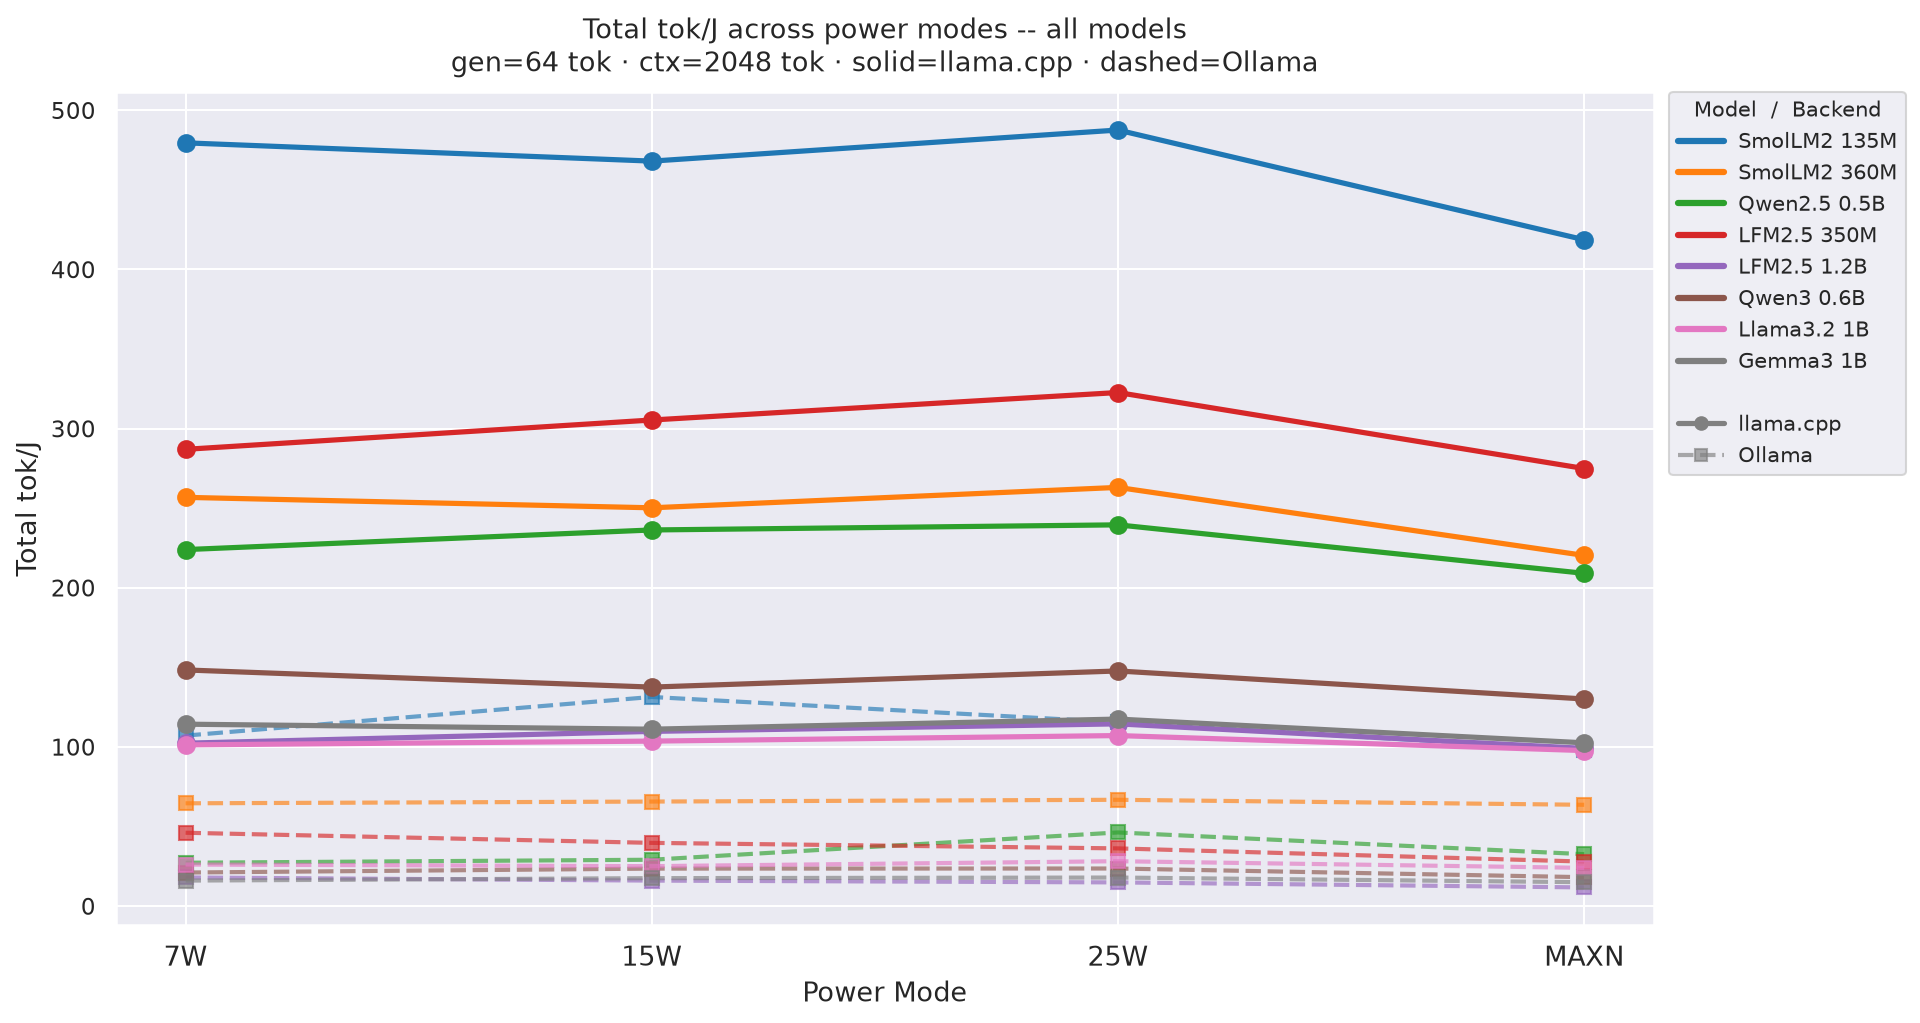
Figure D.3b: Total tok/J across power modes - gen=128
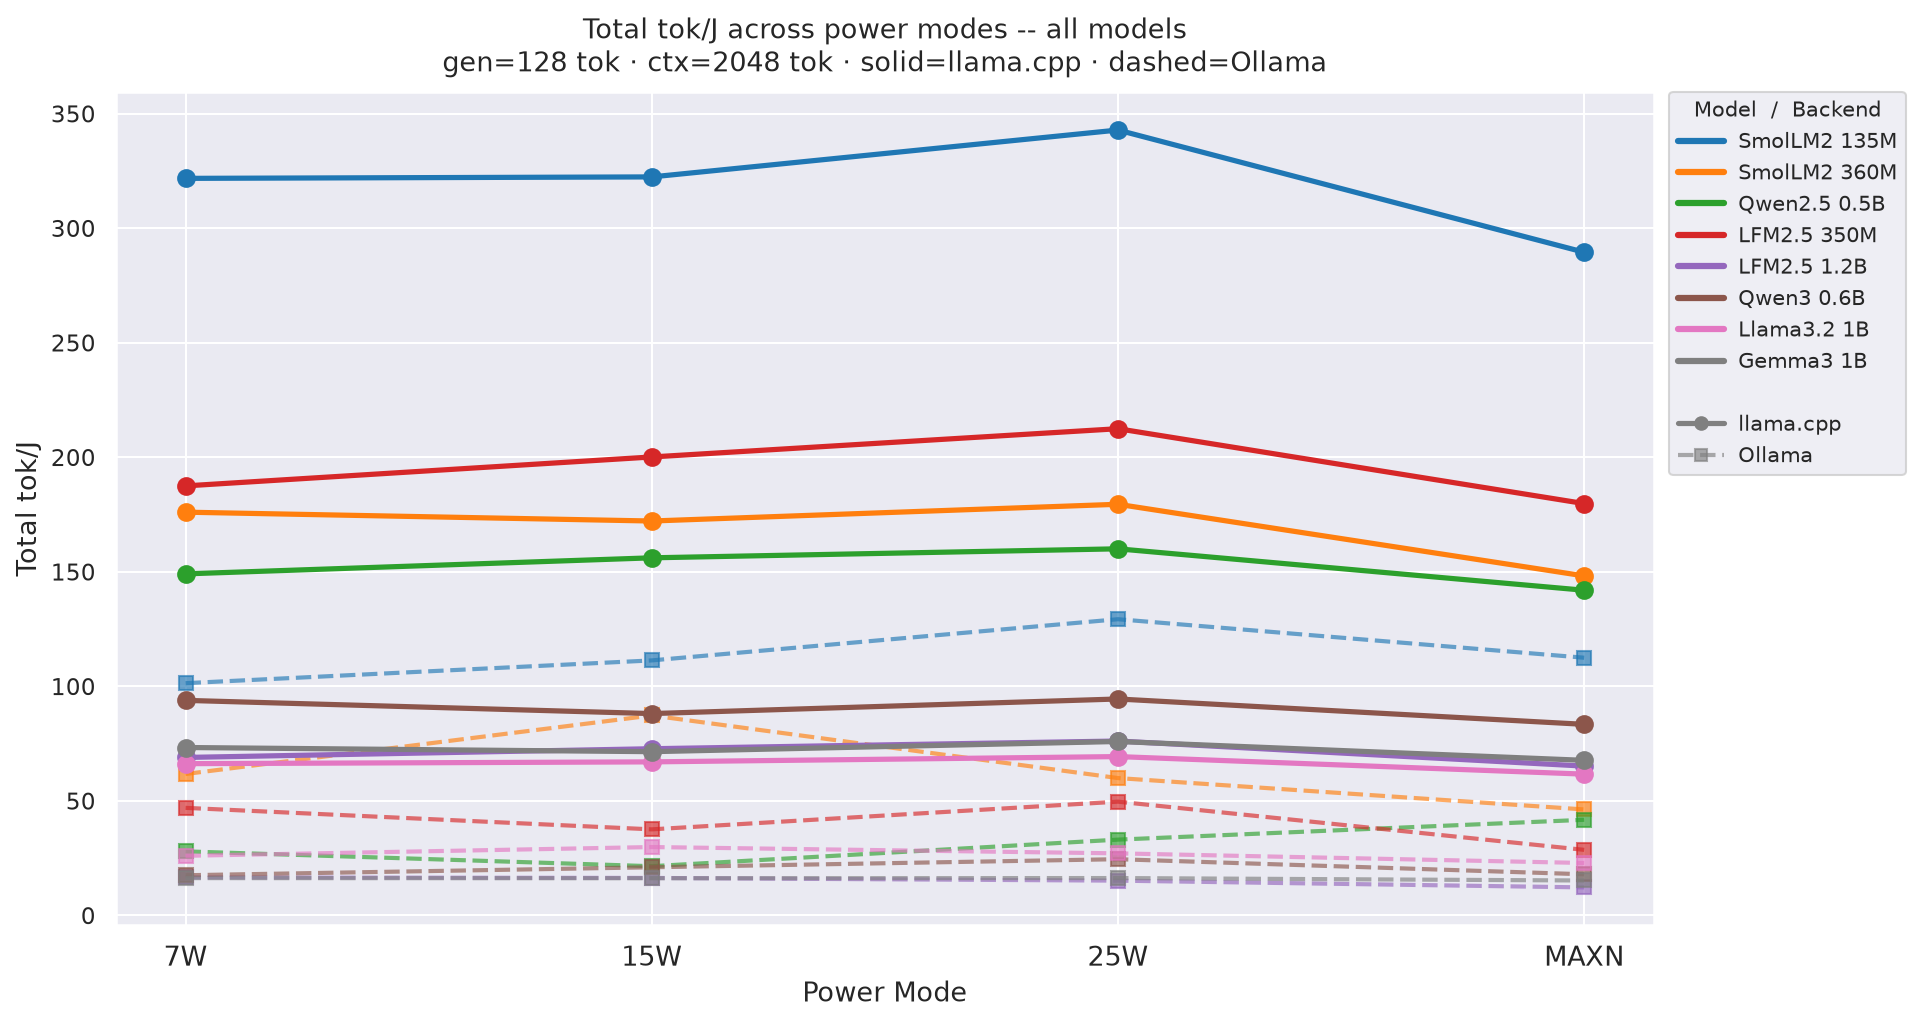
Figure D.3c: Total tok/J across power modes - gen=256
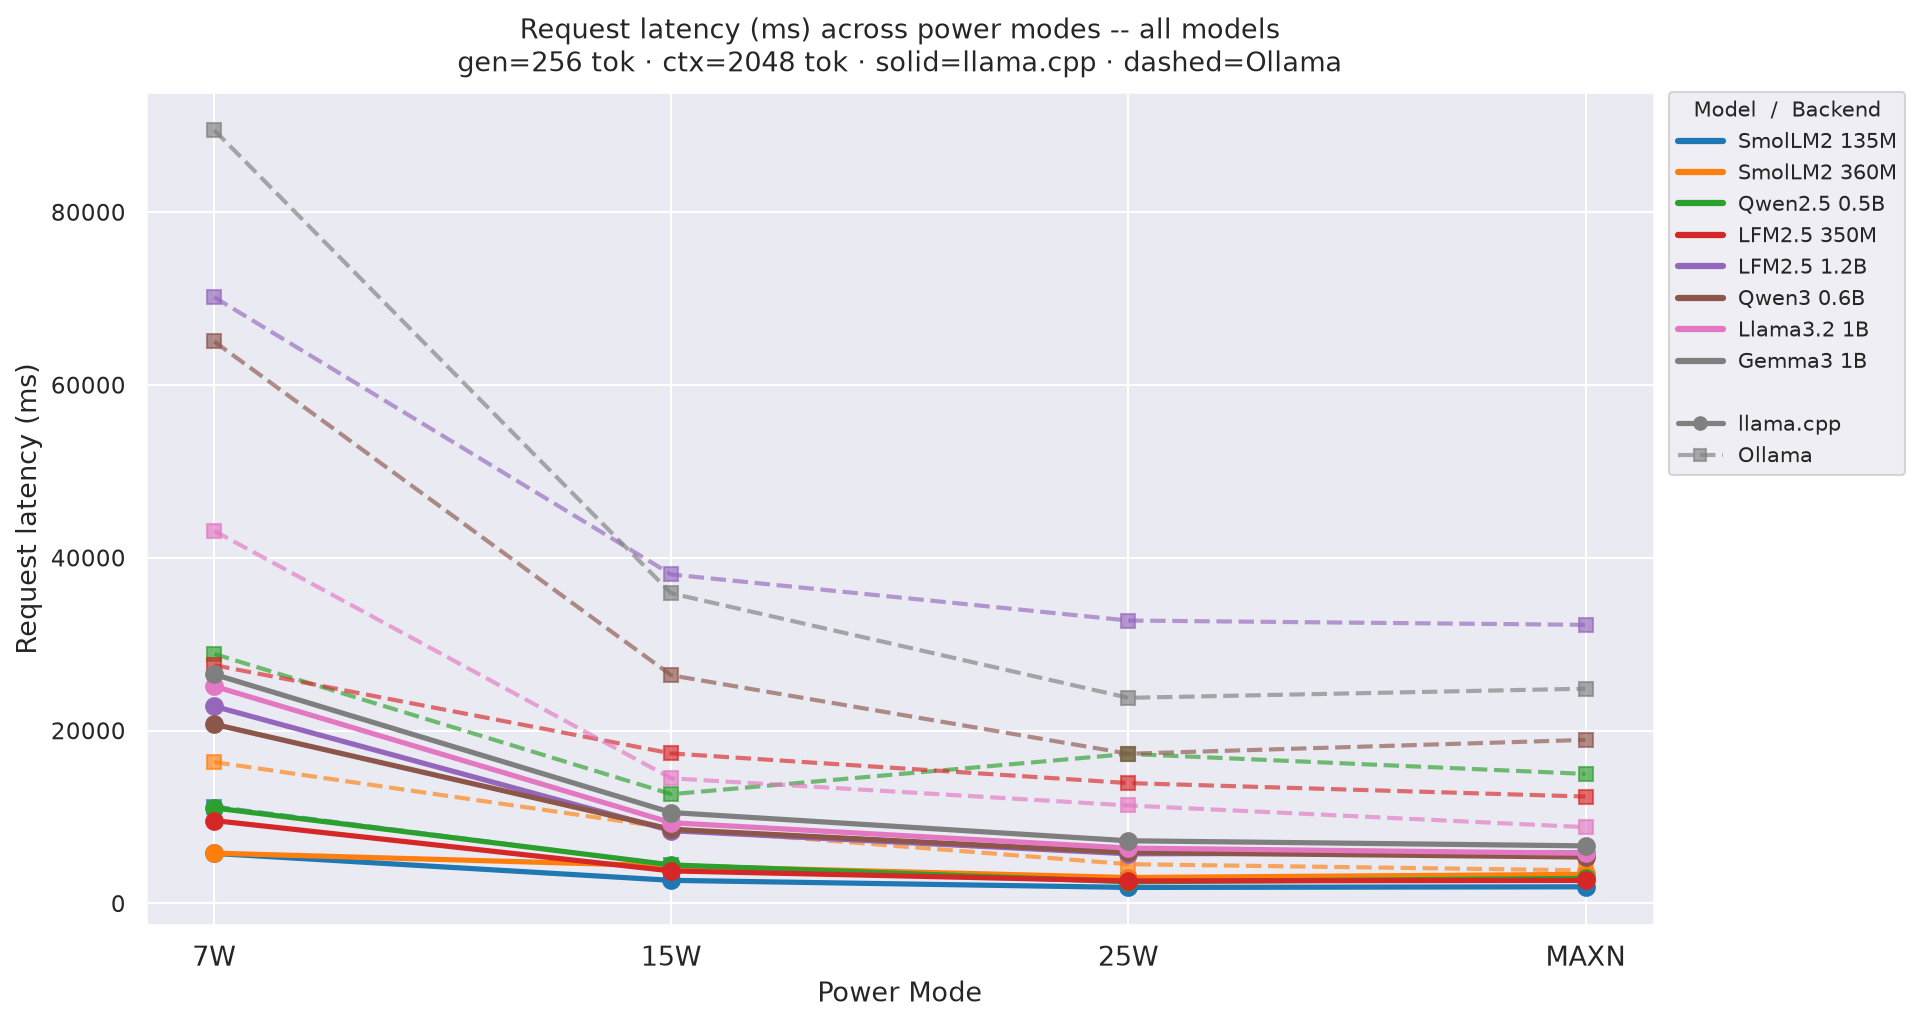
Request latency (E2E) p50 - total time from request start to last token received. Charts show variation across power modes with one line per model (solid = llama.cpp, dashed = Ollama).
Figure E.1a: Request latency across power modes - gen=64
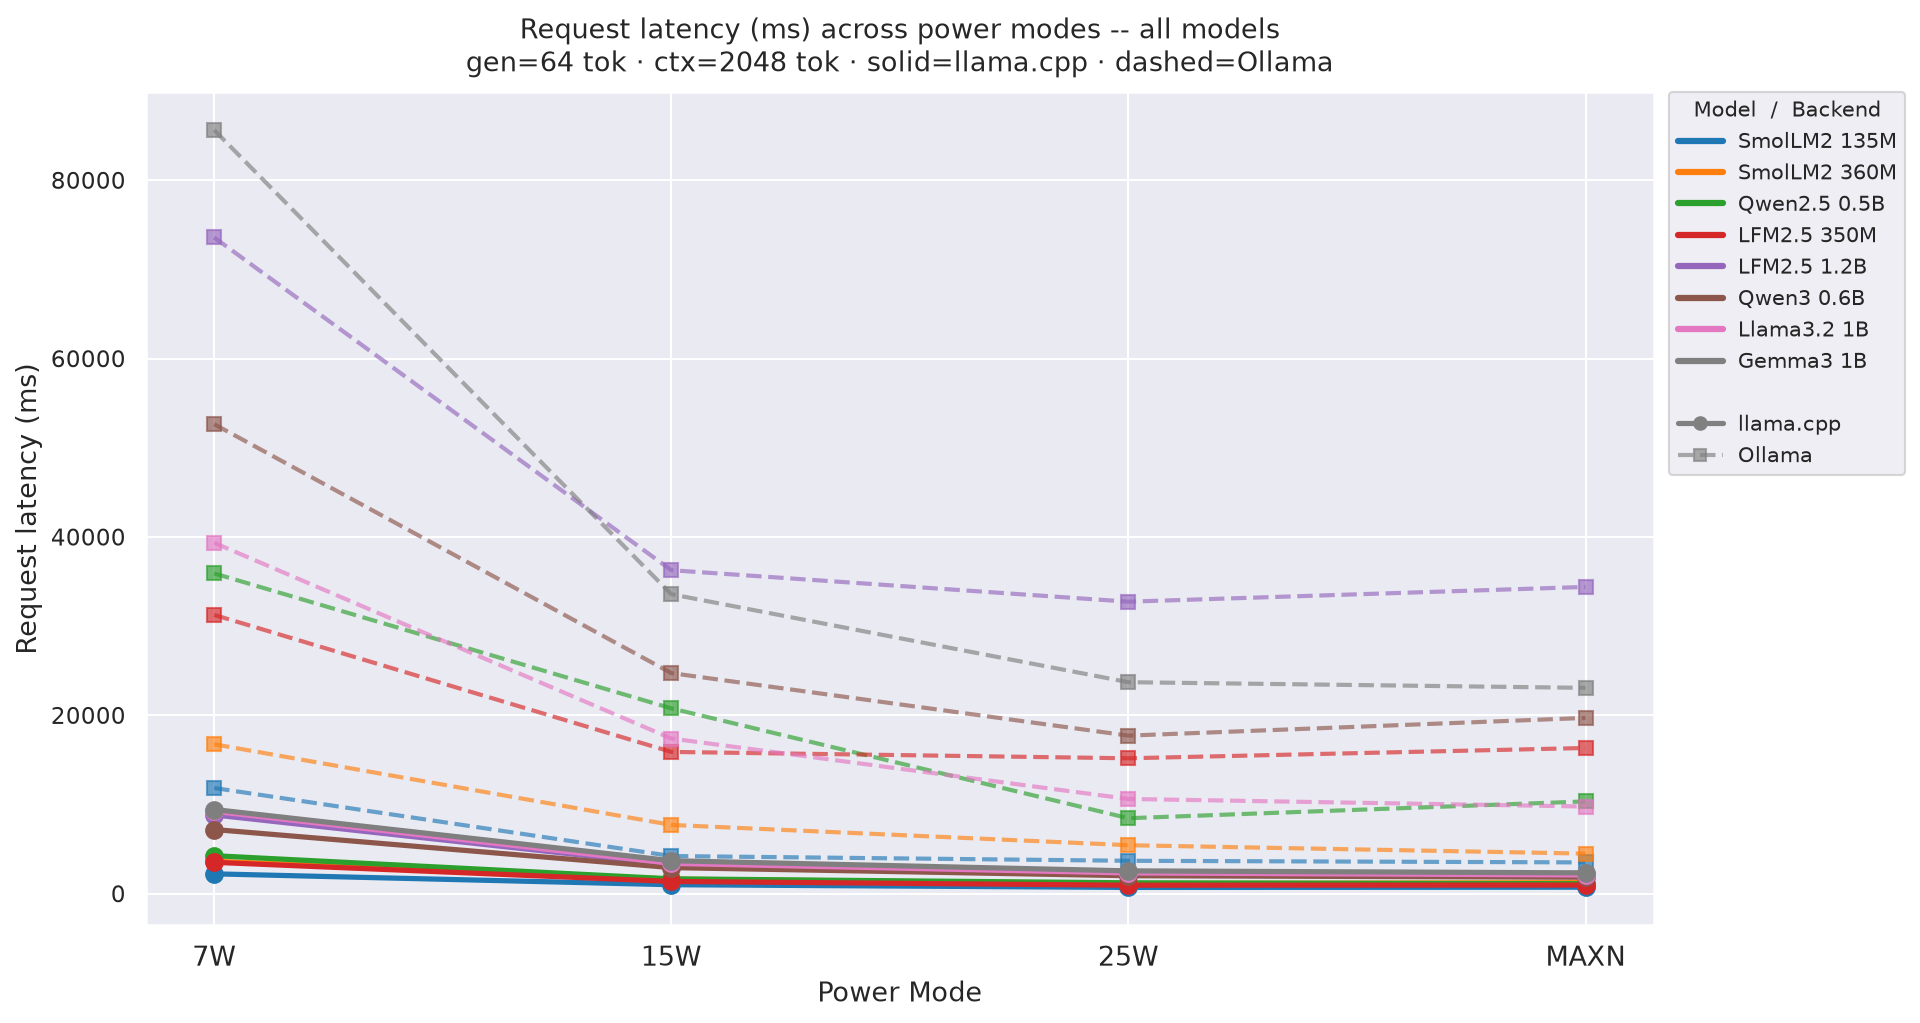
Figure E.1b: Request latency across power modes - gen=128
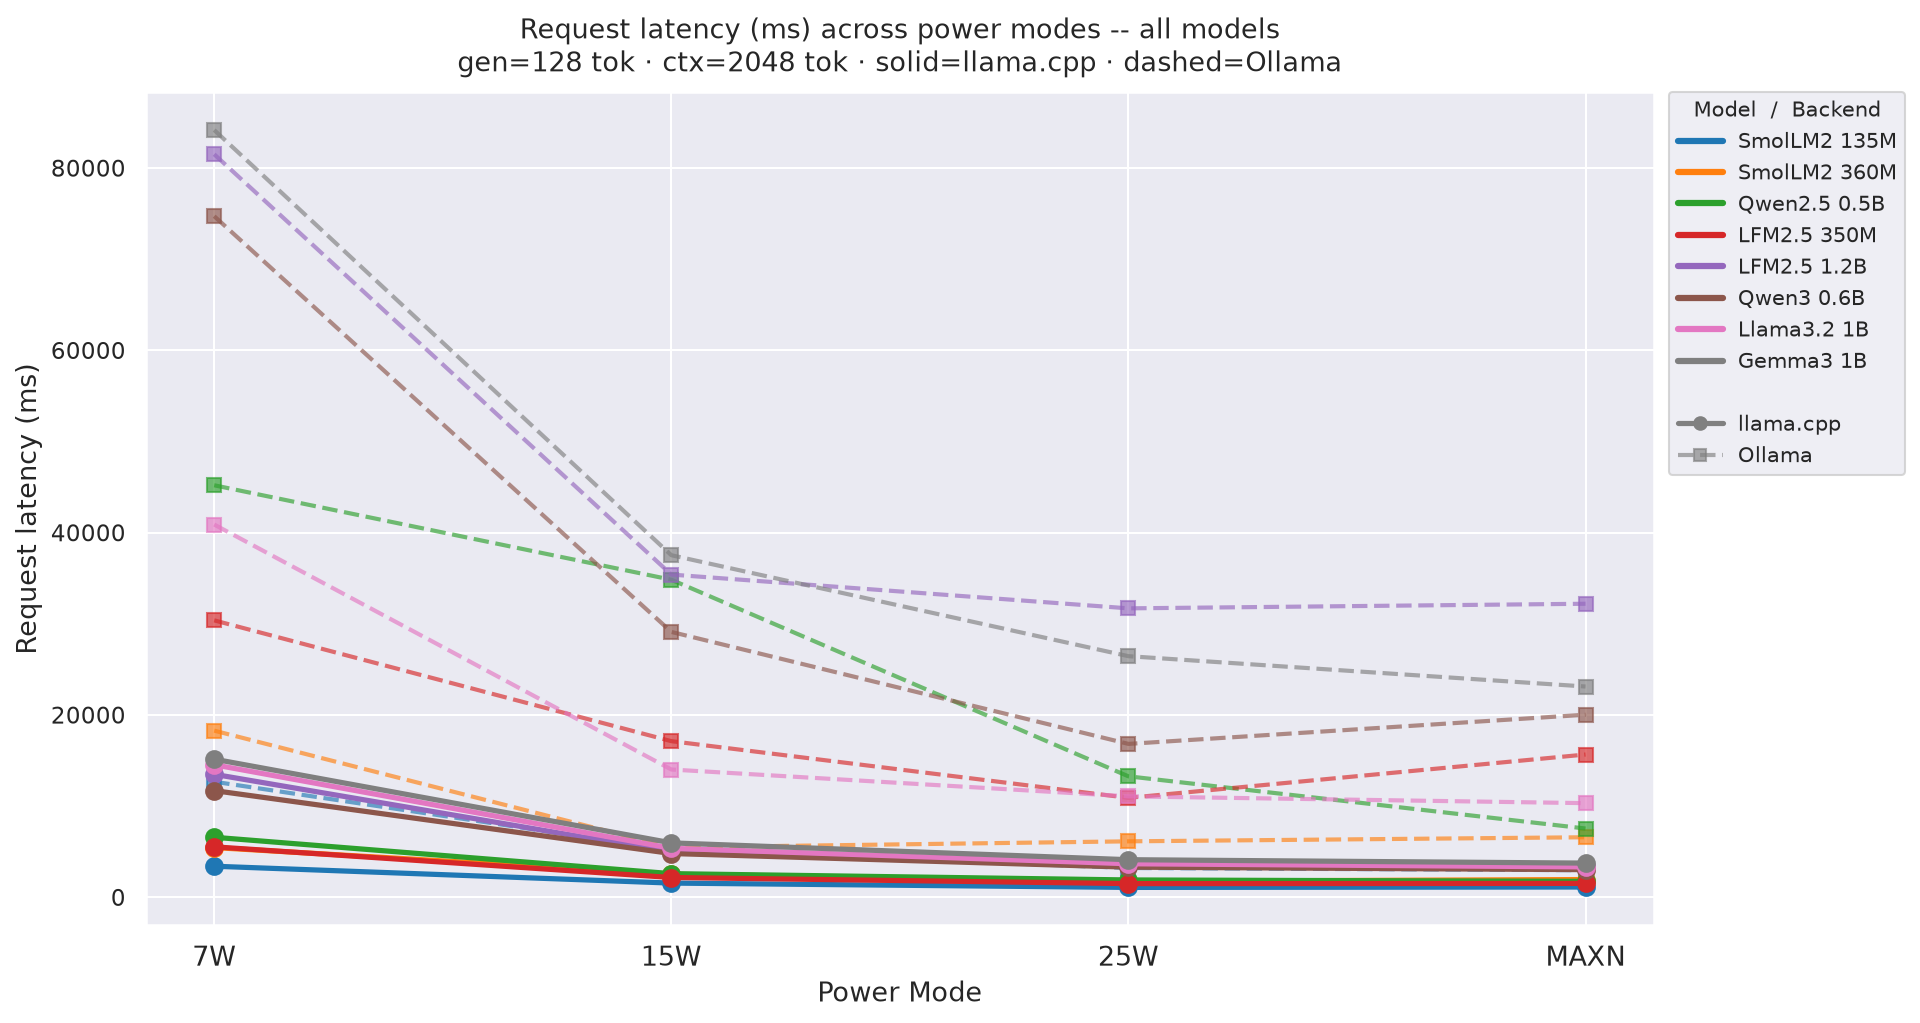
Figure E.1c: Request latency across power modes - gen=256 (canonical)
TTFT p50 (median time to first token, ms) is driven almost entirely by prompt length - it is the prefill cost. These charts show how it varies across power modes with one line per model (solid = llama.cpp, dashed = Ollama).
Figure F.1a: TTFT across power modes - gen=64
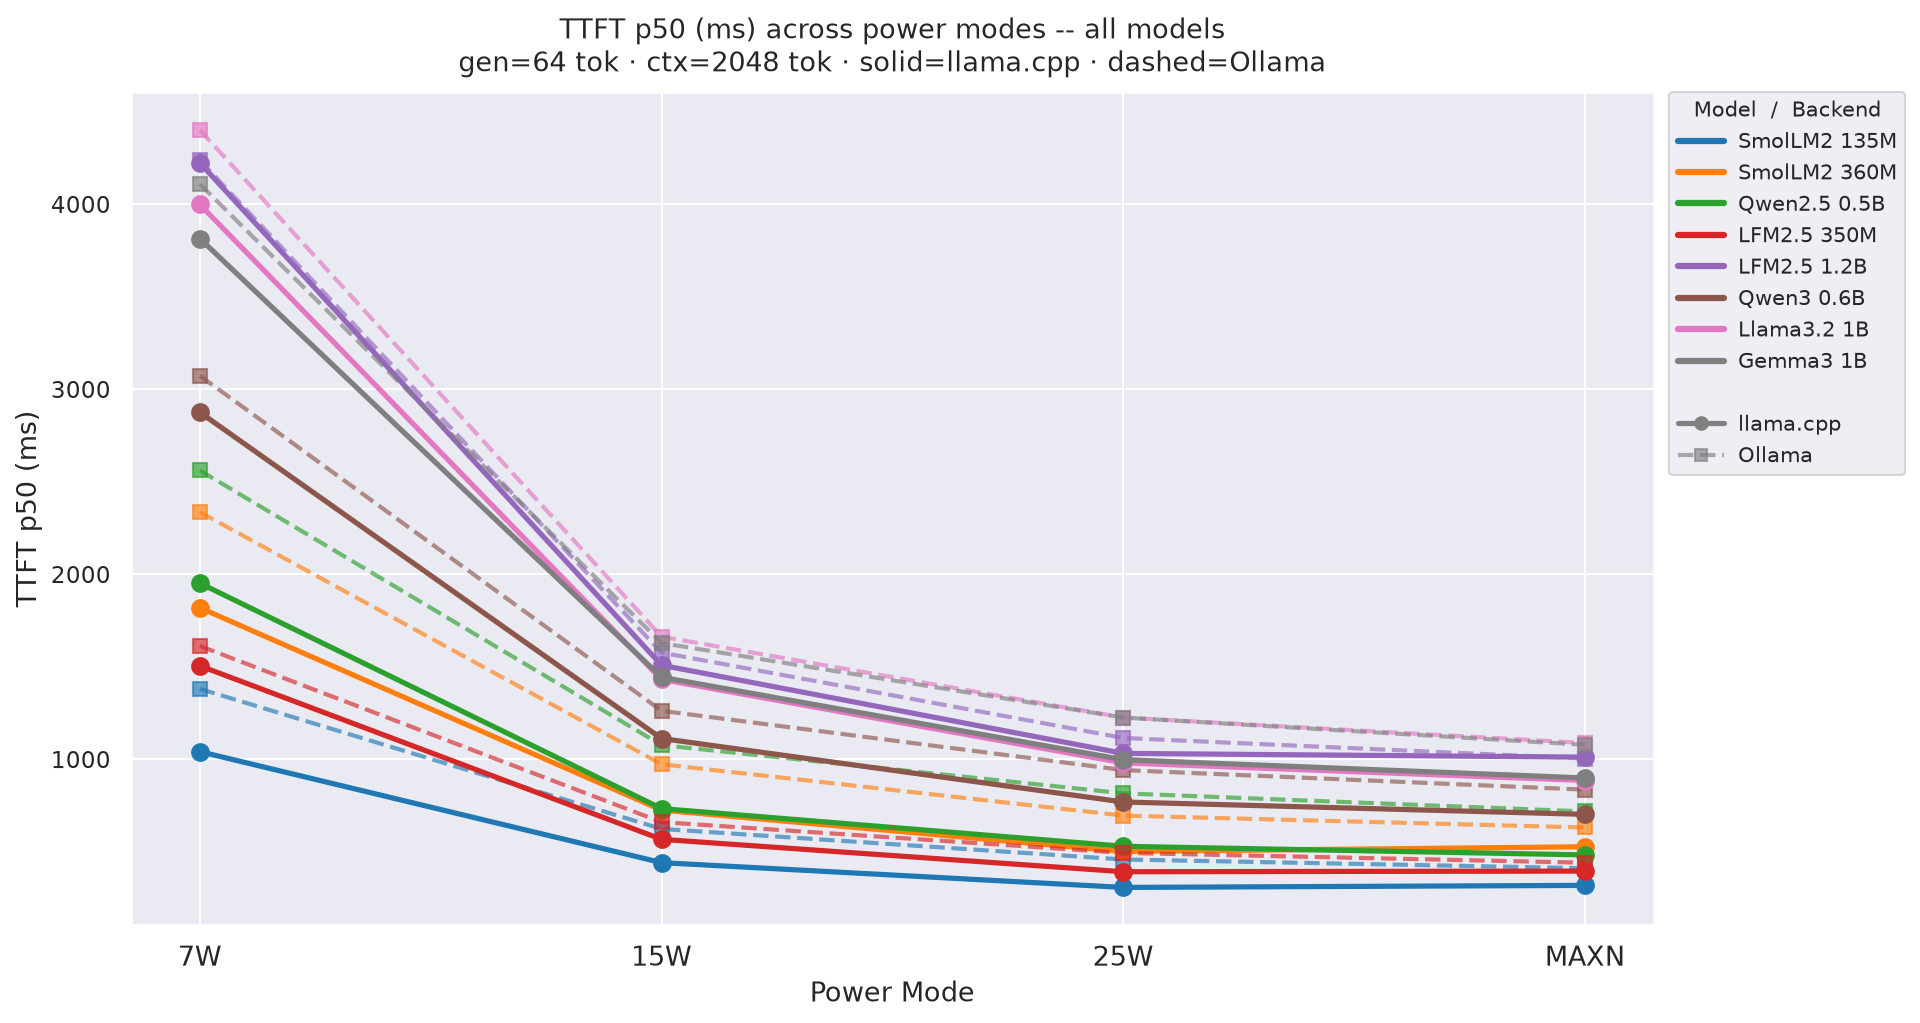
Figure F.1b: TTFT across power modes - gen=256 (canonical)
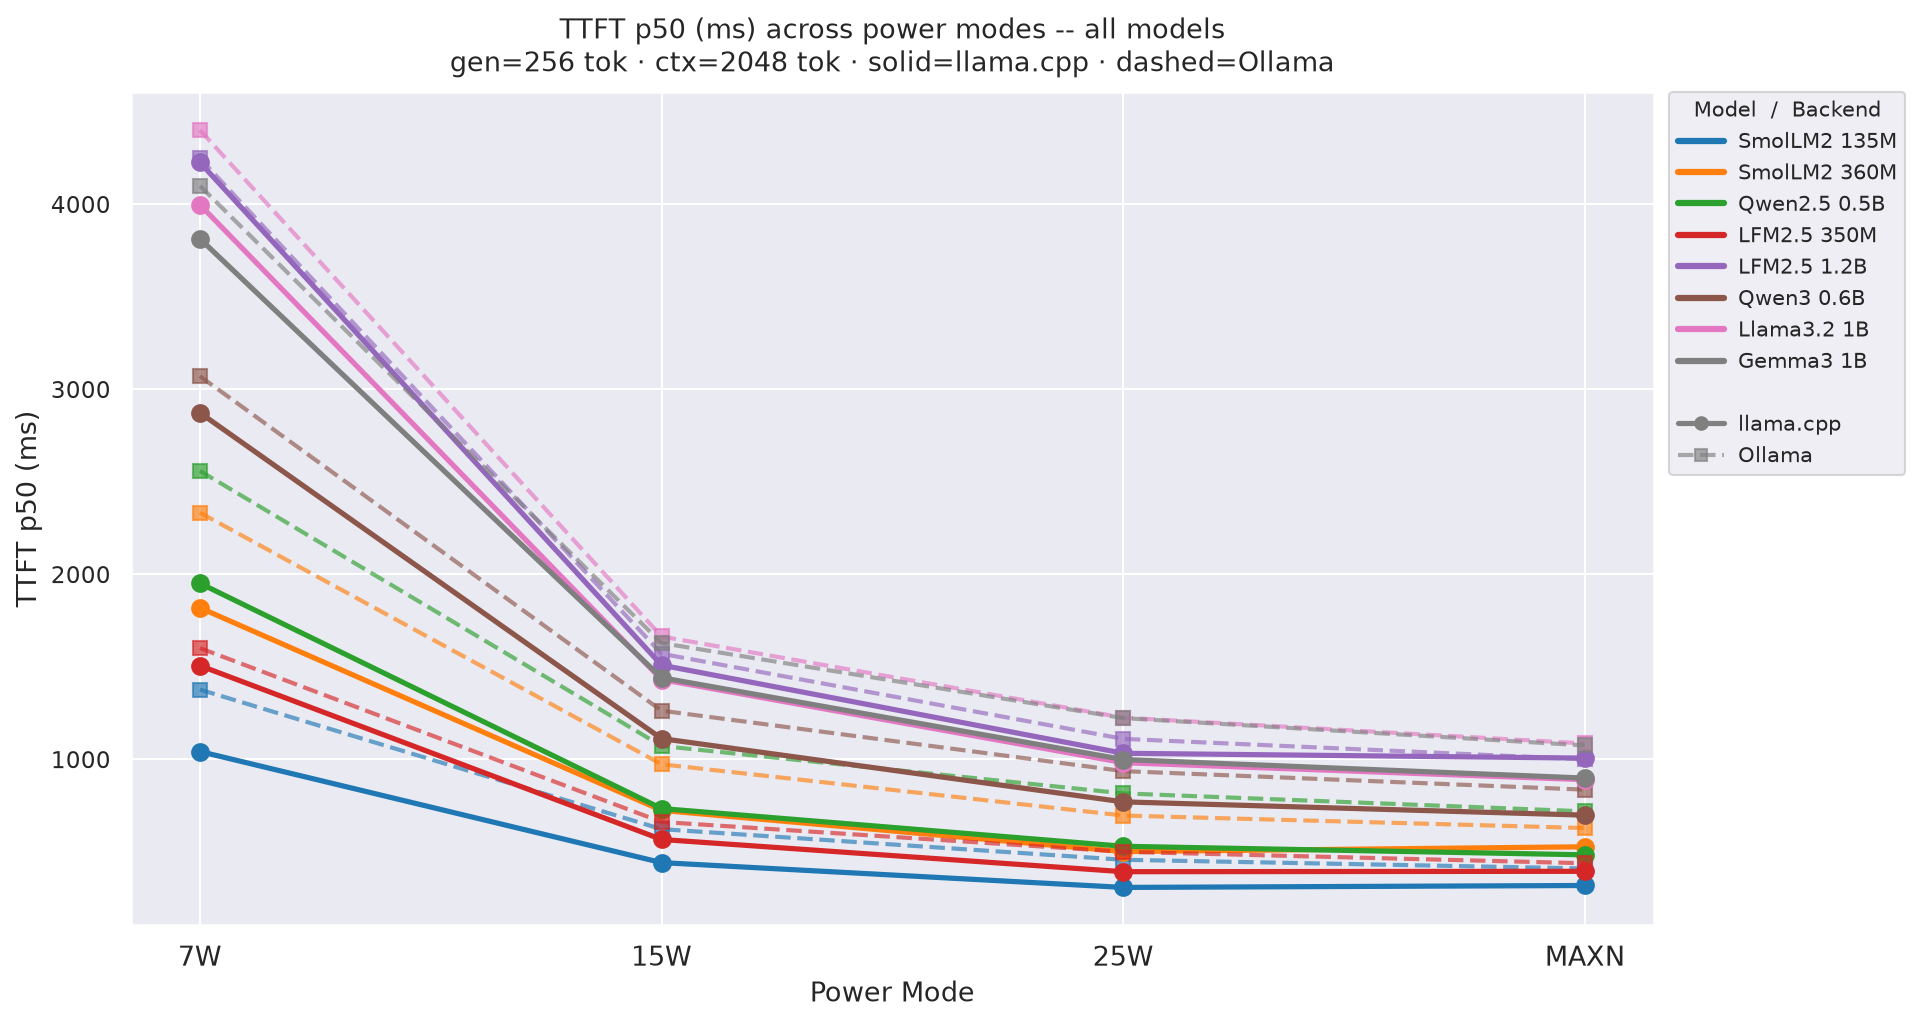
TTFT is independent of gen length, so only gen=64 and gen=256 are shown.
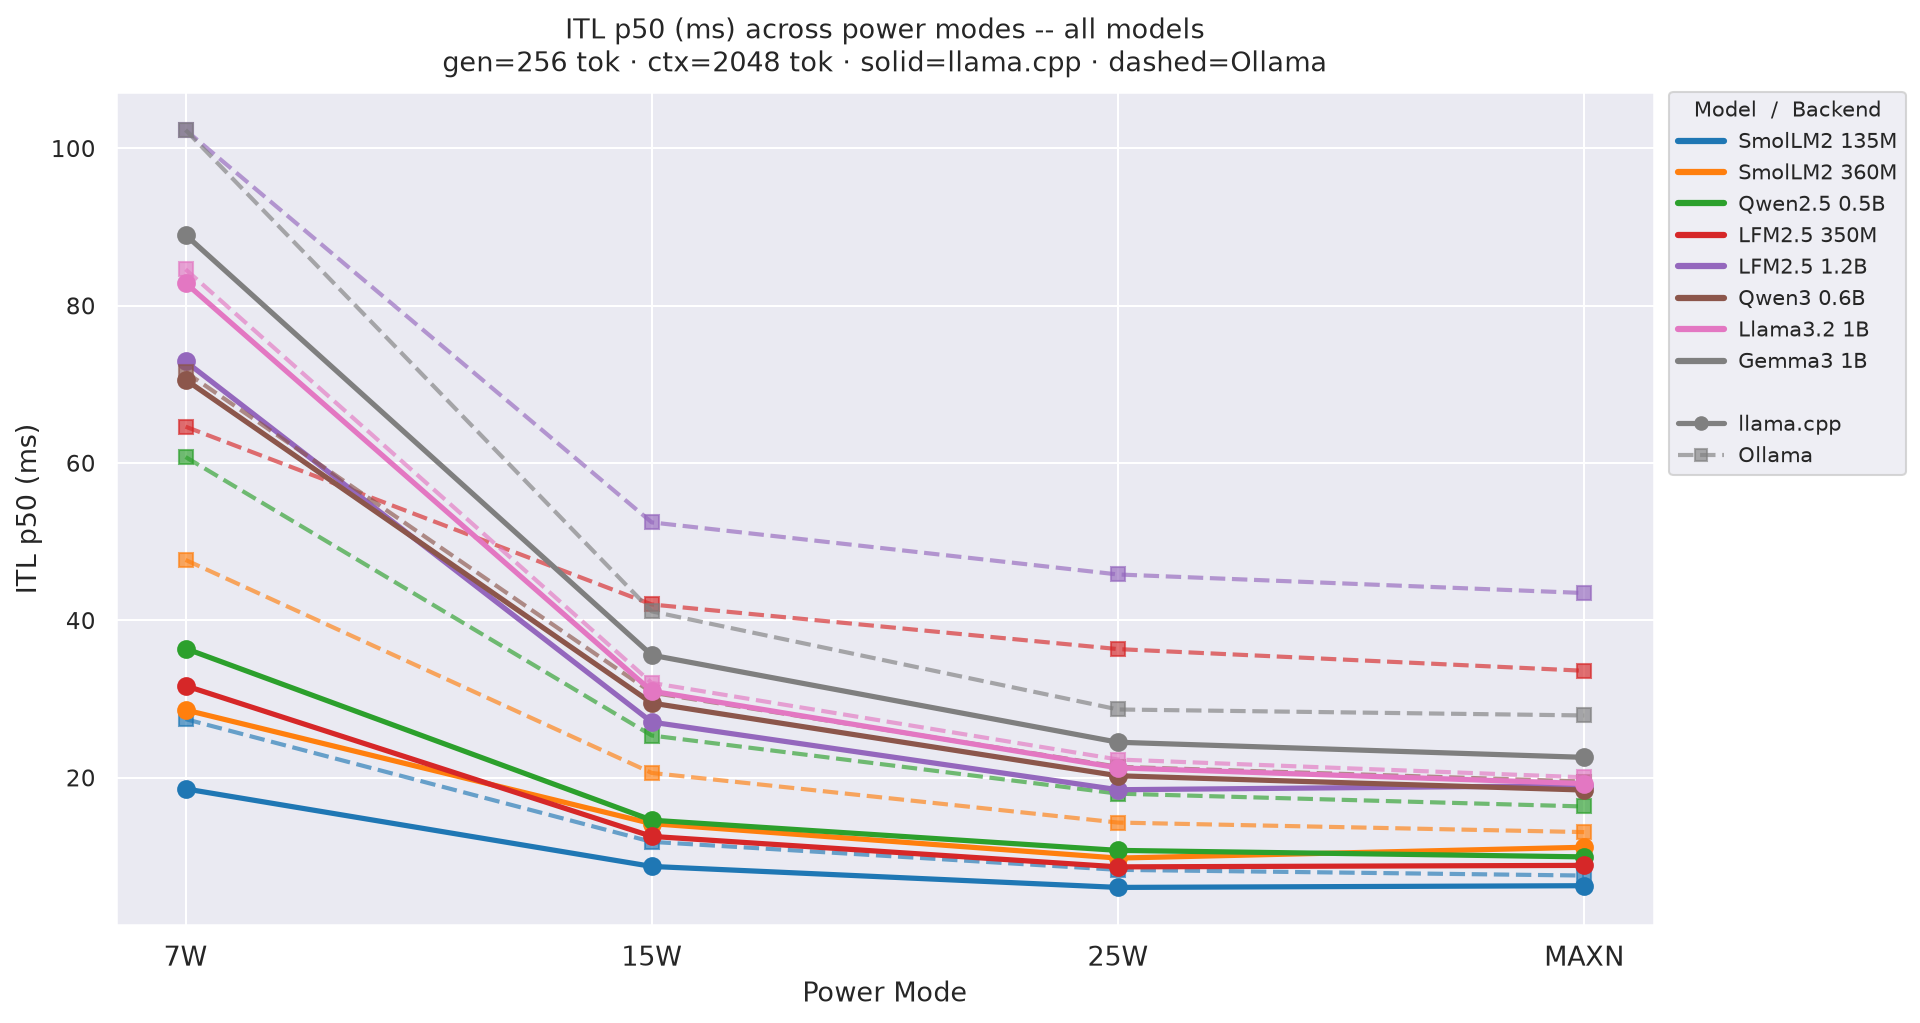
Inter-token latency (ms) = time between consecutive output tokens. It measures decode cost and is driven by model size and GPU clock, not prompt length. Charts show variation across power modes with one line per model (solid = llama.cpp, dashed = Ollama).
Figure G.1a: ITL across power modes - gen=64
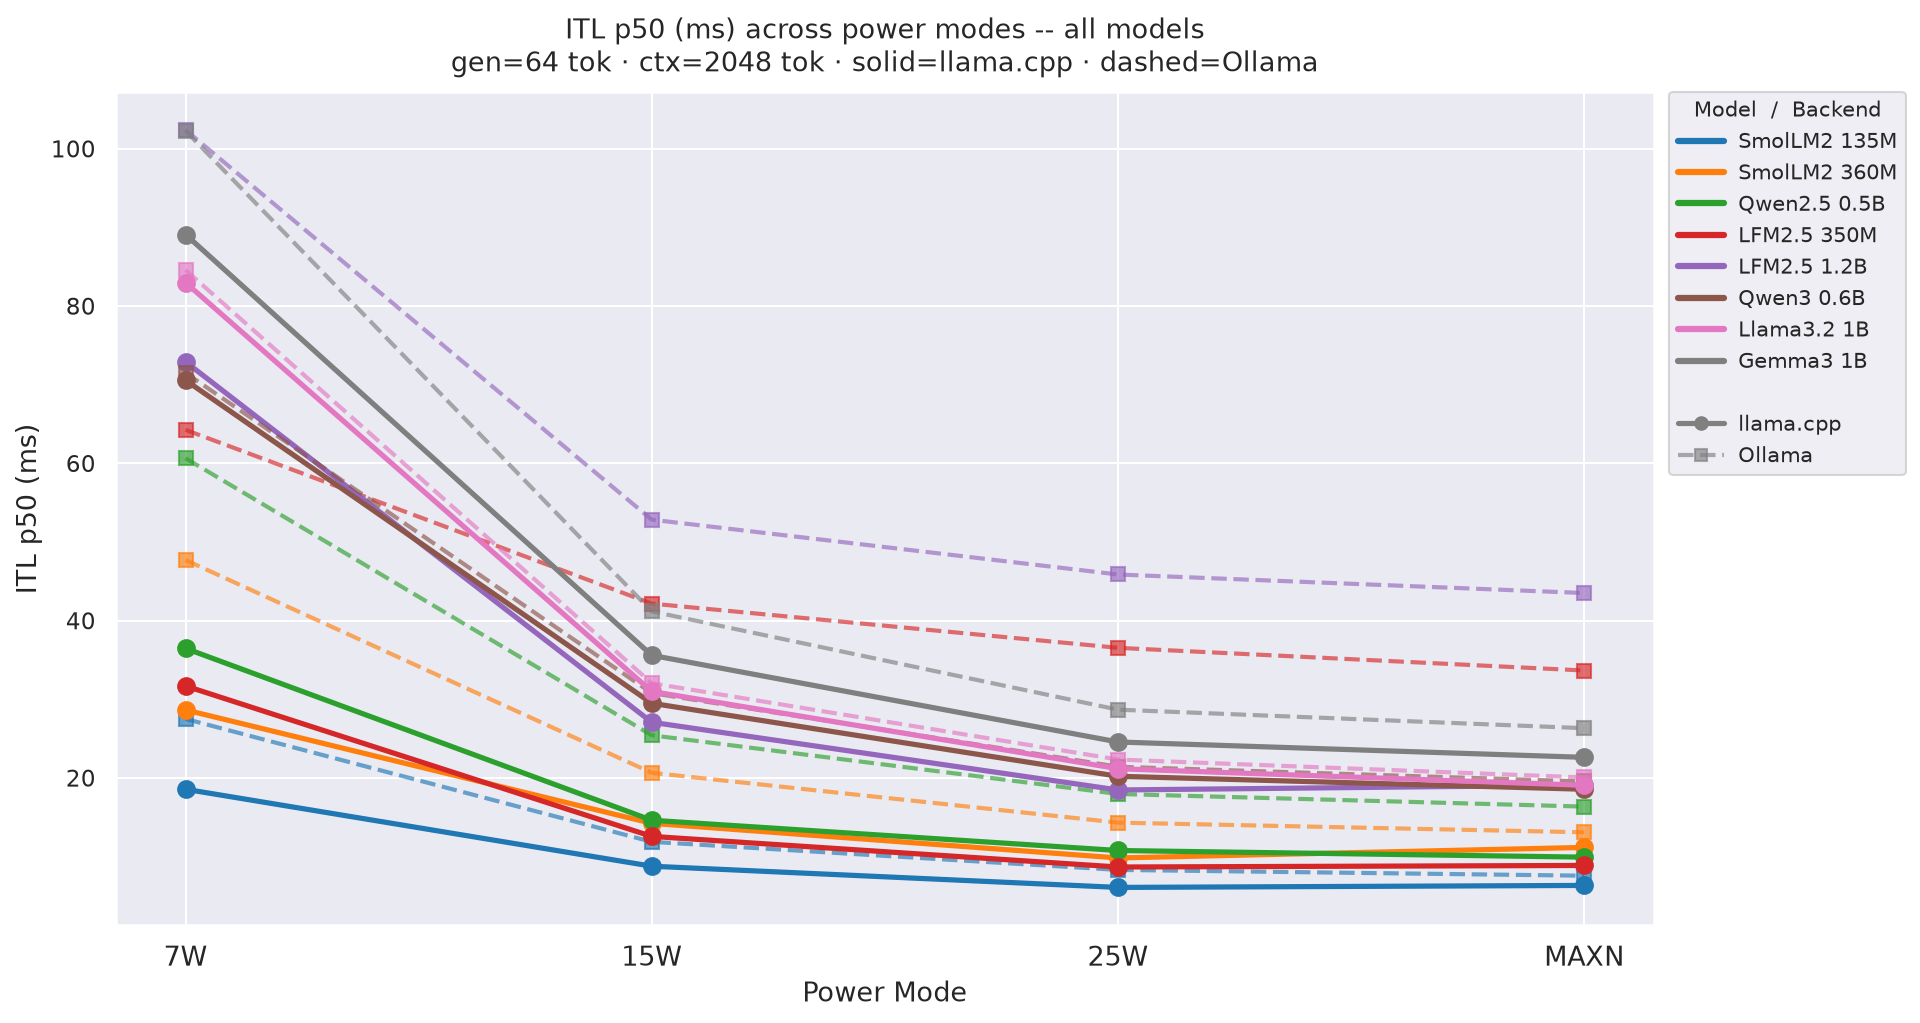
Figure G.1b: ITL across power modes - gen=128
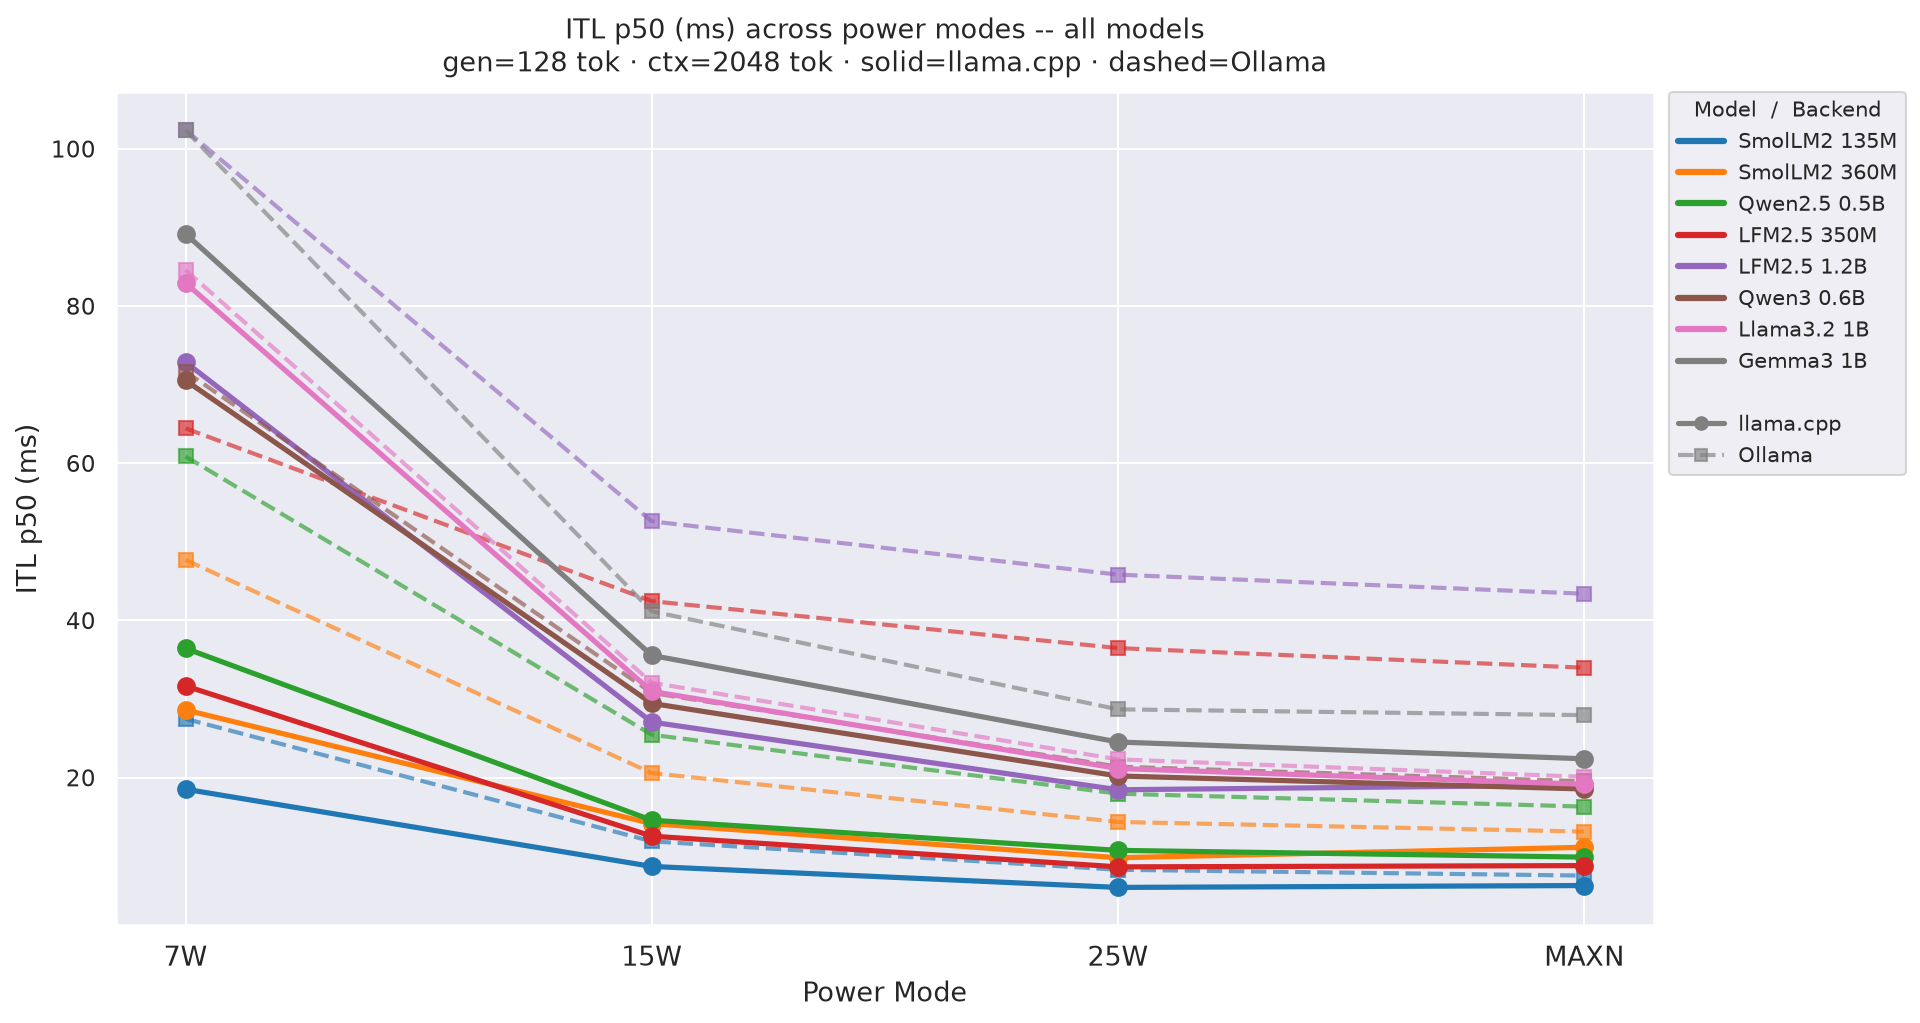
Figure G.1c: ITL across power modes - gen=256 (canonical)
Prefill throughput (tok/s) measures how fast the model processes input tokens. It scales with prompt length (longer prompts hit peak GPU utilisation) and GPU clock speed. Faster prefill directly determines TTFT - they are mechanically linked.
Figure H.0 - Prefill tok/s (top, bold) + TTFT p50 ms (bottom, faded) across power modes
Same X-pattern as Figure A.1: Prefill tok/s rises left→right while TTFT falls, keeping both groups visually separate. ctx=2048 gen=256.
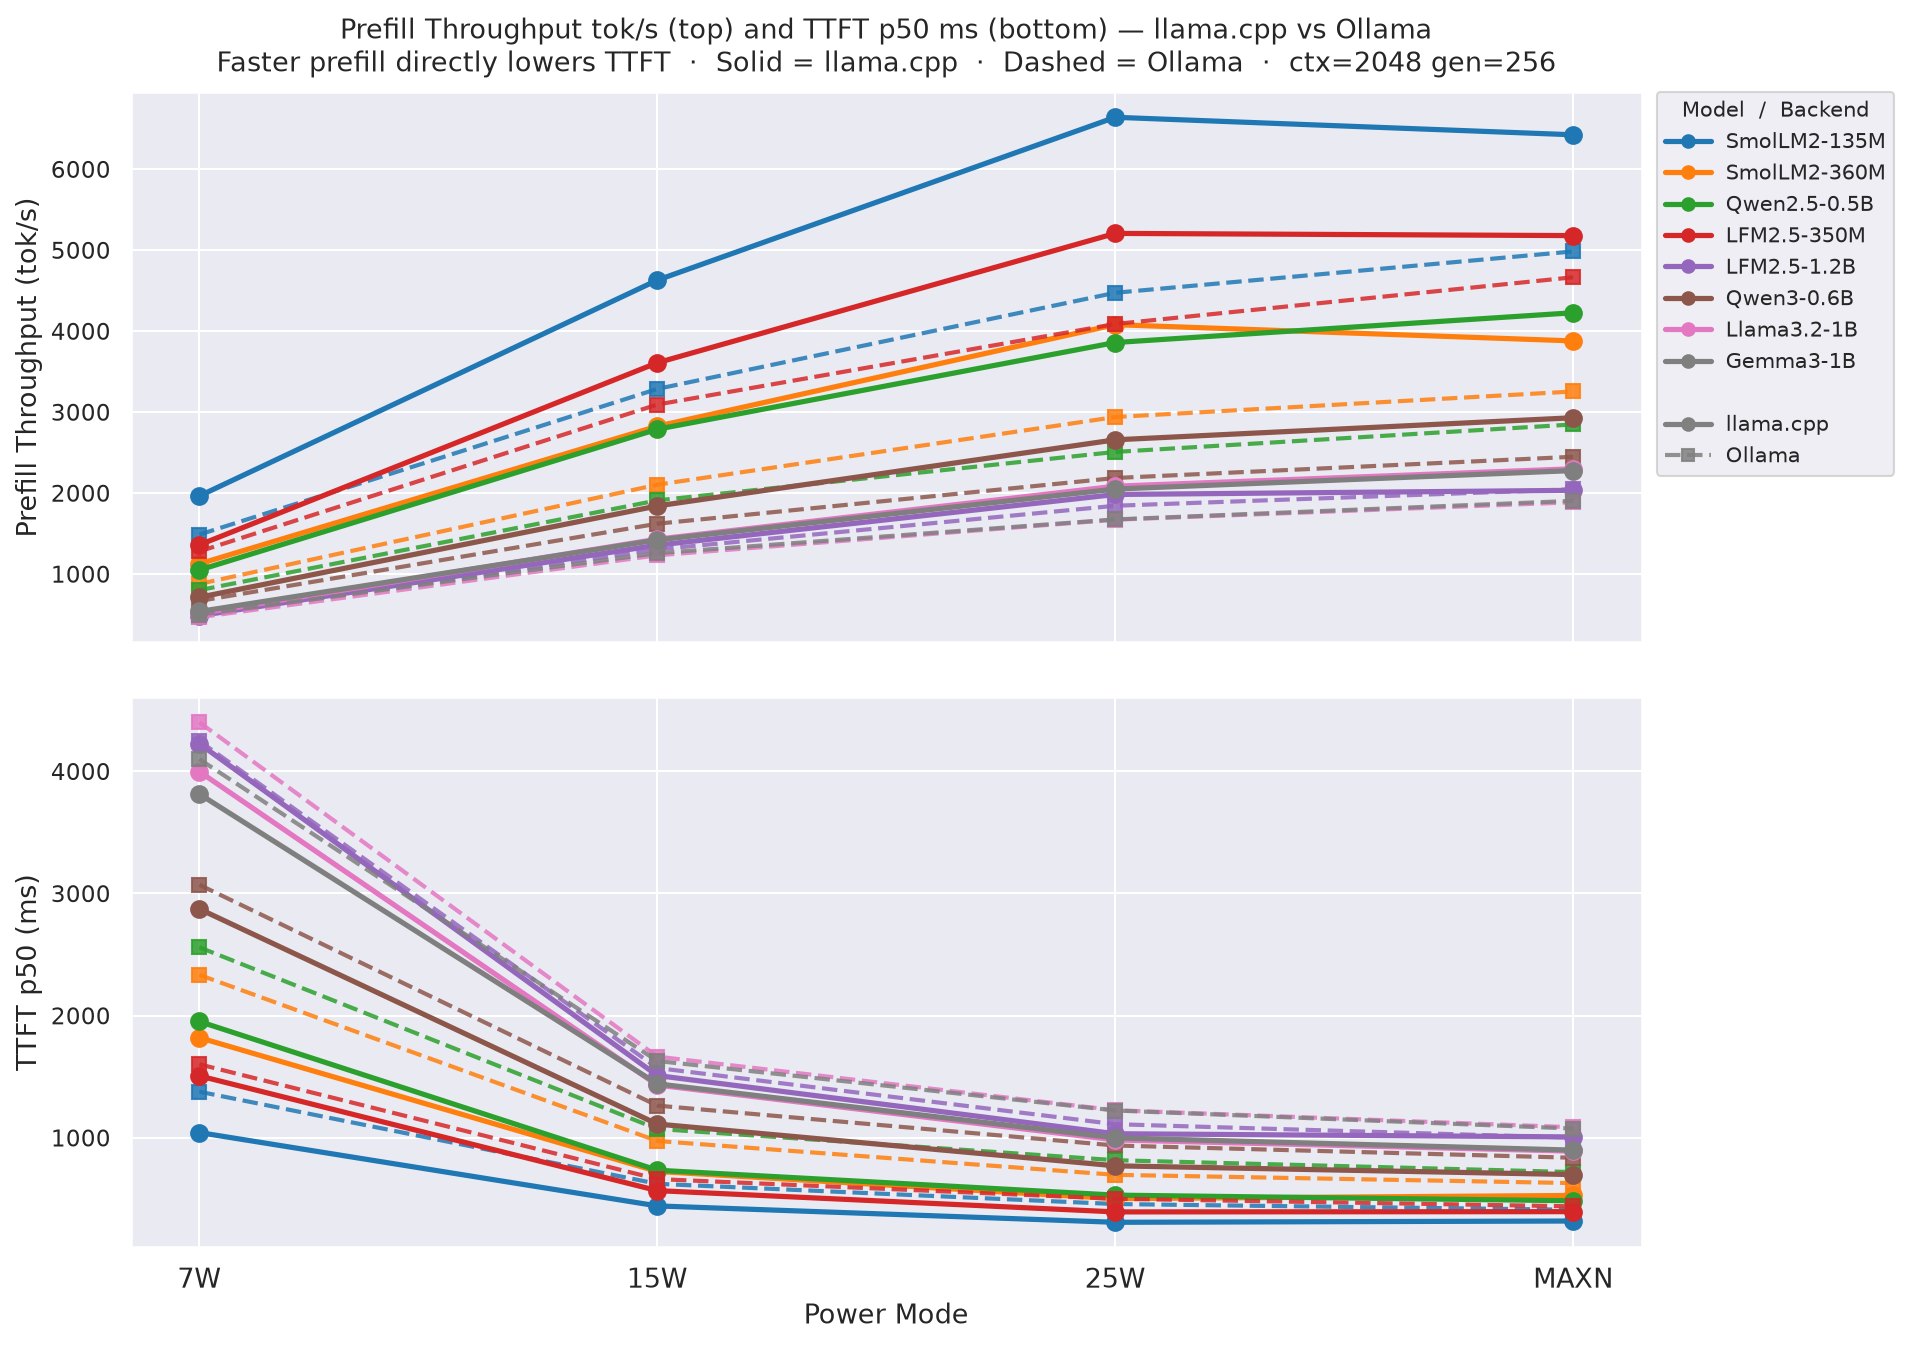
Figure H.1a: Prefill throughput vs prompt length: gen=64
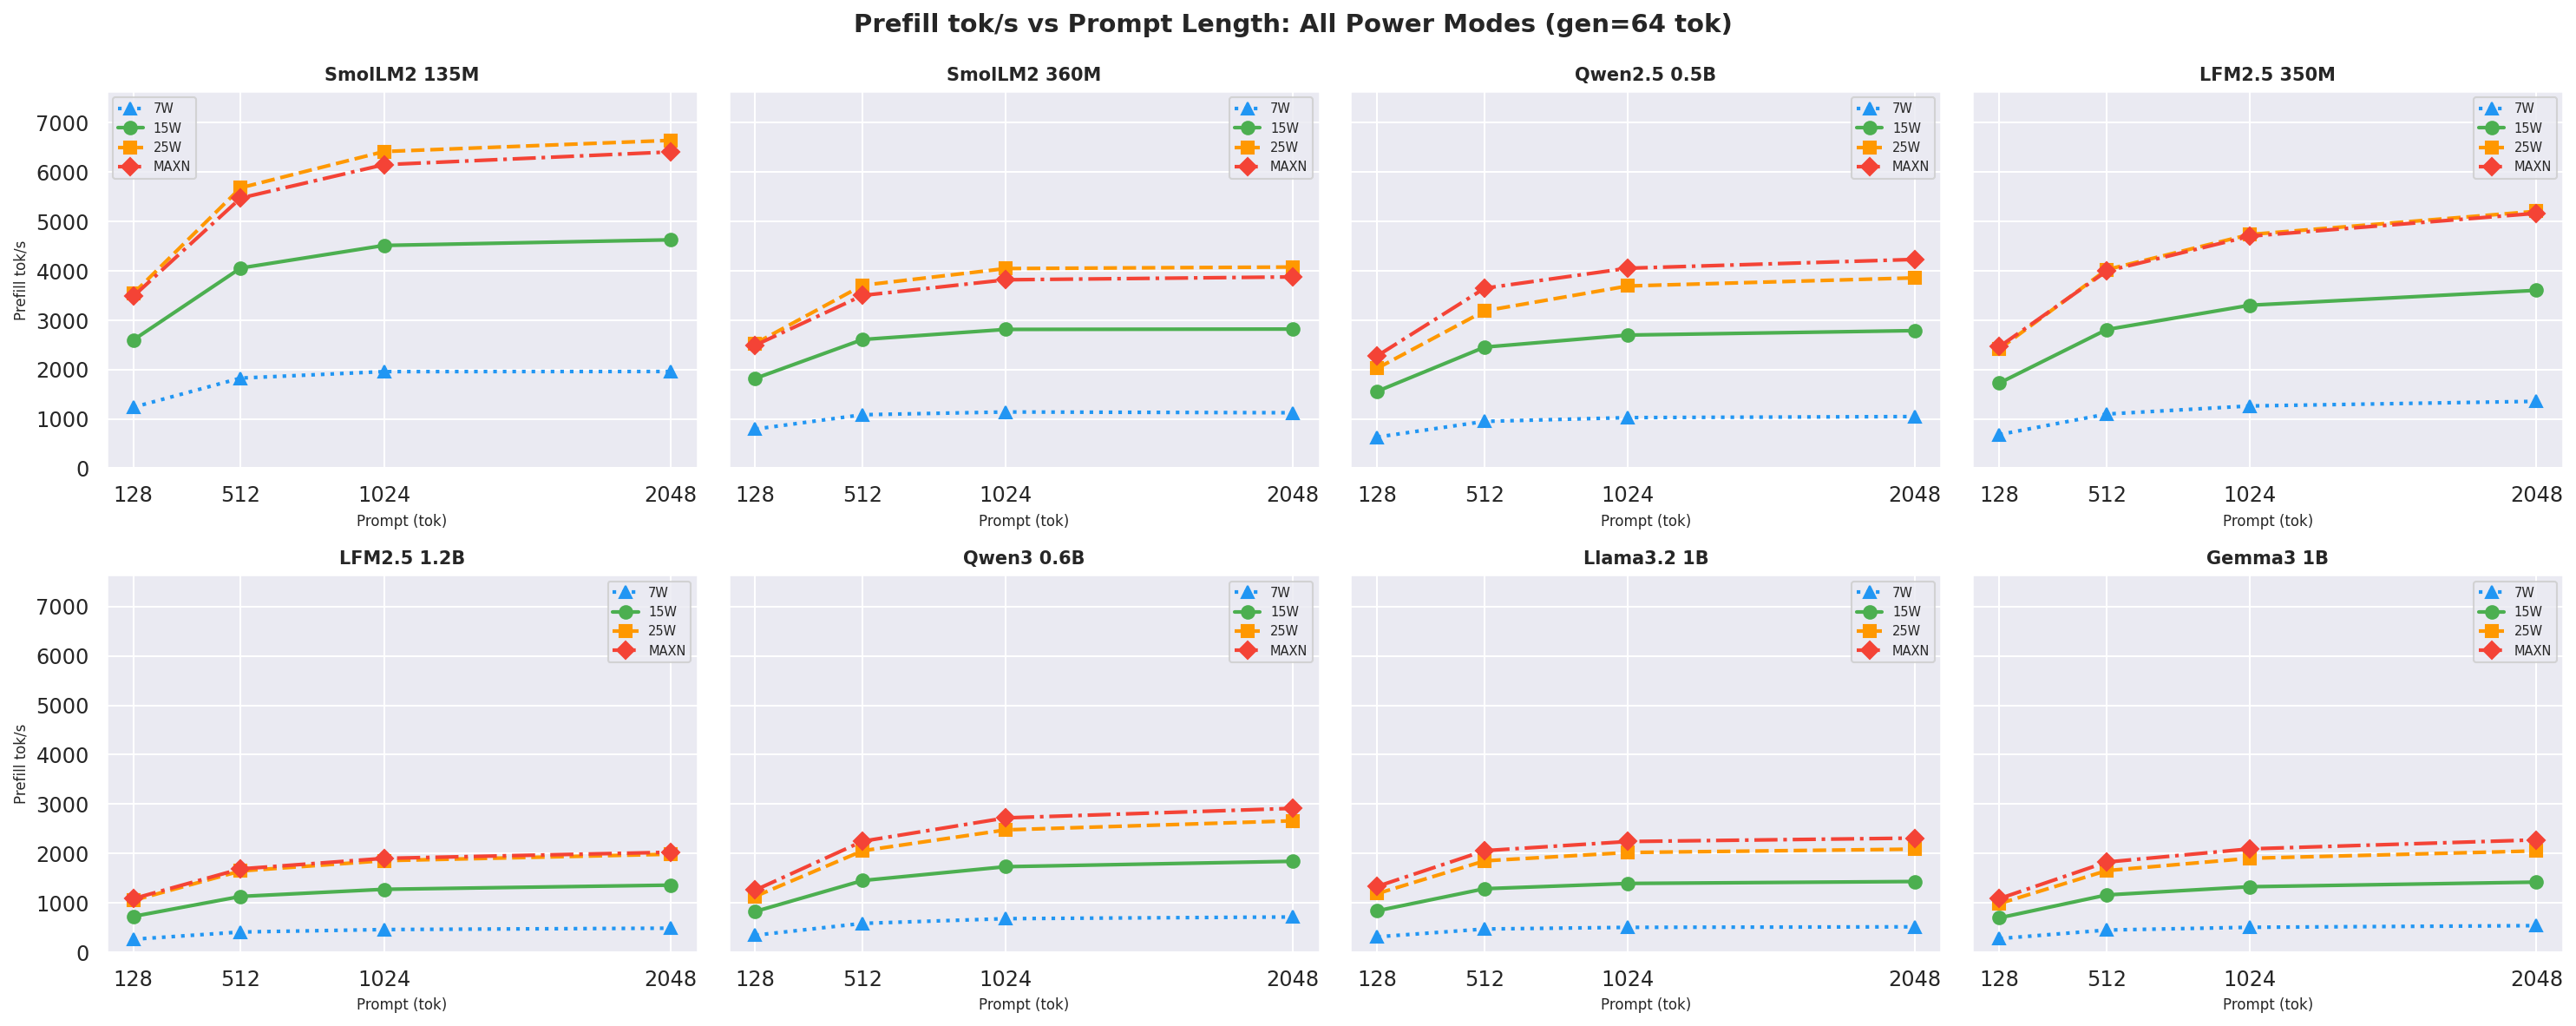
Figure H.1b: Prefill throughput vs prompt length: gen=256 (canonical, also in section 2.4)
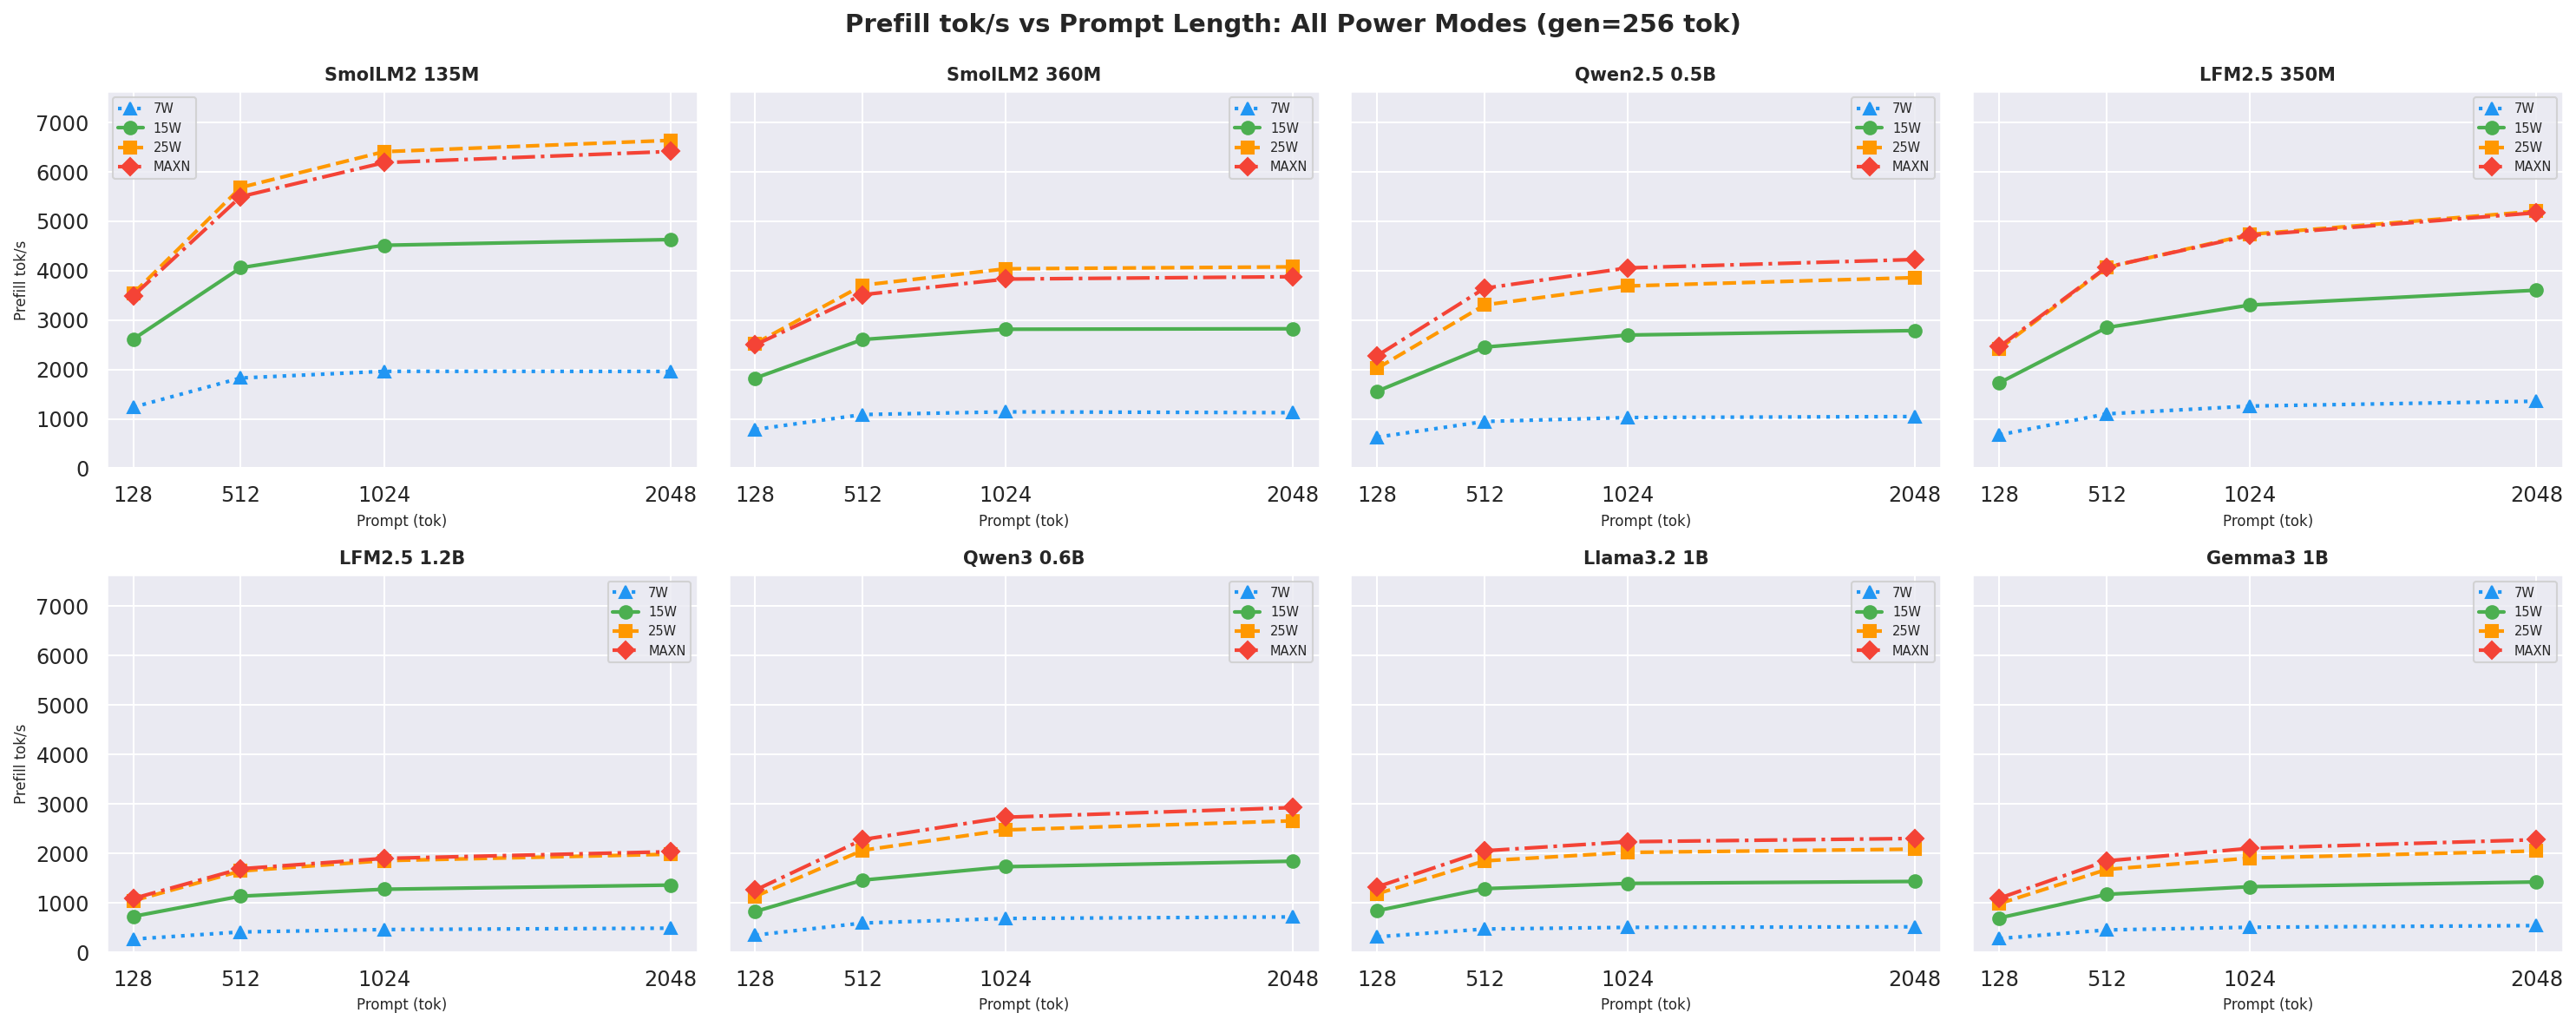
Prefill throughput is independent of gen length, so only gen=64 and gen=256 are shown.
This appendix documents every metric reported in this benchmark, its formula, its source, and any caveats.
| Symbol | Source | Definition |
|---|---|---|
ISL |
aiperf JSON input_sequence_length.avg |
Actual input tokens processed per request (may differ from target due to tokenizer rounding) |
OSL |
aiperf JSON output_sequence_length.avg |
Actual output tokens generated per request |
TTFT |
aiperf JSON time_to_first_token.p50 (ms) |
Median time from request sent to first output token received; proxy for prefill duration. p50 used (not avg) to avoid skew from occasional slow requests |
ITL |
aiperf JSON inter_token_latency.p50 (ms) |
Median time between consecutive output tokens; per-token decode cost. p50 used for robustness against outliers |
RL |
aiperf JSON request_latency.p50 (ms) |
Median total wall time per request: TTFT + all inter-token intervals. p50 used for energy calculations |
tok_s |
aiperf JSON output_token_throughput_per_user.avg |
Output tokens per second, single-user (OSL / RL in steady state) |
prefill_tput |
aiperf JSON prefill_throughput_per_user.avg |
Input tokens processed per second during prefill phase |
p50_decode_s |
computed | Median decode duration in seconds: (RL_p50 - TTFT_p50) / 1000, or from per-request timestamps in profile_export.jsonl |
t0, t1 |
aiperf JSON start_time, end_time (ISO 8601) |
Wall-clock start and end of the full 20-request profiling run |
mW_i |
tegrastats VDD_CPU_GPU_CV field (mW) |
Instantaneous power on the CPU+GPU+CV rail at sample i |
All aiperf metrics are averages over 20 requests per combo. Percentile variants (p50, p90, p99) are also available in the raw JSON but not reproduced here.
avg_power_W = median(mW_i for all tegrastats samples where t0 <= sample_time <= t1) / 1000
VDD_CPU_GPU_CV covers the CPU, GPU, and Computer Vision engine railVDD_INVDD_IN is ~1.5-3 W higher than VDD_CPU_GPU_CV during inferenceoutput_tok_J = OSL / (avg_power_W * RL_p50_s)
Where RL_s = RL / 1000 (request latency in seconds).
Higher is better. This measures how many output tokens are generated per joule of compute energy. It is the primary metric of the benchmark.
Not affected by the prefill/decode split approximation (see section I.7).
total_J = avg_power_W * (RL / 1000)
Energy consumed by one average request from first byte sent to last token received. Accurate for all cells regardless of TTFT.
prefill_J  = avg_power_W * (TTFT / 1000)
decode_J   = avg_power_W * ((RL - TTFT) / 1000)
           = total_J - prefill_J

prefill_%  = prefill_J / total_J * 100
CAUTION: See energy measurement caveat.
prefill_tok_J = ISL / prefill_J
              = ISL / (avg_power_W * TTFT_s)

decode_tok_J  = OSL / decode_J
              = OSL / (avg_power_W * (RL_s - TTFT_s))

total_tok_J   = (ISL + OSL) / total_J
              = (ISL + OSL) / (avg_power_W * RL_s)
Where TTFT_s = TTFT / 1000, RL_s = RL / 1000.
prefill_tok_J: input tokens processed per joule of prefill energy. Affected by the approximation in I.5.decode_tok_J: output tokens generated per joule of decode energy. Reasonably accurate.total_tok_J: all tokens (in + out) per joule of total request energy. Accurate.mJ_per_output_tok = (decode_J / OSL) * 1000
= 1000 / decode_tok_J
Millijoules per generated output token (decode_J is in joules, ×1000 converts to mJ for readability). Carries the same caveat as I.5 for cells where TTFT < 500 ms.
prefill_tput (tok/s) = aiperf JSON prefill_throughput_per_user.avg
Directly from aiperf. Measures how fast input tokens are processed during the prefill phase. Scales with prompt length (longer prompts hit peak GPU utilisation) and GPU clock.
speedup_25W_vs_15W  = tok_s_25W  / tok_s_15W
speedup_MAXN_vs_15W = tok_s_MAXN / tok_s_15W
speedup_15W_vs_7W   = tok_s_15W  / tok_s_7W
All ratios use the canonical cell (ctx=2048, gen=256) and are shown in Figure 12. tok_s = output_token_throughput_per_user.avg (aiperf); no p50 is available for throughput. Latency speedup ratios (Figure 15) use p50 of per-combo p50 values across all 12 combos.
best_total_tok_J(model) = max(total_tok_J(mode, model, gen, ctx))
                          over all modes in {7W, 15W, 25W, MAXN}
                          and all gen in {64, 128, 256}
                          and all ctx in {128, 512, 1024, 2048}

total_tok_J = (ISL + OSL) / (avg_power_W * RL_p50_s)
The single highest total tok/J value observed for that model across all 48 combinations. Peaks at ctx=2048, gen=64 for every model because the long prompt dominates the (ISL + OSL) numerator.
All percentile variants come directly from aiperf JSON without further computation:
TTFT       = time_to_first_token.p50   (canonical; p50 used everywhere)
TTFT_p90   = time_to_first_token.p90
TTFT_p99   = time_to_first_token.p99
ITL        = inter_token_latency.p50    (canonical; p50 used everywhere)
ITL_p99    = inter_token_latency.p99
RL         = request_latency.p50        (canonical; p50 used everywhere)
RL_p99     = request_latency.p99
| Metric | Accurate? | Condition |
|---|---|---|
output_tok_J |
Always | No phase split needed |
total_J |
Always | Full window power * RL |
decode_J |
Mostly | median power approx decode power since decode dominates window |
decode_tok_J |
Mostly | Same as above |
total_tok_J |
Always | Uses total_J which is accurate |
prefill_J |
TTFT ≥ 500 ms only (37 % of llama.cpp cells; 52 % of Ollama cells) | Needs tegrastats sample in prefill window |
prefill_tok_J |
TTFT ≥ 500 ms only (37 % of llama.cpp cells; 52 % of Ollama cells) | Derived from prefill_J |
prefill_% |
TTFT ≥ 500 ms only (37 % of llama.cpp cells; 52 % of Ollama cells) | Derived from prefill_J |
mJ_per_output_tok |
Mostly | Derived from decode_J |
avg_power_W = median(tegrastats.VDD_CPU_GPU_CV[mW] / 1000
              for all samples where aiperf_t0 <= sample_time <= aiperf_t1)
Power is the median VDD_CPU_GPU_CV (CPU+GPU+CV rail) from tegrastats sampled at 500 ms intervals, over each model’s active inference windows only (idle/cool-down between models excluded).
Junction temperature (TJ) is the hottest internal die temperature on the Jetson SoC, reported by tegrastats as tj@. The hardware automatically throttles GPU/CPU clocks when TJ reaches ~95 °C to prevent damage. Peak TJ < 70 °C across all runs confirms ample thermal headroom at every power mode.
| Symbol | Source | Definition |
|---|---|---|
VDD_CPU_GPU_CV |
tegrastats | Instantaneous power (mW) on the CPU+GPU+CV rail |
cpu@ |
tegrastats | CPU cluster temperature (°C) |
gpu@ |
tegrastats | GPU temperature (°C) |
tj@ |
tegrastats | Junction (hottest internal die) temperature (°C) |
avg_power_W |
computed | Median VDD_CPU_GPU_CV over active inference window (W) |
avg_cpu_C |
computed | Mean CPU temp over active inference window |
avg_gpu_C |
computed | Mean GPU temp over active inference window |
peak_tj_C |
computed | Maximum TJ temperature observed |
Throttling is flagged when peak_tj_C > 85 °C (leaving a 10 °C safety margin below the hardware limit).
⚠ Why Models with Weights > ~1 GB Were Not Tested
All models in this benchmark have GGUF weights ≤ 958 MB. Larger models fail to load on JetPack R36.4.7 (L4T 36.4) regardless of power mode or available memory. This is a known regression in the CUDA IOVA / NvMap contiguous-memory allocator introduced in this JetPack release - not a simple “out of RAM” failure.
Root cause: On Jetson platforms, the CUDA driver allocates device-mapped memory through the
NvMapkernel driver, which requires a single contiguous block in the IOVA (I/O Virtual Address) space. Unlike a general-purpose allocator that can stitch together scattered pages, NvMap must find one unbroken IOVA range large enough for the entire allocation in a single call.The allocation fails immediately with
NvMapMemAllocInternalTagged: error 12 (ENOMEM)- errno 12 isENOMEM, “not enough memory” in the contiguous-mapping sense, not the total-capacity sense.What this means in practice: Any GGUF model requiring more than roughly 1.1 GB of contiguous CUDA buffers is blocked at load time on this JetPack version. Smaller models load fine because their contiguous IOVA requirement fits within what the fragmented address space can still provide.
Affected platform: NVIDIA Jetson Orin Nano Super 8GB running JetPack R36.4.7 (L4T 36.4.7 / Ubuntu 22.04). The same board on JetPack 6.2.2 (L4T 36.5) resolves this regression.
All tok/J and power figures in this report use the VDD_CPU_GPU_CV rail from tegrastats at 500 ms intervals.
Method:
tok/J = OSL ÷ (decode_power_W ×p50_decode_s)- output tokens per joule of decode-phase energy.llama.cpp 15W / 25W / MAXN: per-request decode-phase tegrastats via
profile_export.jsonltimestamps.Ollama (all modes): per-request decode-phase power extracted from per-mode
tegrastats.logusingmodel_timing.logwindows.llama.cpp 7W: whole-run average power (no tegrastats retained for that run; power values recovered from original local logs). Tok/J uses the older
tok/s ÷ avg_power_Wapproximation - marked ‡ in all tables.
⚠ Prefill power caveat: when TTFT < 500 ms, tegrastats (500 ms interval) captures zero samples in the prefill window, so prefill power falls back to timeline-reconstructed whole-window average. This affects 63 % of llama.cpp cells and 48 % of Ollama cells (llama.cpp prefills faster at the same ctx, so more of its cells fall below 500 ms). Both datasets have 100 %
profile_export.jsonlcoverage. Decode tok/J and total tok/J are not affected (decode windows are always multiple seconds long).
此内容由惯性聚合(RSS阅读器)自动聚合整理,仅供阅读参考。 原文来自 — 版权归原作者所有。