惯性聚合 高效追踪和阅读你感兴趣的博客、新闻、科技资讯
阅读原文 在惯性聚合中打开

推荐订阅源

Threat Intelligence Blog | Flashpoint
博客园_首页
钛媒体:引领未来商业与生活新知
钛媒体:引领未来商业与生活新知
博客园 - 叶小钗
A
About on SuperTechFans
量子位
G
Google Developers Blog
云风的 BLOG
云风的 BLOG
T
Threat Research - Cisco Blogs
Spread Privacy
Spread Privacy
Hacker News - Newest:
Hacker News - Newest: "LLM"
N
News and Events Feed by Topic
C
Cybersecurity and Infrastructure Security Agency CISA
cs.AI updates on arXiv.org
T
Tenable Blog
V
V2EX
月光博客
月光博客
L
Lohrmann on Cybersecurity
W
WeLiveSecurity
Webroot Blog
Webroot Blog
H
Hacker News: Front Page
酷 壳 – CoolShell
酷 壳 – CoolShell
T
The Exploit Database - CXSecurity.com
freeCodeCamp Programming Tutorials: Python, JavaScript, Git & More
博客园 - 三生石上(FineUI控件)
T
Troy Hunt's Blog
Google Online Security Blog
AI
AI
腾讯CDC
Recent Commits to openclaw:main
Google DeepMind News
CTFtime.org: upcoming CTF events
V2EX - 技术
V2EX - 技术
Martin Fowler
Martin Fowler
博客园 - Franky
I
Intezer
Project Zero
Project Zero
I
InfoQ
P
Privacy International News Feed
C
Check Point Blog
T
The Blog of Author Tim Ferriss
P
Palo Alto Networks Blog
L
LINUX DO - 最新话题
有赞技术团队
有赞技术团队
Cloudbric
Cloudbric
人人都是产品经理
人人都是产品经理
cs.CL updates on arXiv.org
S
SegmentFault 最新的问题
Latest news
Latest news
小众软件
小众软件

Discord Blog

Making It Easier Than Ever to Connect with Friends in League & VAL! Every Voice and Video Call on Discord Is Now End-to-End Encrypted How to Link Discord to Battlefield 6, Marvel Rivals & More Official Discord Integrations for Steal a Brainrot, Grow a Garden, Brookhaven RP, and more Celebrate Discord’s 11th Birthday with an Exclusive Set of Emoji and Wallpapers Nitro Now Comes with Xbox Game Pass and New Benefits. Welcome to Nitro Rewards. How to Use Nitro: A Beginner’s Guide to Discord’s Premium Subscription Stock Up in the New Rust Shop! Enjoy a Discord-Only 20% Sale on Most Items until 5/21 How Discord Automates ScyllaDB Clusters at Scale Discord Patch Notes: May 4, 2026 You’ve Got (Too Much) Mail: Behind the Scenes of the 3/25/26 Voice Outage Discord Patch Notes: April 6, 2026 MULTIPLAYER SEQUEL TO ACCLAIMED AAAA GAME “THE LAST MEADOW” ANNOUNCED: PLAYABLE NOW Making Discord on Desktop Look Just Right: Display Settings to Ease the Eyes Discord Patch Notes: December 8, 2025 Building on the Social Layer of Games: What’s New from GDC 2026 Gift Ideas for the Dedicated Discord User in Your Life Discord Update: November 6, 2025 Changelog During October, Treat a Friend to Nitro and Trick Out Your Profile for Halloween 🎃 Discord Social SDK Updates & Integrations Go Beyond, Plus Ultra! with the My Hero Academia Collection STAR WARS™ Makes Its Way to Discord Worthy of a Plaque: Nameplates Land in the Shop Announcing Discord’s Social SDK, Helping Power Your Game’s Social Experiences A Cornucopia of Updates Make Discord on Desktop Fresher Than a Crisp Fall Breeze Starting Your First Discord Server Transforming Game Discovery with Instant Play Experiences on Discord Introducing the Discord for Business Newsletter, Vol. 1 Discord Update: March 24, 2026 Changelog Discord Update: December 19, 2024 Changelog How Multi-Factor Authentication Helps Keep Your Discord Account Safe How ROOST is Advancing Online Safety You’re Now Discord Official: Developers, Claim Your Game and Verify Your Server Discord Patch Notes: March 6, 2026 Tracing Discord's Elixir Systems (Without Melting Everything) Getting Global Age Assurance Right: What We Got Wrong and What's Changing Discord Patch Notes: February 4, 2026 Osprey: Open Sourcing our Rule Engine How to Change Your Theme to Bring Your Vibe to Discord Your Discord Checkpoint is Rolling Out! Celebrate What You Did in 2025 How to Customize Your Discord Profile How to Make and Use Custom Emoji on Discord Save and Display Your Faves: Add Discord Shop & Marvel Rivals Items to Your Profile’s Wishlist Discord Patch Notes: November 4, 2025 Bringing In-Game Commerce to Discord Communities Reward Your Play: Complete Quests. Earn Orbs. Get Sweet Stuff. How to Share What You’re Playing, Listening to, or Watching as Your Status on Discord Staff Picks, September 2025: Welcome to Our Video Game Museum From Single-Node to Multi-GPU Clusters: How Discord Made Distributed Compute Easy for ML Engineers Discord Patch Notes: October 7, 2025 Discord Update: September 25, 2025 Changelog New Looks for Nitro, New Looks for You. Get Yourself a Nitro-exclusive Profile Bundle! Discord Patch Notes: September 3, 2025 Bringing DAVE to All Discord Platforms Discord’s Powerful Cross-Platform Chat: Ready for Your Game Introducing the Community Server Cleanup Report for August 2025 Discord for Business Vol. 2: Cannes-worthy ad product updates Discord Patch Notes: August 4, 2025 ROOST Announces “Coop” and “Osprey”: Free, Open-Source Trust and Safety Infrastructure for the AI Era *FLAILS AROUND* SUMMER SPECIAL! JOIN NITRO, GET AN EXTRA MONTH OF NITRO ON US! Get More From Your Boosts With New Server Perks Discord Patch Notes: July 7, 2025 Discord Update: June 30, 2025 Changelog Authenticity Matters: Discord's Pride Month 2025 Staff Picks, June 2025: Summer of Showcases How to Set Up Your Server’s Roles for Members, Mods & Admins Gift Nitro and Earn A Flavorful Splash for your Avatar Discord Patch Notes: June 3, 2025 How to Use the Discord Soundboard & Add More Sounds Checkpoint 3: Leveling Up Discord Quests with Orbs and Advanced Measurement Thank You for Ten Years Staff Picks, May 2025: The Games That Brought Us to Discord Discord Patch Notes: May 1, 2025 How Discord Indexes Trillions of Messages Passing the Torch Discord Appoints Humam Sakhnini as Chief Executive Officer Staff Picks, April 2025: All The Adaptations Make More Closet Space! Nitro Members Can Now Keep Avatar Decoration Quest Rewards for Longer How to Use Discord’s In-Game Overlay to Talk While Playing on PC The Game Developer Playbook, Part One: Getting Started on Discord The Game Developer Playbook, Part Two: Early Access and Pre-Launch MAJOR NEWS: DISCORD ANNOUNCES ITS FIRST IN-HOUSE AAAA VIDEO GAME, “THE LAST MEADOW” Overclocking dbt: Discord's Custom Solution in Processing Petabytes of Data Wicked Saints Turns Players into IRL Superheroes with the Help of e.l.f. Beauty and Discord Discord Update: March 25, 2025 Changelog How to Stream Games and Applications to Discord from Desktop or Mobile Discord Patch Notes: April 3, 2025 Checkpoint 2: Our First Year With Discord Quests How to Create & Upload Your Own Stickers on Discord Revamped Overlay & Refreshed Desktop Give Game Time a Boost Discord Announces First Mobile Ad Format, Broadening Advertising Opportunities Announcing Discord’s Social SDK, Helping Power Your Game’s Social Experiences The Game Developer Playbook: Three Incredible Game-Focused Communities Modern Image Formats at Discord: Supporting WebP and AVIF Discord Patch Notes: March 11, 2025 Supercharging Discord Mobile: Our Journey to a Faster App December Staff Picks: It’s Giving Games Discord Patch Notes: February 3, 2025 Leveling Up Black Voices in Gaming How Discord Seamlessly Upgraded Millions of Users to 64-Bit Architecture
Measure Less to Learn More: Using Fewer, Higher-quality Metrics to Capture What Matters
Jake Mainwaring · 2026-04-28 · via Discord Blog

Six flathead screwdrivers neatly laid down in an alternating pattern.

If you’re reading this blog post, you’re likely familiar with the pull toward more metrics. As organizations grow, so too does the list of things people want to measure. Different metrics matter for different teams, and everyone has Metrics FOMO, worried that leaving one out could prevent us from reaching our Next Big Insight. 

At Discord, this happened with our Default Metric List: a set of metrics that are automatically included in every experiment. Over time, that default list grew as teams added metrics they cared about, while few were removed. We took a step back and asked if we might be better off measuring less

To data teams, suggesting we measure less feels like heresy. “Our job is to measure! Why would we, the organization’s shrewdest pattern finders, knowingly leave data on the table?” The encounter below might look familiar:
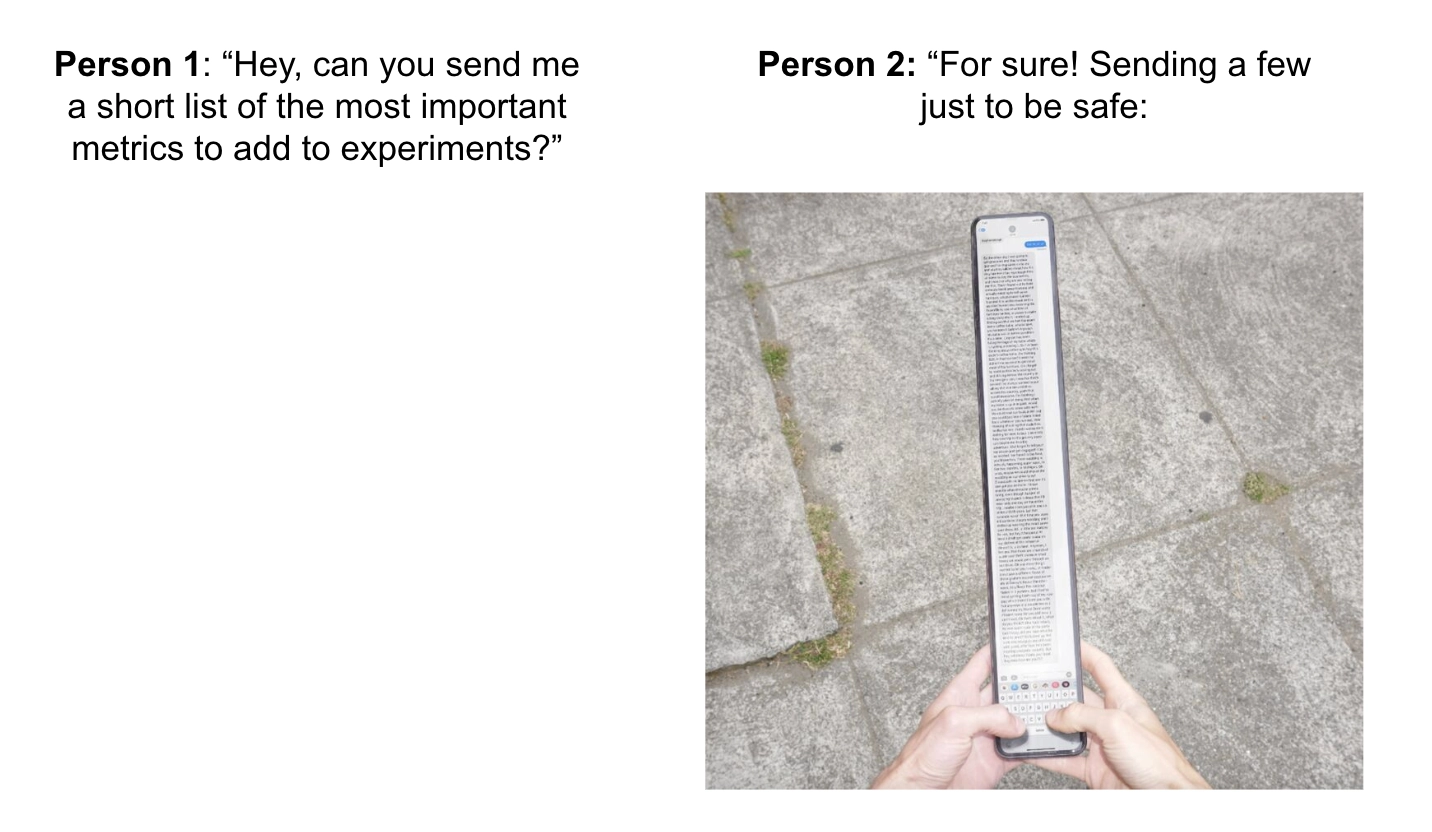
Person 1 asks for a short list of important experiment metrics. Person 2 replies, 'sending a few just to be safe,' next to a photo of a comically elongated phone displaying a massive wall of text.

This urge is real, but having too many metrics brings a new set of issues. Beyond higher compute costs and a harder time navigating experiment readouts, having more metrics highlights an inherent tradeoff:

  • Leaving p-values as-is has the potential for too many false positives. For example, if you have 100 metrics and set a 5% p-value threshold for statistical significance, 5 of your metrics are going to be statistically significant just by random chance.
  • Adjusting p-values using a multiple hypothesis correction can result in fewer false positives, but worse recall in detecting real changes. In this situation, ”Recall” is defined as the proportion of true positives that we catch.

In this article, we explore our journey to address this issue and show that there is no One Fancy Statistical Method™️ to get around this. The best solution is to use fewer, high-quality metrics that capture distinct concepts.
The Multiple Comparisons Problem

In Discord's experiments, we apply a Benjamini-Hochberg (BH) correction to control false discovery rates. BH is one of many approaches to handle the multiple comparisons problem. As more metrics are added to an experiment, the likelihood of a false alarm increases, meaning higher likelihood of at least one metric being flagged as significant by chance alone.

Benjamini-Hochberg keeps the false discovery rate (FDR) at or below 5%, regardless of how many metrics are in the pool. It does this by making individual metrics harder to flag as statistically-significant.

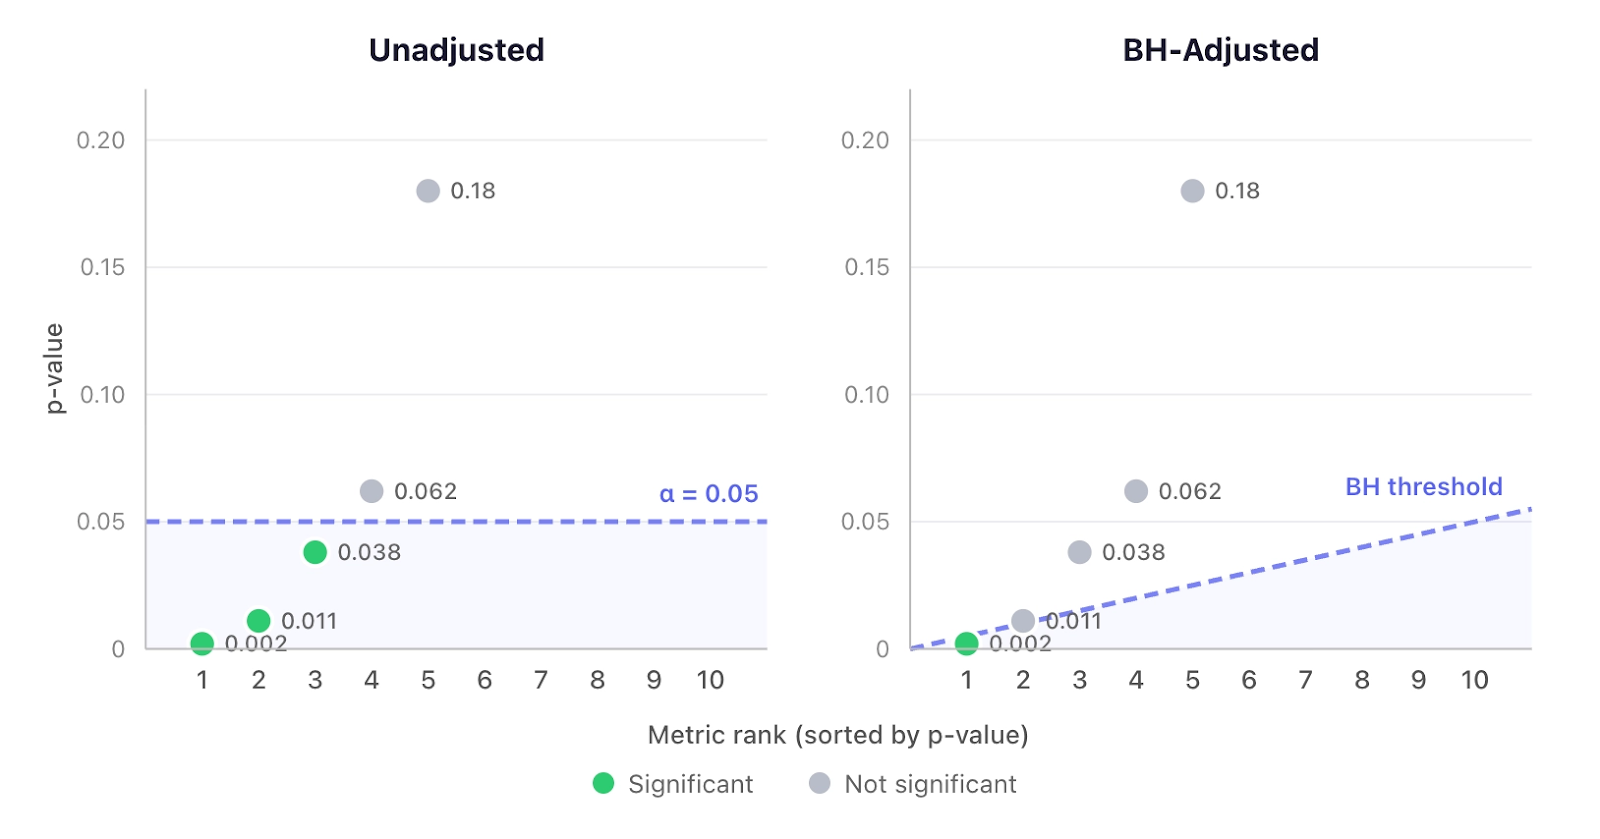
In the following example, the metric with an unadjusted p-value of 0.038 would be statistically significant when left as is, but not when its p-value is adjusted:

Side-by-side plots of five metrics ranked by p-value. Left: unadjusted, with three metrics below the flat alpha equals 0.05 threshold flagged as significant. Right: BH-adjusted, with a sloped threshold line that only the lowest p-value (0.002) clears

BH ranks metrics by their p-values in ascending order, as seen on the x-axis labeled “metric rank.” It then compares each p-value against a threshold that increases with rank. For each metric, this threshold is i × α / n, where i = rank, α = significance level (0.05), and n = number of metrics. A metric is flagged as significant if its p-value falls below its rank-specific threshold, indicated by the sloped, dashed line.

Without prior knowledge of which metrics are likely to move, BH treats all metrics the same. It has no way to allocate stricter or looser thresholds based on how likely each metric is to reflect a real change. Bayesian methods could help here, but we aren’t opening that can of worms today. (Although the team is fond of Bayesian statistics, our default statistics engine is frequentist. More on Bayesian approaches below!)

Benjamini-Hochberg keeps the false discovery rate low by making individual metrics harder to flag, but this comes at a cost to recall. In other words, we might be over-correcting and concealing real movements. With p-value adjustments, false alarms become less common (woo!), but genuine changes are harder to detect (boo!). 

The best way to improve recall without causing too many false alarms is by analyzing fewer metrics.

Seeing for Ourselves

Through most of its history, statistics has been taught using closed-form formulas derived from probability theory. Perfect reading material when you want to fall asleep at night. Lucky for us, it's now easy to run simulations and see how things actually unfold under different scenarios. Rather than taking statistical theory at face value, we wanted to see for ourselves how these numbers play out.

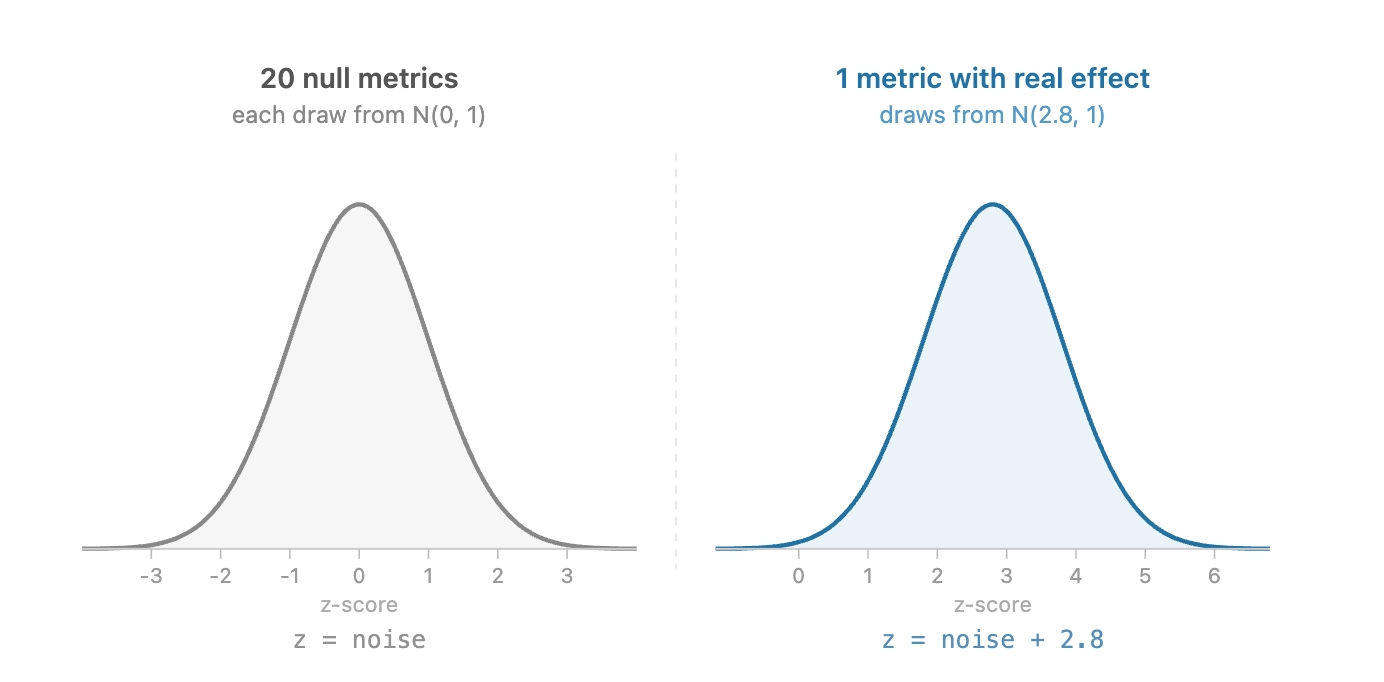
In our case, we simulated 50,000 experiments with a known effect and a fixed number of metrics. For each of 20 metrics, we drew a random noise value from a normal distribution centered around zero (μ = 0, σ = 1) to capture natural variation. One metric has a true effect of z = 2.8 (-5.2%), which matches a real change observed in a past experiment. For that metric, we drew from a normal distribution centered around 2.8 and added similar noise:

Two normal distributions side by side. Left: 20 null metrics drawn from N(0, 1), centered at zero. Right: one metric with a real effect drawn from N(2.8, 1), shifted well to the right

We also ran simulations across different metric counts to understand the relationship between the number of metrics in an experiment and how that impacts the false alarm/recall tradeoff. For each simulated experiment, using the typical p-value threshold of α = 0.05, we can answer:

  1. Did any null metric falsely flag? Or, were any of the first 20 "no effect" metrics' p-values less than 0.05?
  2. Did the real effect get flagged? In this case, the ”real effect” metric’s adjusted p-value is less than 0.05.

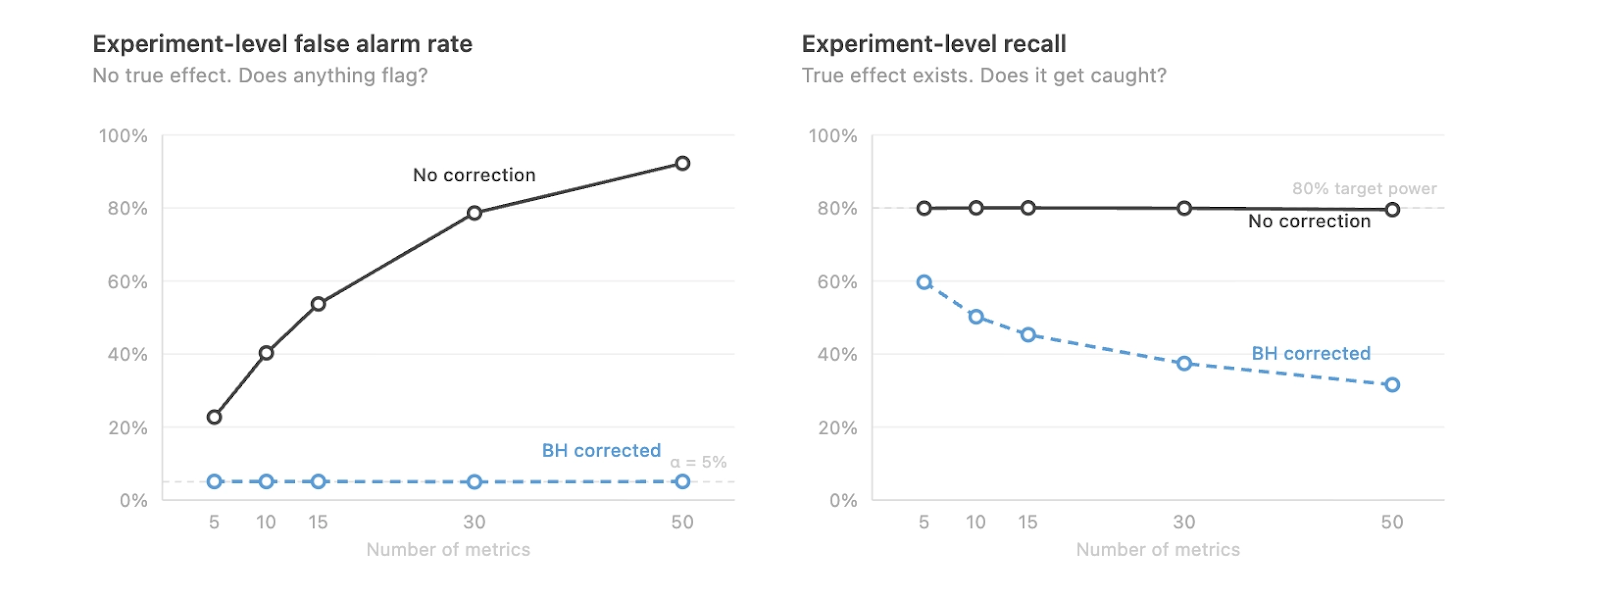
Below is the false alarm rate and recall across different numbers of metrics. This is also based on 50,000 simulated experiments, where one metric has a real effect, and the remaining metrics do not.

Two line charts. Left: experiment-level false alarm rate climbs from about 23% at 5 metrics to 93% at 50 without correction, while BH holds it flat near 5%. Right: recall stays at 80% without correction, but drops from roughly 60% to 30% under BH as metrics increase from 5 to 50

There is a clear pattern: more metrics in the experiment means a stricter correction needs to be made, leading to worse recall under BH. In addition, the uncorrected false alarm rate grows increasingly high with more metrics. 

Reducing the number of metrics that get automatically added to every experiment puts us in a stronger position on both fronts.

Choosing Metrics for Removal

In 2024, we first started implementing our “less is more” metric strategy by standardizing based on 7-day lookback windows (7d). This helped clean up the different windows across 1-day, 14-day, and 30-day timeframes and was a step in the right direction, but the core problem remained: we needed to cut back on metrics measuring overlapping behaviors. This raises the question: which metrics should be removed?

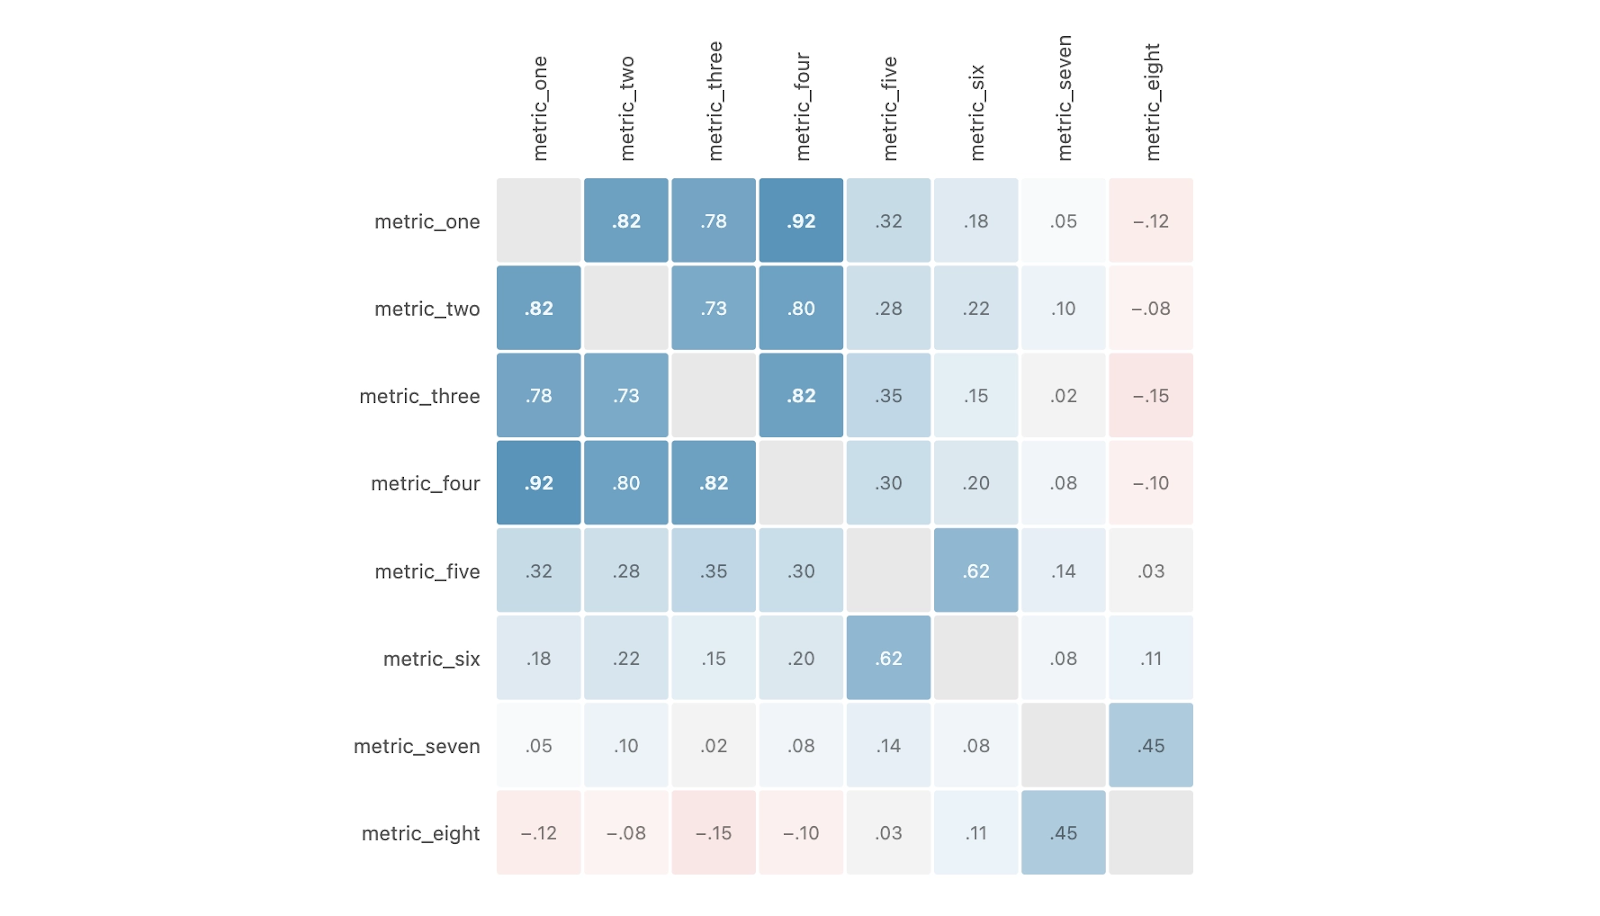
To figure that out, we first calculated treatment effect correlations across our recent experiments to see which metrics tended to move in a similar direction across experiments.

Below is an example with eight illustrative metrics:

Eight-by-eight correlation matrix with values ranging from negative 0.15 to 0.92. Metrics one through four form a highly correlated block (0.73 to 0.92), while metrics seven and eight show weak or negative correlations with the rest

A few of these pairs, such as metric_one and metric_four, are highly correlated, which is common when metrics measure related concepts. They’re good candidates for consolidation without losing meaningful signal, as consolidating here benefits every other metric in the pool. Fewer metrics means a less aggressive BH adjustment, making it easier to detect real effects in the metrics we do include.

Correlations tell us which pairs of metrics move together, but what we really want to know is how redundant the full set of metrics is. How many truly independent things are we measuring?

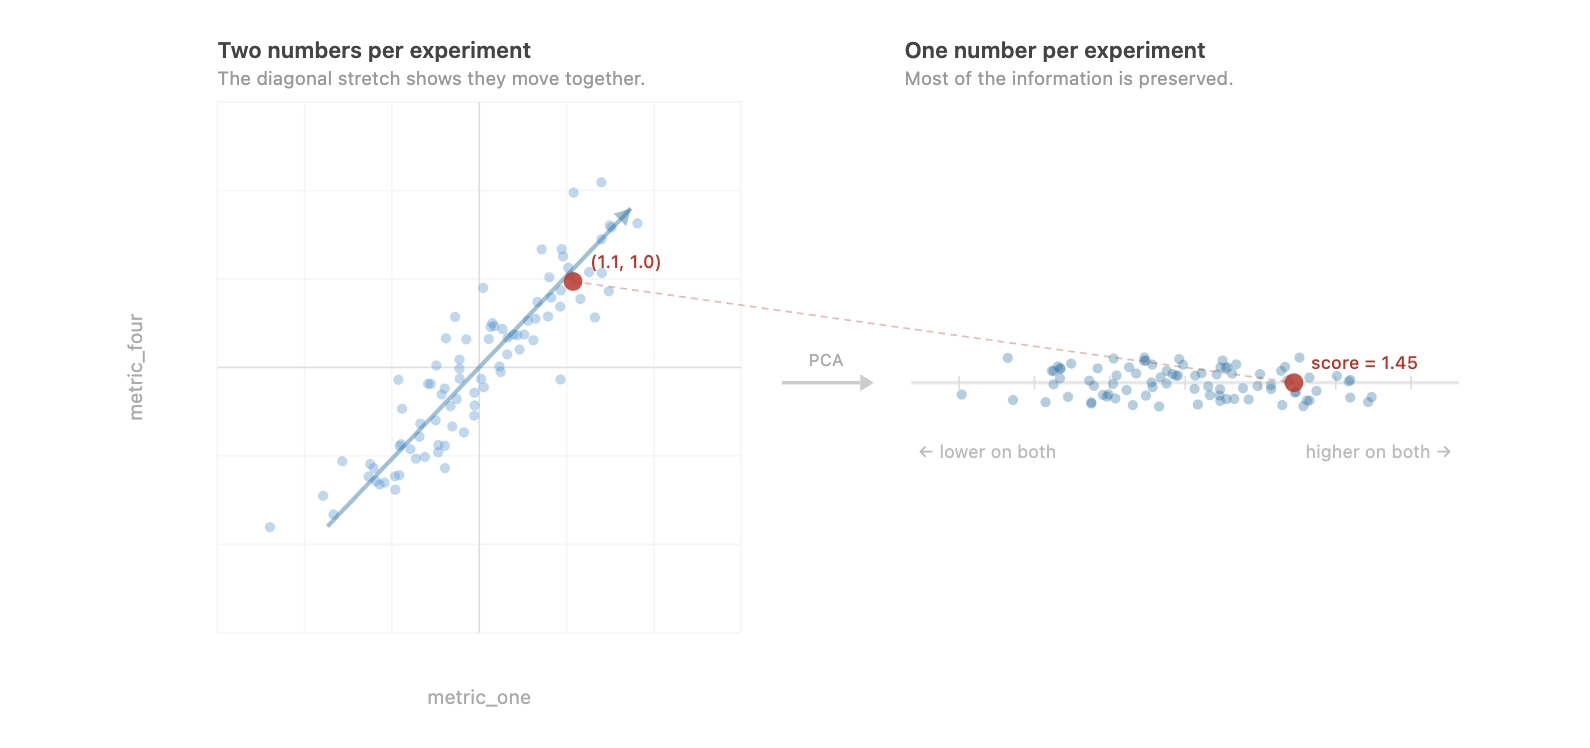
We found that Principal Component Analysis (PCA) can be a helpful tool here. Much has been written about PCA, but at a high level, PCA can help us reduce dimensionality and find the directions in which data varies the most. If we have two metrics that largely move together, PCA will show that most of the variation can be captured when projecting onto a single axis:

Left: scatter plot of metric_one vs. metric_four showing a tight diagonal relationship, with a highlighted point at (1.1, 1.0). Right: PCA collapses both into a single axis, projecting the same point to a score of 1.45

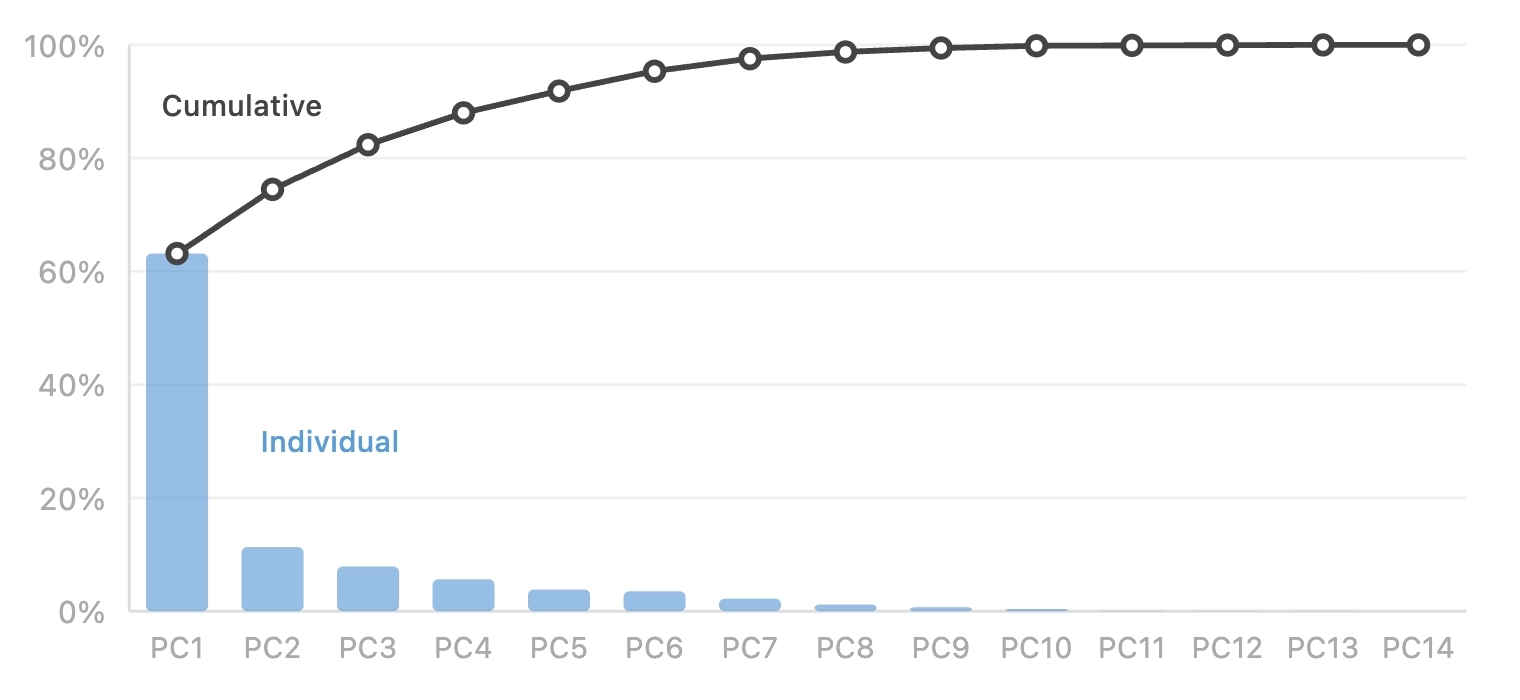
When running Principal Component Analysis on our historic experiment data, we found that a large proportion of variance (y-axis) was captured by only a few components:

Bar-and-line chart across 14 principal components. PC1 alone explains about 63% of variance. The cumulative line reaches roughly 75% by PC2 and 95% by PC7

This strengthened our original hypothesis: many of our engagement-related metrics, for example, collapsed onto one component, suggesting they measured a similar concept.

Metric correlations and PCA did not tell us exactly what to cut, but they surfaced redundant metrics for discussion with owning teams, who added business context to inform which ones to keep. These findings reassured us that many of these metrics could be removed without a substantial loss of signal of what’s important to the organization. The balance between coverage and recall is hard to quantify, but these findings provided confidence to move toward fewer, higher-quality metrics.

Moving Forward

Of course, the journey here is never over. We’ve been exploring ways to push this work forward and have a few approaches in mind: 

Empirical Bayes

While teams can already analyze experiments with Bayesian methods, our internal tooling defaults to using uninformative priors. We’re looking into using Empirical Bayes to help estimate more informative priors from past data, assigning higher prior probability to metrics that have historically shown real effects, raising recall without inflating false discovery rates.

Automated redundancy detection

Rather than periodic manual audits, we could consider automating the analyses above to flag metrics that have become redundant as behavior evolves, keeping our overall pool lean as we go.

Further consolidation

There’s room to consolidate even further by using composite measures, the idea behind an "Overall Evaluation Criterion" (OEC) as described in Chapter 7 of Trustworthy Online Controlled Experiments (Kohavi, Tang, Xu). With a small enough number of default metrics, we could eventually drop p-value adjustments altogether, leading to even better recall.

Mountain peak under a starry sky with the text: 'I didn't have time to write you a short list of experiment metrics to capture distinct dimensions of behavior, so I wrote you a long one.'

All told, we were able to cut our default set of metrics from ~50 to ~15 by collapsing platform-level breakouts into parent metrics and removing engagement metrics that were largely measuring the same thing. This improved our ability to catch a real, moderate-sized effect by ~45%!

We hope our experience here serves as a reminder to all that casting a wider net comes at a cost. Teams should aim to use the smallest number of metrics to capture what matters. In a time when adding more becomes increasingly easy—more metrics, more lines of code, more words—there’s value in choosing what not to measure.

If you’d like to read more engineering stories like this, explore the Engineering & Developers section of the Discord Blog! Or, if you want to help us tackle some of these challenges, we’d love to have you join us. Explore our Careers page periodically, as openings pop up all the time!

Jake Mainwaring

Senior Data Engineer at Discord. Focused on experimentation, metrics pipelines, applied ML, and causal inference methods.‍

related articles