惯性聚合 高效追踪和阅读你感兴趣的博客、新闻、科技资讯
阅读原文 在惯性聚合中打开

推荐订阅源

阮一峰的网络日志
阮一峰的网络日志
IT之家
IT之家
H
Heimdal Security Blog
Jina AI
Jina AI
宝玉的分享
宝玉的分享
博客园 - 【当耐特】
让小产品的独立变现更简单 - ezindie.com
爱范儿
爱范儿
T
Tailwind CSS Blog
OSCHINA 社区最新新闻
OSCHINA 社区最新新闻
Apple Machine Learning Research
有赞技术团队
有赞技术团队
酷 壳 – CoolShell
酷 壳 – CoolShell
WordPress大学
WordPress大学
AWS News Blog
AWS News Blog
C
Cisco Blogs
Cisco Talos Blog
Cisco Talos Blog
钛媒体:引领未来商业与生活新知
钛媒体:引领未来商业与生活新知
freeCodeCamp Programming Tutorials: Python, JavaScript, Git & More
D
Darknet – Hacking Tools, Hacker News & Cyber Security
The Hacker News
The Hacker News
The Cloudflare Blog
Hugging Face - Blog
Hugging Face - Blog
cs.CL updates on arXiv.org
T
Threatpost
S
Securelist
P
Privacy International News Feed
C
CXSECURITY Database RSS Feed - CXSecurity.com
博客园 - 聂微东
博客园 - 叶小钗
J
Java Code Geeks
V
V2EX
博客园 - Franky
Spread Privacy
Spread Privacy
K
Kaspersky official blog
C
Cyber Attacks, Cyber Crime and Cyber Security
Simon Willison's Weblog
Project Zero
Project Zero
大猫的无限游戏
大猫的无限游戏
S
SegmentFault 最新的问题
C
Cybersecurity and Infrastructure Security Agency CISA
C
CERT Recently Published Vulnerability Notes
Latest news
Latest news
NISL@THU
NISL@THU
罗磊的独立博客
W
WeLiveSecurity
Google DeepMind News
奇客Solidot–传递最新科技情报
奇客Solidot–传递最新科技情报
博客园_首页
V
Visual Studio Blog

Discord Blog

Making It Easier Than Ever to Connect with Friends in League & VAL! Every Voice and Video Call on Discord Is Now End-to-End Encrypted How to Link Discord to Battlefield 6, Marvel Rivals & More Official Discord Integrations for Steal a Brainrot, Grow a Garden, Brookhaven RP, and more Celebrate Discord’s 11th Birthday with an Exclusive Set of Emoji and Wallpapers Nitro Now Comes with Xbox Game Pass and New Benefits. Welcome to Nitro Rewards. How to Use Nitro: A Beginner’s Guide to Discord’s Premium Subscription Stock Up in the New Rust Shop! Enjoy a Discord-Only 20% Sale on Most Items until 5/21 How Discord Automates ScyllaDB Clusters at Scale Discord Patch Notes: May 4, 2026 You’ve Got (Too Much) Mail: Behind the Scenes of the 3/25/26 Voice Outage Measure Less to Learn More: Using Fewer, Higher-quality Metrics to Capture What Matters Discord Patch Notes: April 6, 2026 MULTIPLAYER SEQUEL TO ACCLAIMED AAAA GAME “THE LAST MEADOW” ANNOUNCED: PLAYABLE NOW Making Discord on Desktop Look Just Right: Display Settings to Ease the Eyes Discord Patch Notes: December 8, 2025 Building on the Social Layer of Games: What’s New from GDC 2026 Gift Ideas for the Dedicated Discord User in Your Life Discord Update: November 6, 2025 Changelog During October, Treat a Friend to Nitro and Trick Out Your Profile for Halloween 🎃 Discord Social SDK Updates & Integrations Go Beyond, Plus Ultra! with the My Hero Academia Collection STAR WARS™ Makes Its Way to Discord Worthy of a Plaque: Nameplates Land in the Shop Announcing Discord’s Social SDK, Helping Power Your Game’s Social Experiences A Cornucopia of Updates Make Discord on Desktop Fresher Than a Crisp Fall Breeze Starting Your First Discord Server Transforming Game Discovery with Instant Play Experiences on Discord Introducing the Discord for Business Newsletter, Vol. 1 Discord Update: March 24, 2026 Changelog Discord Update: December 19, 2024 Changelog How Multi-Factor Authentication Helps Keep Your Discord Account Safe How ROOST is Advancing Online Safety You’re Now Discord Official: Developers, Claim Your Game and Verify Your Server Discord Patch Notes: March 6, 2026 Getting Global Age Assurance Right: What We Got Wrong and What's Changing Discord Patch Notes: February 4, 2026 Osprey: Open Sourcing our Rule Engine How to Change Your Theme to Bring Your Vibe to Discord Your Discord Checkpoint is Rolling Out! Celebrate What You Did in 2025 How to Customize Your Discord Profile How to Make and Use Custom Emoji on Discord Save and Display Your Faves: Add Discord Shop & Marvel Rivals Items to Your Profile’s Wishlist Discord Patch Notes: November 4, 2025 Bringing In-Game Commerce to Discord Communities Reward Your Play: Complete Quests. Earn Orbs. Get Sweet Stuff. How to Share What You’re Playing, Listening to, or Watching as Your Status on Discord Staff Picks, September 2025: Welcome to Our Video Game Museum From Single-Node to Multi-GPU Clusters: How Discord Made Distributed Compute Easy for ML Engineers Discord Patch Notes: October 7, 2025 Discord Update: September 25, 2025 Changelog New Looks for Nitro, New Looks for You. Get Yourself a Nitro-exclusive Profile Bundle! Discord Patch Notes: September 3, 2025 Bringing DAVE to All Discord Platforms Discord’s Powerful Cross-Platform Chat: Ready for Your Game Introducing the Community Server Cleanup Report for August 2025 Discord for Business Vol. 2: Cannes-worthy ad product updates Discord Patch Notes: August 4, 2025 ROOST Announces “Coop” and “Osprey”: Free, Open-Source Trust and Safety Infrastructure for the AI Era *FLAILS AROUND* SUMMER SPECIAL! JOIN NITRO, GET AN EXTRA MONTH OF NITRO ON US! Get More From Your Boosts With New Server Perks Discord Patch Notes: July 7, 2025 Discord Update: June 30, 2025 Changelog Authenticity Matters: Discord's Pride Month 2025 Staff Picks, June 2025: Summer of Showcases How to Set Up Your Server’s Roles for Members, Mods & Admins Gift Nitro and Earn A Flavorful Splash for your Avatar Discord Patch Notes: June 3, 2025 How to Use the Discord Soundboard & Add More Sounds Checkpoint 3: Leveling Up Discord Quests with Orbs and Advanced Measurement Thank You for Ten Years Staff Picks, May 2025: The Games That Brought Us to Discord Discord Patch Notes: May 1, 2025 How Discord Indexes Trillions of Messages Passing the Torch Discord Appoints Humam Sakhnini as Chief Executive Officer Staff Picks, April 2025: All The Adaptations Make More Closet Space! Nitro Members Can Now Keep Avatar Decoration Quest Rewards for Longer How to Use Discord’s In-Game Overlay to Talk While Playing on PC The Game Developer Playbook, Part One: Getting Started on Discord The Game Developer Playbook, Part Two: Early Access and Pre-Launch MAJOR NEWS: DISCORD ANNOUNCES ITS FIRST IN-HOUSE AAAA VIDEO GAME, “THE LAST MEADOW” Overclocking dbt: Discord's Custom Solution in Processing Petabytes of Data Wicked Saints Turns Players into IRL Superheroes with the Help of e.l.f. Beauty and Discord Discord Update: March 25, 2025 Changelog How to Stream Games and Applications to Discord from Desktop or Mobile Discord Patch Notes: April 3, 2025 Checkpoint 2: Our First Year With Discord Quests How to Create & Upload Your Own Stickers on Discord Revamped Overlay & Refreshed Desktop Give Game Time a Boost Discord Announces First Mobile Ad Format, Broadening Advertising Opportunities Announcing Discord’s Social SDK, Helping Power Your Game’s Social Experiences The Game Developer Playbook: Three Incredible Game-Focused Communities Modern Image Formats at Discord: Supporting WebP and AVIF Discord Patch Notes: March 11, 2025 Supercharging Discord Mobile: Our Journey to a Faster App December Staff Picks: It’s Giving Games Discord Patch Notes: February 3, 2025 Leveling Up Black Voices in Gaming How Discord Seamlessly Upgraded Millions of Users to 64-Bit Architecture
Tracing Discord's Elixir Systems (Without Melting Everything)
Nick Krichevsky · 2026-03-09 · via Discord Blog

Nine turnips and a pickaxe, aligned in a 5x2 grid.

At Discord, we want the experience of chatting with your friends, reacting to a message, or posting artisanal farm-to-channel memes to feel instantaneous. We’ve managed to achieve this at scale by leveraging Elixir’s powerful concurrency mechanisms to run each Discord server (which we call a “guild” internally) fully independently from one another. 

Sometimes though, things go wrong, and a guild can’t keep up with its user activity. When this happens, the guild will feel laggy or possibly experience a complete outage. If the system degrades beyond the point it can self-heal, an on-call engineer has to intervene. Afterwards, they turn to our observability tools to understand the cause and how to stop it from recurring.

Our on-call engineer’s investigation begins by looking at metrics and logs. We have a wide array of instrumentation, including measurements of how frequently we process each user action type and how long processing takes. These often provide useful hints about bursty activity, like a flurry of hype and reactions on that sweet new game that just got shadow-dropped, but even if we find an inciting event, it’s tricky to gauge what the experience was for users. Think of it like your car’s dashboard: it can tell you what the engine temperature is, but not the consequences of it running hot.

If that doesn’t yield results, the on-call engineer turns to our custom-built tool called “guild timings.” Every time a guild processes an action, it records how much of the current minute has been spent on each action type to an in-memory store. This data is much more detailed than our metrics, but it’s emitted at such a high volume that we can’t feasibly store it all. As such, this data is rotated frequently for all but our largest guilds. Even if we retrieve the data in time, it still won’t give us a good picture of the end-to-end experience, as it doesn’t capture downstream effects.

Other teams at Discord have derived enormous value from utilizing distributed tracing (a.k.a. Application Performance Monitoring), which allows them to see how long the constituent parts of an operation took. Adding tracing to our Elixir stack took a bit of work, though. Most tracing tools work by passing information about the operation via metadata layers like HTTP headers, but Elixir’s built-in communication tools don’t have an equivalent layer out of the box. 

So… we had to build our own. Despite the fact that we were changing how our services communicate with one another, we managed to integrate it without downtime.
Setting the Stage: Elixir at Discord, and Tracing

Elixir, and How it Powers Discord

Whenever you do something on Discord, your action turns into a “message” in our Elixir stack, which is then forwarded to connected clients. Elixir programs consist of lightweight processes (scheduled by the runtime, not the OS) that communicate via message passing, making concurrent programming a breeze. This model allows us to trivially distribute our programs across many nodes, too.

Processes are the building blocks of Discord’s architecture. Every guild runs as an Elixir process that uses message passing to fan out actions to all connected “sessions”; each session is itself an Elixir process that forwards actions to clients. Therefore, when we talk about a user action flowing through the Elixir stack, we’re actually talking about the act of messages being passed between processes. 

To capture an end-to-end performance story, we needed a solution that allows us to follow a particular message’s path throughout the system, which is precisely what tracing provides us. 

A Gentle Introduction to Tracing

When a user sends a Discord message, their client sends it over HTTP to our API service, which records it in the database and sends it to the Elixir stack via gRPC. As the API service processes the message, its tracing library times each step and records the measurements in a way that lets us visualize how each step affected overall execution. 

Each region of code timed by a tracing library is called a span. Every time a span starts, the library links it to the currently active one (if any), building a tree of nested spans. This tree forms a trace, which we can use to see a timeline of events during execution.

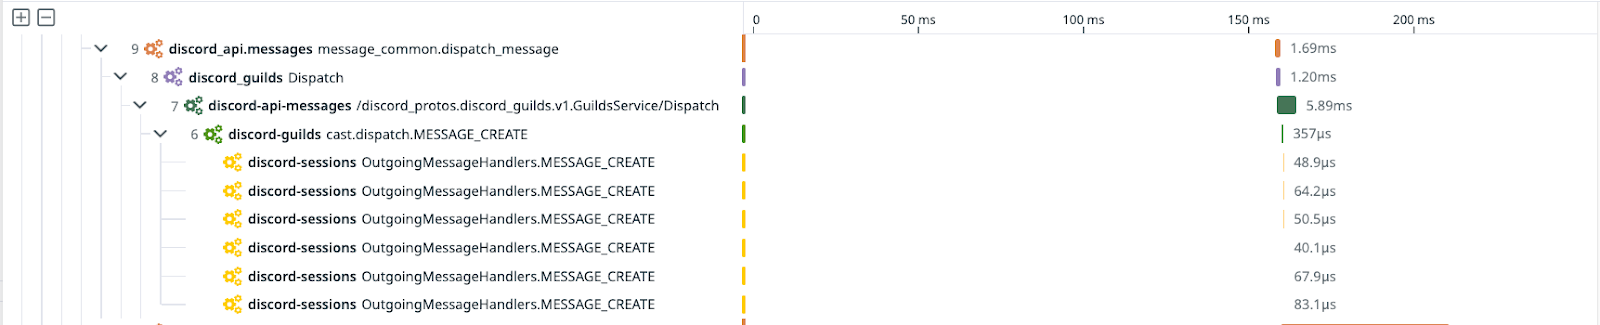
Below is part of a trace from someone sending a message on Discord. As discord_api processed the message, it recorded a span called message_common.dispatch_message that took 1.69 ms. It then sent the message to discord-guilds, which spent 357 μs fanning it out to discord-sessions. From there, each session recorded its own span while forwarding the message. All these spans linked together form our complete trace!

A trace from Discord’s Python API, with the spans generated from broadcasting (“dispatching”) a user’s message. Note: discord-guilds represents the actual guilds service, while discord_guilds is an RPC client in the API service. 

A trace from Discord’s Python API, with the spans generated from broadcasting (“dispatching”) a user’s message. Note: discord-guilds represents the actual guilds service, while discord_guilds is an RPC client in the API service.

While the final structure can look complex, spans are quite simple to record in code. If you’ve ever written code like this, you’ve effectively created spans!

def dispatch_message():
  start_time = time_ms()
  # ...
  print(f"dispatch_message took {time_ms() - start_time} ms")

A tracing library will handle a lot of the details for you, including managing timers, tracking their results, and even uploading them to your observability provider. Here’s how we’d convert our snippet to use one:

def dispatch_message():
  start_span("dispatch_message")
  # ...
  end_span()

Most tracing libraries track the current span and trace in some kind of global state. As new spans are created, the library checks this state and marks the current span as the new span’s parent. This global state is called context, and it is the critical link that allows us to build traces that span multiple services (no pun intended). When discord_api interacts with discord-guilds, it passes an encoded version of the context in the gRPC headers, allowing discord-guilds to link any spans it generates to discord_api's trace.

This technique is extremely powerful. The resulting traces not only show the exact duration of each step, but also how execution flows. For example, the trace shown above shows us that discord-guilds broadcasts the user’s message asynchronously from discord_api’s dispatch_message. This example is pretty obvious from the code, but in other cases, traces can help identify unexpected bottlenecks, like code you expected to run in parallel running serially.

Getting Started with Tracing Elixir

We decided to use OpenTelemetry’s Erlang/Elixir library to instrument our stack. Adding spans to our Elixir services was relatively straightforward: wrap key operations in calls to with_span, configure the library to report to our observability provider, and we’re done! This gave us spans within a single service, which was extremely useful on its own, but didn't yet give us a clear picture of downstream operations.  

To gain these end-to-end insights, we had to propagate trace context between services. As mentioned earlier, the API service already passed this context to the guilds service in gRPC headers. Linking with the API service’s spans just required pointing OpenTelemetry at the headers. Easy peasy! 

Things were less simple for calls between our Elixir services. Elixir processes can send arbitrary messages to each other, but that arbitrary message is all that gets sent. In other words, there’s nowhere to stick metadata, like our trace context, unless it’s a part of the message itself. Capturing all steps of an operation requires that the trace context be attached to every message, but encoding it manually would be unwieldy and error-prone. We needed to develop a new solution.

Prototyping potential solutions revealed a few requirements:

  1. Sending and receiving messages that include trace context must be ergonomic and require as little additional code as possible. If developers need to think about packing or unpacking the trace context, it won’t be adopted for future code.
  2. The solution must work equally well for plain messages and for GenServer operations (a common abstraction over message passing). We use both at Discord.
  3. We must be able to integrate the solution into our systems as part of our normal deployment process. Downtime to change the communication mechanism isn’t acceptable, so we need to support toggling it at runtime during rollout. 

With these requirements in hand, we built Transport: our internal message passing library. It’s an incredibly simple library, so I want to share as much of its design here as possible; buckle in, we’re gonna read some code!

Adding Metadata to our Messages with Transport

Transport introduces a new primitive to our Elixir stack: the Envelope. Whenever a service sends a message with Transport, the message is wrapped in an Envelope, and any extra metadata is attached to it. This primitive, plus a few small helper functions, gives us exactly what we need to fulfill our three requirements.

  1. Transport exposes two functions, wrap_message and handle_message, which will wrap or unwrap a message in an Envelope and handle trace context propagation.
  2. Transport provides drop-in replacements for GenServer’s call and cast functions (which provide request-response and fire-and-forget semantics, respectively) that similarly wrap messages before performing the call or cast.
  3. An application is free to mix calls to GenServer functions with calls to Transport functions; handle_message will handle messages sent by both. This gave us the freedom to add runtime configuration options to control which mechanism each service used, allowing for a gradual, zero-downtime rollout.

Integrating Transport into a service is pretty straightforward. Services add handle_message into their GenServer’s handle_call/handle_cast/handle_info callbacks to automatically unpack Envelopes and extract trace context before proceeding with message handling. 

Here's what it looks like in the guilds service:

defmodule DiscordGuilds.Guild do
  alias Discord.Transport
  alias Discord.Transport.Envelope
  require OpenTelemetry.Tracer

  use GenServer

  # ...

  def handle_call(message, from, state) do
    Transport.handle_message(message, fn %Envelope{message: message} ->
        span_name = span_name(:call, message)

        OpenTelemetry.Tracer.with_span span_name do
          do_handle_call(message, from, state)
        end
    end)
  end

  # handle_cast/handle_info follow nearly identical implementations
  
  # ...
end

The Envelope structure powering this API is shockingly uncomplicated. Here’s the entire definition, omitting a couple of bells and whistles we’ve added in for optimizations (oooooo spooky foreshadowing).

defmodule Discord.Transport.Envelope do
  @enforce_keys [:message]
  defstruct [
    :message,
    trace_carrier: []
  ]

  def wrap_message(message) do
    %__MODULE__{
      message: message,
      # Captures the active context from global environment
      # (the "process dictionary" in Elixir terms)
      trace_carrier: :otel_propagator_text_map.inject([])
    }
  end
end

When a caller passes a message to wrap_message, it’s wrapped in an Envelope, and a serialized version of the active trace context (if any) is added to the trace_carrier field. This Envelope can be sent to other processes without any additional processing.

Processes that receive an Envelope need to unpack its trace context so they can continue the trace, and then process the message. However, not all messages a process receives will be wrapped in an Envelope; messages can still be sent by code that doesn’t use Transport! 

To solve this, the handle_message function accepts any message and normalizes it, wrapping plain messages in metadata-less Envelopes or passing through messages already wrapped in one. Afterwards, it unpacks the trace context (if any), calls a user-provided handler with the Envelope, and then cleans up the context.

This normalization technique was critical for our rollout. Our Elixir services use plenty of message passing, and we couldn't change all of them to use this new scheme overnight. Even if we could, we can’t apply new versions to all nodes instantaneously when we deploy services. Therefore, services needed to handle messages from both old and new versions, including ones that didn't use Transport.

defmodule Discord.Transport do 
  alias Discord.Transport.Envelope

  def handle_message(%Envelope{} = envelope, func) do
    # Elixir trick: we do this dance to make sure that all fields are present
    # on the received Envelope if we receive it from another version of
    # software (provided no required fields are added).
    envelope = struct(Envelope, Map.from_struct(envelope))

    # Extract the context
    ctx_token = :otel_propagator_text_map.extract(envelope.trace_carrier)

    result = func.(envelope)

    # Tear down the context when we’re done
    OpenTelemetry.Ctx.detach(ctx_token)

    result
  end
  
  def handle_message(other, func) do
    func.(%Envelope{message: other})
  end

  def call(destination, message, timeout \\ 5000) do
    message = Envelope.wrap_message(message)
    GenServer.call(destination, message, timeout)
  end

  def cast(destination, message) do
    message = Envelope.wrap_message(message)
    GenServer.cast(destination, message)
  end
end

A small aside: you might notice we don’t provide a drop-in replacement for Elixir's send function, despite having ones for GenServer’s call and cast. Several of our services already have their own send abstractions, so we opted to add calls to Envelope.wrap_message there instead.

When One Span Becomes One Million: Tracing Extreme Fanouts

Capturing a span has a non-zero monetary cost and performance overhead. To limit this effect, teams that implement tracing often sample the operations they capture, typically by picking a flat percentage of operations (e.g. randomly selecting 1% of operations). 

The simplest strategy, and the one we employ, is called head sampling. With this approach, we decide whether or not an operation will be traced when the first span (the “root” span) starts; if it’s sampled, all child spans will be sampled, and vice versa. This sampling decision is stored in each span’s entry in the trace context.

Head sampling works great for a lot of request/response-based systems, but Discord’s fanout model means we can quickly explode the number of spans. Let’s imagine we sample someone sending a message to a guild with a million online users. The API service would capture the message creation, then the guilds service would capture the fanout, and then all one million sessions would capture forwarding the message to the client. To keep the volume manageable, we had to find a way to limit the number of spans while still capturing useful performance data.

Our first approach was to apply an additional layer of random sampling in the sessions service. If a session wasn't selected by this second layer, no spans would be captured for it, even if it was part of a sampled trace (specifically, we would set the “sampled” flag in the trace context to false). This didn’t lose us much data, since the act of forwarding a message to clients should be basically the same across all sessions in a given fanout operation. Unfortunately, this flat sampling rate was a little aggressive, and traces from smaller fanouts often lacked spans from sessions. To fix this, we decided to adjust the rate based on fanout size, which meant we'd have to somehow pass that information to sessions.

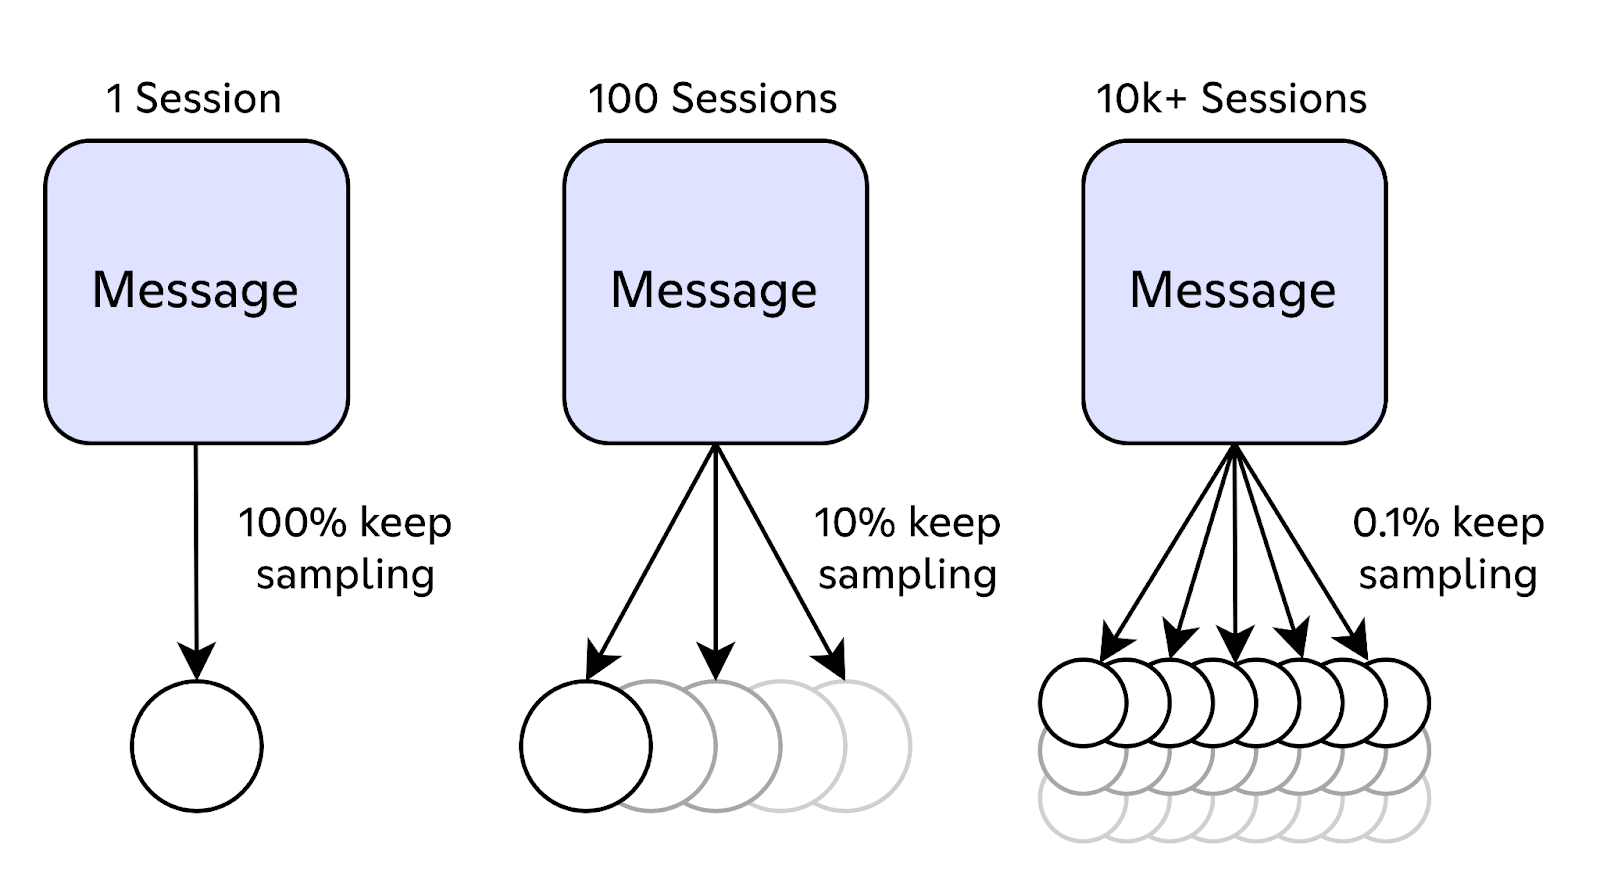
This is where our shiny new Envelope primitive came in handy. We added a new optional field to the definition, called approximate_num_recipients, which the guild sets before sending the message to sessions. Upon receiving the message, the sessions each check a lookup table to determine the rate for the second layer of sampling. Messages with a single recipient keep their sampling status 100% of the time, messages with 100 recipients 10% of the time, and so on, until we reach our final rate of 0.1% for messages with 10,000+ recipients.

A visual representation of the dynamic sampling preservation. The diagram shows that sampling is preserved 100% of the time when a message is sent to a single session, 10% of the time when fanned out to 100 sessions, and 0.1% of the time when fanned out to 10k+ sessions.

A visual representation of the dynamic sampling preservation. The diagram shows that sampling is preserved 100% of the time when a message is sent to a single session, 10% of the time when fanned out to 100 sessions, and 0.1% of the time when fanned out to 10k+ sessions.

This approach was hugely successful! We were able to get a good picture of how a fanout performed, without submitting zillions of spans to our providers.

Optimizing Overhead for Scale

Rolling out tracing to our stack gave us an immediate observability win, but instrumenting certain components added meaningful overhead. Tracing does a good job of capturing application performance, but it can't observe its own overhead; the tracer itself doesn’t capture spans about its own execution. Even if it did, such spans would generate even more overhead. We needed different tools to diagnose where the source of the problem was.

After deploying our first set of traces to the guilds service, some of our busiest guilds (we’re talking the ones with millions of members) were unable to keep up with user activity. When this happened, we captured stacktraces of the slow processes every 100 ms or so. This low-cost technique is a great way to get an idea of what a process is doing. In our case, a large share of the stacktraces showed the process unpacking trace context!

Every time we send a message with Transport that contains trace context, OpenTelemetry encodes the context as a string, which the recipient must parse to unpack. Our sampling rate was less than 1%, so more than 99% of unpacking operations just told us not to capture child spans. Could we skip unneeded work? What if we only sent the context when capturing a sampled trace?

Skipping propagation of unsampled trace contexts modified our head sampling semantics slightly, but didn’t lose traces we otherwise would have captured. It created a new problem, though: intermediate operations could no longer tell if they were part of an unsampled trace and might independently opt themselves into sampling, producing incomplete traces. This is a reasonable trade-off; we can still answer end-to-end questions by querying for traces containing spans from all services. After making this change, we didn’t see a recurrence of the guild performance problems, and we continued instrumenting more components. 

This came back to bite us when we deployed instrumentation of fanout to the sessions service. Capturing spans while forwarding messages to clients increased CPU usage by 10 percentage points. What gives? In general, capturing a span is quite cheap. Unfortunately, nothing a computer does is free, and even the cheapest operations can be time-sucks at scale. Fanouts can get quite large, so there’s bound to be a decent number of sessions that make the independent decision to start sampled traces. 

We spent a long time trying to make span capture cheaper, but eventually we asked ourselves the same question: can we just avoid doing this work? The fix was simple: if a session receives a post-fanout message, we forbid it from capturing root spans. In other words, the session can continue existing traces, but not make new ones. This single change won back nearly all of our performance overhead in the sessions service.

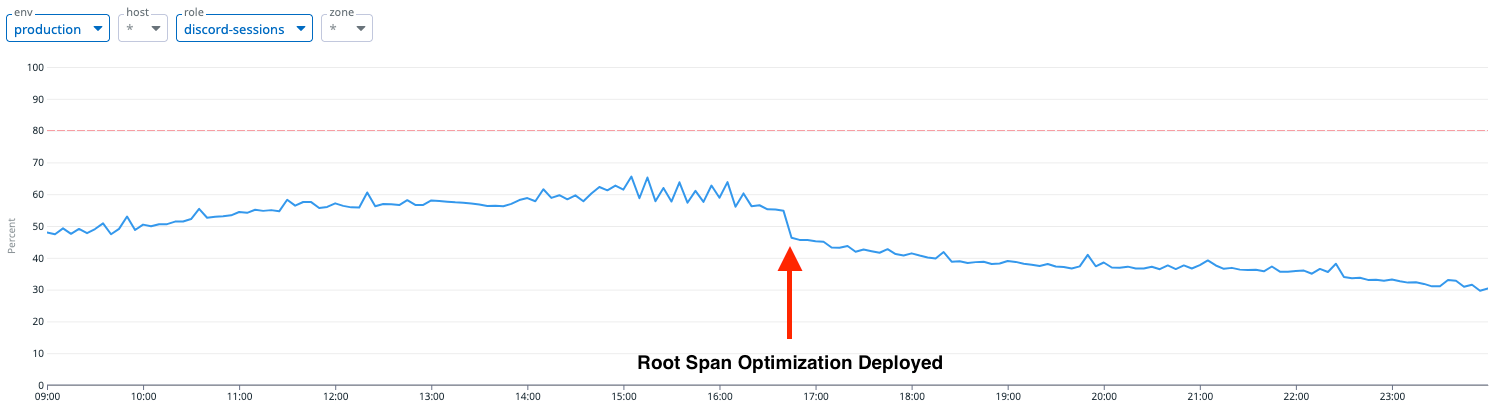
The average CPU usage of our sessions service before and after deploying the change to not capture root spans post-fanout. We saw the usage drop from 55% to 45%.

Our end-to-end picture wouldn’t be complete if we couldn’t link spans between the API service and the Elixir stack. As mentioned before, the API service already sent trace context as part of gRPC headers, so all we had to do was point OpenTelemetry at these headers. Unfortunately, doing so immediately doubled our CPU usage.

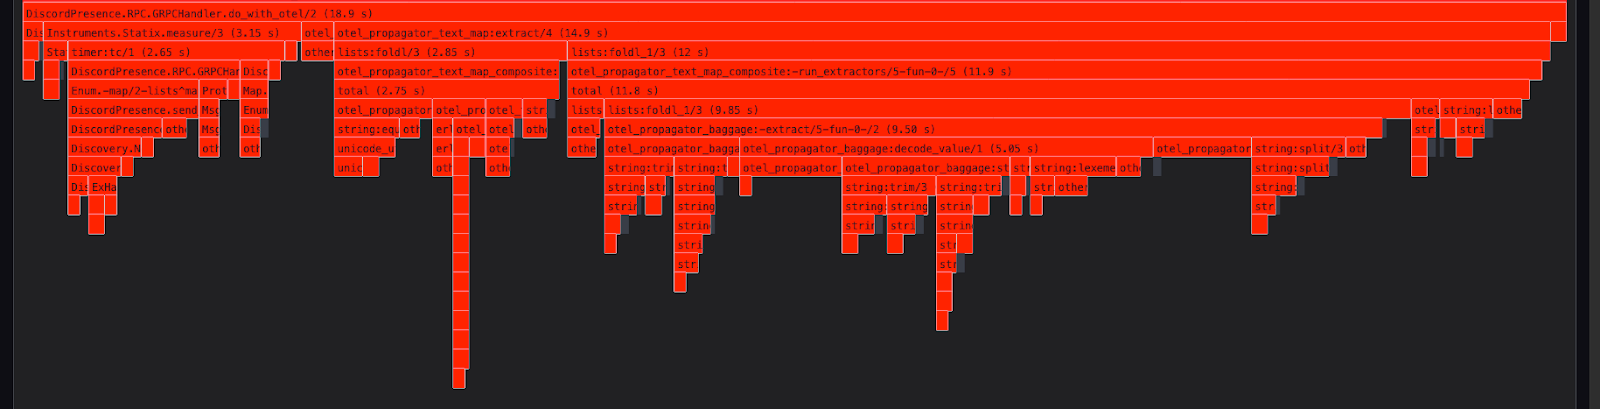
By sheer happenstance, one of the team’s engineers had just spent our annual internal Hack Week experimenting with OpenTelemetry’s (at the time, in progress) Erlang/Elixir profiler, which gives us aggregate information about how much CPU time is spent in each function (perhaps a topic for another post!). After enabling it on an affected node, we quickly saw that 75% of our time handling gRPC requests was spent unpacking context. Given our existing head sampling trade-off, could we build a sieve to avoid unpacking unnecessary trace contexts? 

The structure of the encoded version of trace context. Technically, this is just one of a few components, but we won’t discuss the others in this post.

Trace contexts are encoded as a string of several hexadecimal sections, as shown above. Importantly, the last byte of this string is a set of flags on the trace, which we can read very quickly. If the least significant bit is 1, we know the trace is sampled, and we can perform the full, more expensive, unpacking of the trace context. If it’s zero, we simply won’t pass the context along to the Elixir process. This technique brought our CPU usage to nominal levels, and we were ready to call this project done!

A profile of our gRPC request handler when handling a gRPC request in our presence service, which fans out DMs and status updates to users. Unpacking (“extracting”) the trace context is taking 14.9 traced seconds, out of 18.9 traced seconds.

Enjoying the Fruits of our Labor

Tracing has closed a large observability gap for us. We can now see what parts of the platform become slow, why they are slow, and what the downstream effects are. Integrating it wasn’t as easy as it might have been in a traditional HTTP microservice, but we found a way to do it that could survive Discord’s massive scale.

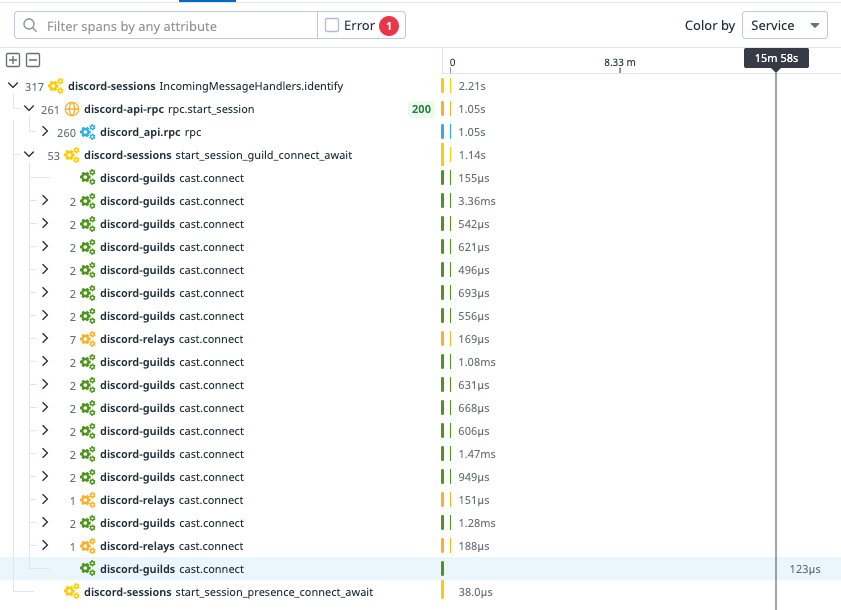
At the start of this post, we discussed how a guild can occasionally fail to keep up with its user activity. In a recent incident of this failure mode, our new tool helped us quantify the user impact. Traces from members of that guild showed us that it took almost sixteen minutes for their sessions to connect to the affected guild process. This meant that those users saw a message in their client saying that one of the guilds they’re a member of was offline due to an outage; they weren’t even able to click into the guild during that time.

A trace showing a user connecting to Discord, and experiencing a significant delay in gaining access to a degraded guild. Most guilds reported “connect” spans within a few milliseconds, but the last guild did not report one for sixteen minutes. 

This kind of session connect latency is extremely rare, thankfully, but our investment in tracing has been incredibly helpful for investigating these issues when they crop up. As we expand our instrumentation of the Elixir stack, we can continue to answer questions that we simply couldn’t before, and use the data to deliver better experiences for our users.

If you can imagine a place where talking “trace” is a perk of the work, check out our careers page from time to time! We’re always hiring!

Nick Krichevsky

Senior Software Engineer at Discord, distributed systems nerd, and all-around dork.

related articles