数据非常的重要,历史数据可以今我们分析目前的状况,为之后的决策指明了方向,而实时数据则可以帮助我们在一些场景中获得先机,譬如:监察购物降价通知。而我最近有个需求是想看看我的一些少数派文章的阅读数,评论数和充电数,在一个地方就能看到数据,可以分析那个时段最多views,什么类型的文章最符合大众口味,所以就有了这篇文章。

图示说明:
打开少数派的用户页面,F12开发者工具查看我的个人主页,这个接口返回的数据就不正确都是0,应该是服务器没有填充数据到模型。

但是在个人文章管理页面的接口是可以返回正确的数据,如下图所示:

再查看一下相关的请求是只要带JSON Web Token就可以了,然后查看了token的过期时间是一年,又因为登入是有验证机制,自动化成本就变高了,以最简单来实现就是拿登入之后的token来直接请求,设置一个提醒,到时过期再手动更换。源码地址 在此
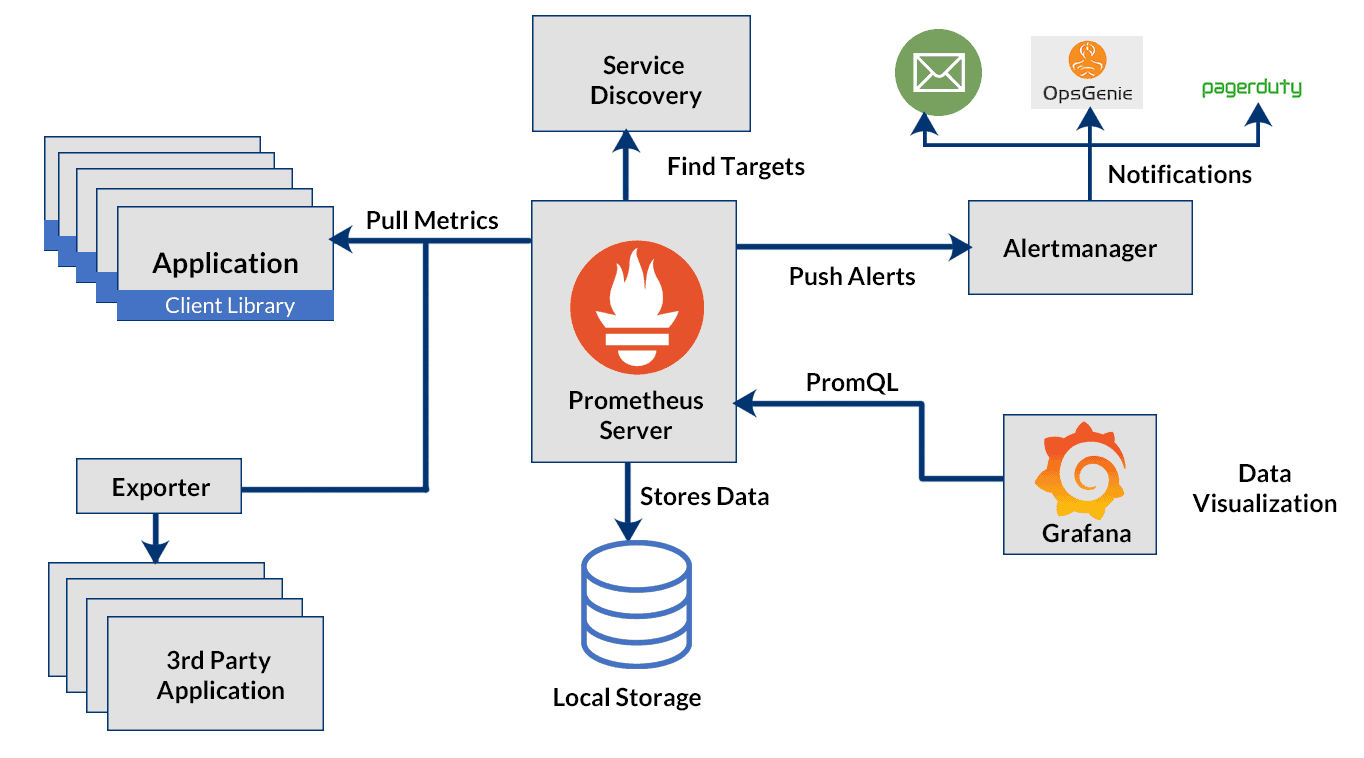
根据上个章节的说明,可得出如下图所示:
创建一个sspai-exporter的容器服务,该工具定时地通过api抓取用户的后台数据,由prometheus定时拉取,然后将数据展示到我的grafana中,可以以图表的方式看到历史数据的变化,并且在一些数据添加alert条件,譬如在文章达到一千次views的时候,发送通知我,但alertmanger没有满足我的要求,因为涉及到状态的存储,暂时先不管这部分需求,之后再想着怎么处理。

在你的服务器,NAS或本地电脑,建一个文件夹来存放相关配置文件docker-compose.yaml和prometheus.yaml。
其中docker-compose.yaml定义了各种服务的配署,内容如下:
version: '3'

# 可重用的log配置
x-common-log-conf: &common_log_conf
  logging:
    driver: json-file
    options:
      max-size: 10m
      max-file: 3

services:
  prometheus:
    container_name: prometheus
    image: prom/prometheus:latest
    volumes:
      - prometheus_data:/prometheus
      - ./prometheus.yaml:/etc/prometheus/prometheus.yml
    command:
      - '--config.file=/etc/prometheus/prometheus.yml'
      - '--storage.tsdb.path=/prometheus'
      - '--web.console.libraries=/usr/share/prometheus/console_libraries'
      - '--web.console.templates=/usr/share/prometheus/consoles'
      - '--web.enable-lifecycle'
    ports:
      - "9090:9090"
    restart: unless-stopped
    <<: *common_log_conf
  grafana:
    container_name: grafana
    image: grafana/grafana-oss:latest
    volumes:
      - grafana_data:/var/lib/grafana
    depends_on:
      - prometheus
    ports:
      - "3000:3000"
    restart: unless-stopped
    <<: *common_log_conf
  alertmanager:
    container_name: alertmanager
    image: prom/alertmanager:latest
    ports:
      - "9093:9093"
    restart: unless-stopped
    <<: *common_log_conf
  sspai-exporter:
    container_name: sspai-exporter
    image: feimeizhan/sspai-prometheus-metrics:latest
    environment:
      # 用自己的token替换下面的值`${SSPAI_TOKEN}`
      - SSPAI_TOKEN=${SSPAI_TOKEN}
    ports:
      - "4000:3000"
    restart: unless-stopped
    <<: *common_log_conf

volumes:
  prometheus_data:
grafana_data:其中,sspai-exporter是上文提到的需要填写自己的JWT即可。可以访问一下http://localhost:4000/metrics查看最后是否有相应内容,看看是否抓取成功

prometheus.yaml是prometheus的配置文件,可以用来配置拉取sspai-exporter的数据,具体内容如下,更多配置可参考官方文档,其中需要注意的是,主动拉取的频率不能太高,否则就会变成攻击服务器了,控制的参数是scrape_interval,目前设置的是30分钟拉取一次,测试的时候可以改成5s。
# my global config
global:
  # scrape_interval: 1m # Set the scrape interval to every 15 seconds. Default is every 1 minute.
  # evaluation_interval: 15s # Evaluate rules every 15 seconds. The default is every 1 minute.
  # scrape_timeout is set to the global default (10s).

# Alertmanager configuration
alerting:
  alertmanagers:
    - static_configs:
        - targets:
          - alertmanager:9093

# Load rules once and periodically evaluate them according to the global 'evaluation_interval'.
rule_files:
  # - "first_rules.yml"
  # - "second_rules.yml"

# A scrape configuration containing exactly one endpoint to scrape:
# Here it's Prometheus itself.
scrape_configs:
  # The job name is added as a label `job=<job_name>` to any timeseries scraped from this config.
  - job_name: "prometheus"

    # metrics_path defaults to '/metrics'
    # scheme defaults to 'http'.

    static_configs:
      - targets: ["localhost:9090"]

  - job_name: sspai-info
    scrape_interval: 30m
    static_configs:
- targets: ['sspai-exporter:3000']另外,如果修改了该配置文件之后要马上生效,可以用这个方法:curl -X POST localhost:9090/-/reload
配置完成之后,在该文件下使用命令docker-compose up -d。
打开刚部署成功的grafana管理后台,http://localhost:3000,然后导入我配置好的dashboard JSON,即可见到开篇所说的效果

如果是没有数据的话,很可能是设署拉取的时间太长,可以将scrape_interval改成5s,上面的章节也有提及。
其实本身的需求很简单,根本都不需要用到prometheus这一套这么重的工具,本来用TSDB和Chart.js就能搞好的,不过因为本身我自己的家用服务器就有了这一套工具,使用docker部署也最级方便,就有了这一篇文章了。
gauge 而不使用counter -> 因为可能like也可能取消;简单为主 metrics type此内容由惯性聚合(RSS阅读器)自动聚合整理,仅供阅读参考。 原文来自 — 版权归原作者所有。